Understanding the Psychology of a Dark Cloud Cover
This sudden reversal surprises those participants who had been expecting the upward trend to continue.

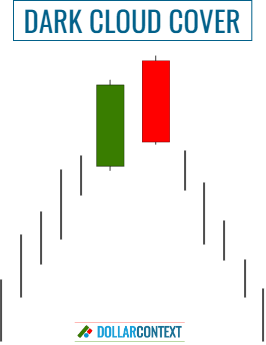
Today we’ll explore a relevant element of candlestick charts: the psychology underlying a dark cloud cover pattern, a two-candle combination that, to hold significance, should appear after an uptrend or an overbought market.
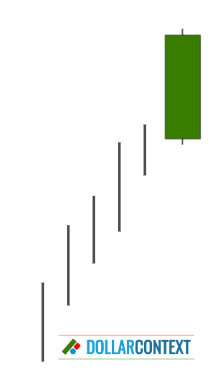
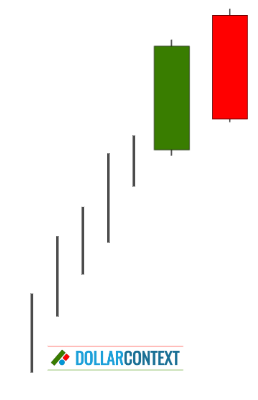
The pattern starts with a strong positive candle, indicating that buyers are in control and driving prices upward. That is, after a prior upward-trending market, the high closing price from this session further amplifies the prevailing bullish sentiment that was already in place.

The next trading session opens even higher, showing that the buying pressure remains strong. At this point, market players maintain their bullish perspective. The positive open reinforces participants' optimism while anticipating a continued upward trajectory.
Then the sentiment begins to shift. After the market opens higher, prices start to fall throughout the course of the second session. The price closes well below the midpoint of the first session's candle, creating a black or red candle. This sudden reversal surprises those participants who had been expecting the upward trend to continue.

The closing of the second session below the midpoint of the first candle's real body demonstrates that the bears have taken control, effectively casting a "dark cloud" over the bullish sentiment that was prevalent at the start of the second session.
The sudden shift in sentiment from bullish to bearish creates uncertainty and fear. Those who were buying near the highs are now at a loss. This situation may trigger further selling and, eventually, a new bearish trend.

The peak points in this pattern establish an area of resistance. This specific area could potentially serve as the stop loss in your dark cloud cover strategy.


