How to Identify a Dark Cloud Cover
For an optimal dark cloud cover, the second session should ideally conclude below the midpoint of the preceding white/green candle.

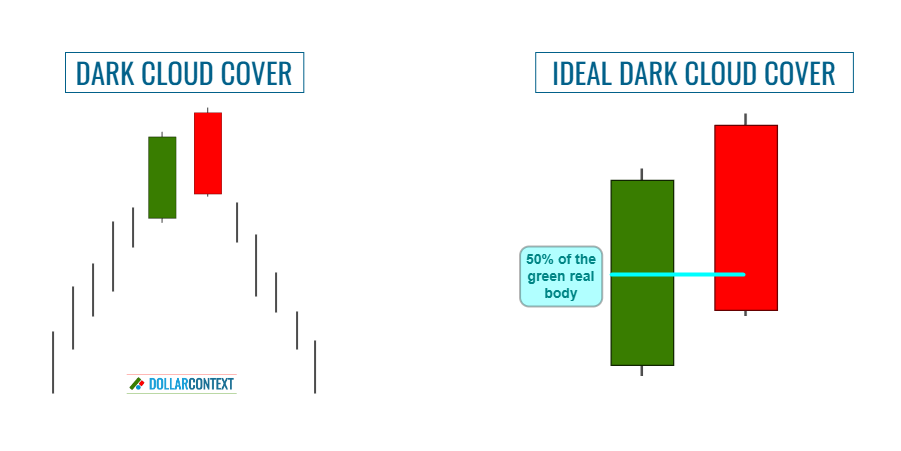
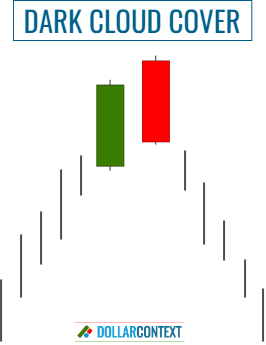
In Japanese candlestick charting, the dark cloud cover is a particularly helpful pattern consisting of two candle lines. It can be identified by these attributes:
- First Candle: The first candle of a dark cloud cover features a large white real body with relatively modest lower and upper shadows.
- Second Candle: In the second session, residual buying pressure causes the market to open at a higher level. However, as the session progresses, prices fall and the market ultimately closes below the midpoint of the prior real body.
- Previous Trend: This pattern is a reversal indicator and to be meaningful, it should emerge following a robust or prolonged upward trend.
For an optimal dark cloud cover, the second session should ideally conclude below the midpoint of the preceding white/green candle.
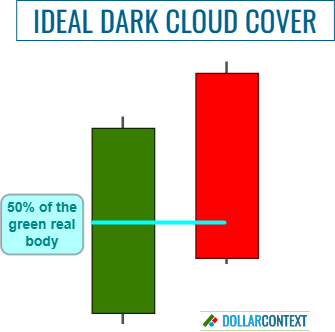
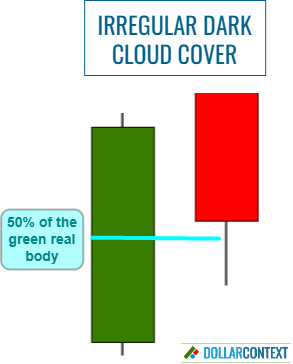
If the black/red candle fails to close below the halfway point, it is deemed by some Japanese traders as an incomplete or irregular dark cloud cover. Initially, the potential of an irregular formation as a bearish signal is diminished.
From a candlestick perspective, to serve as a reversal signal, an irregular dark cloud cover should be validated or reinforced by additional signs, such as:
- The irregular dark cloud cover emerges at a crucial resistance level.
- It is supported by other preceding or succeeding candlestick patterns.
- The size of the real bodies in the dark cloud cover pattern is unusually large when compared to the preceding candles.
- The pattern surfaces following an extremely overbought market.
The more of these conditions that are fulfilled, the greater the likelihood of the irregular pattern functioning as a dark cloud cover. However, it's important to note that as a general rule, the further the close of the dark cloud cover's second session penetrates into the white candle, the stronger the bearish signal.
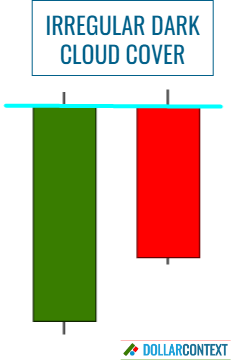
Ideally, a dark cloud cover should have the second session opening above the high of the previous session. However, in certain markets, such as those dealing with extremely low-volatility assets or hourly time frames, this scenario may be highly unlikely. In such instances, this rule can be flexibly interpreted, allowing for irregular dark cloud covers where the opening of the second session happens below the high of the first candle or even at the same level as the close of the first real body.
However, for such a formation to be considered a significant bearish signal, it should be backed up by several of the aforementioned conditions associated with irregular dark cloud covers. That is, it should be viewed in the context of the surrounding technical picture, and not in isolation.
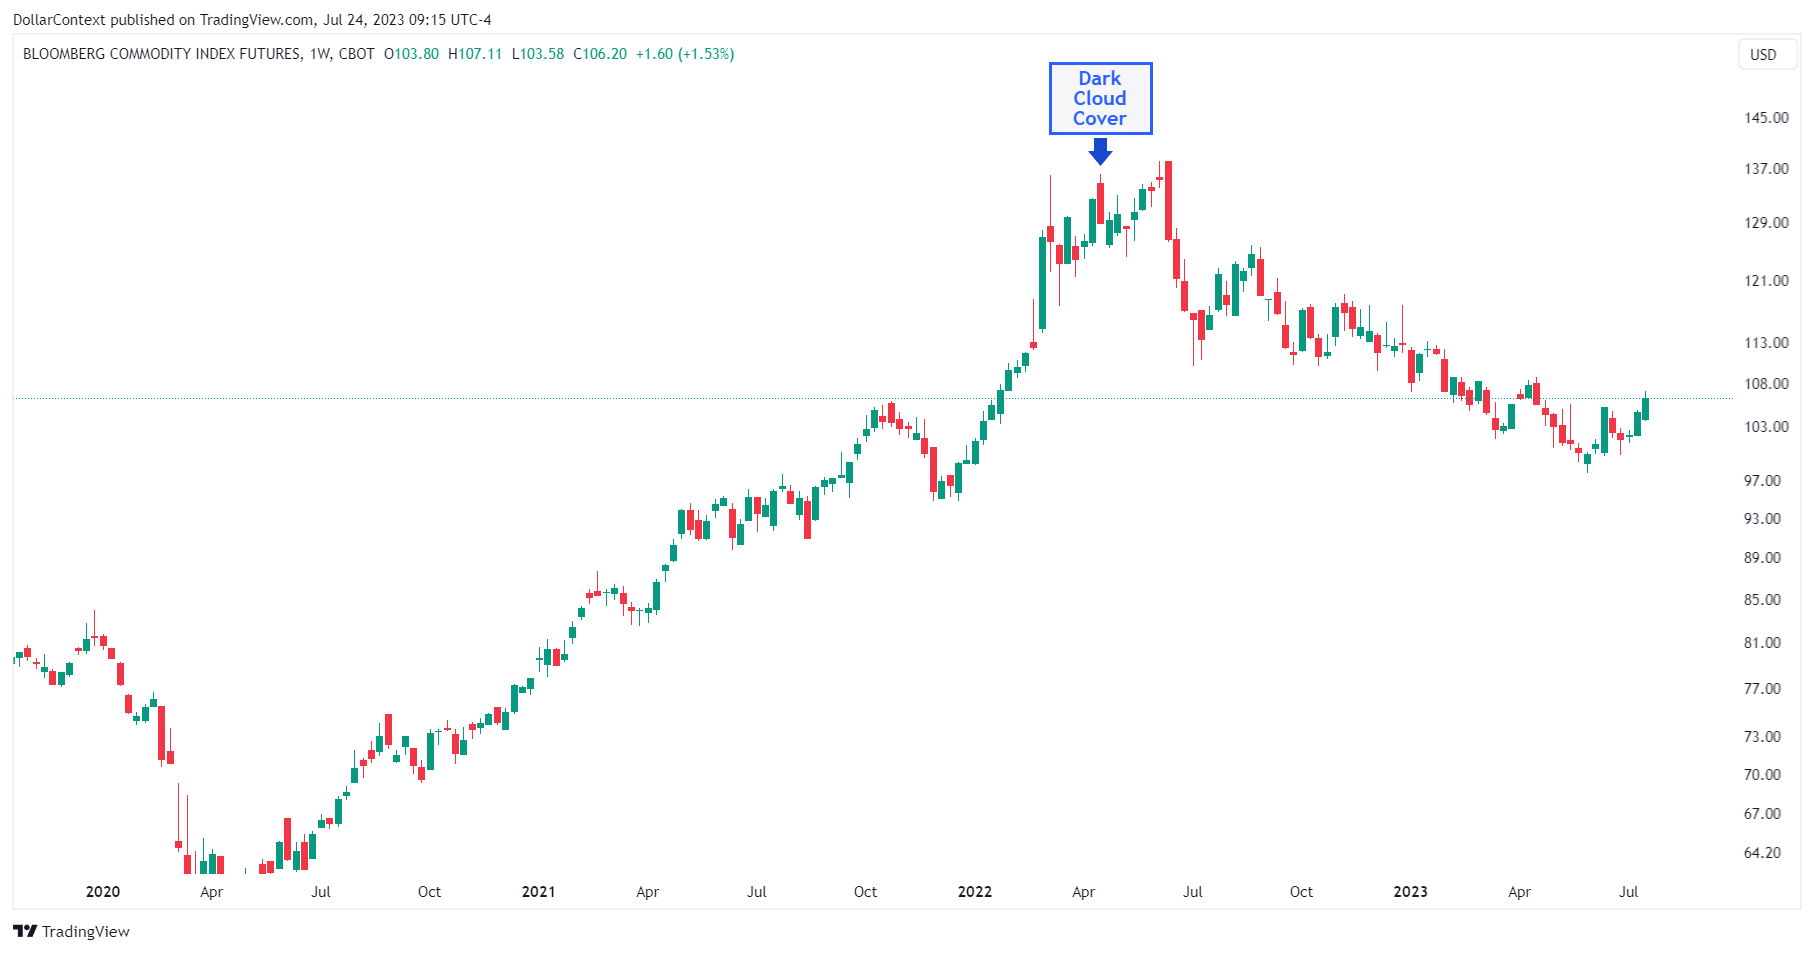
The highs of a dark cloud cover become resistance. This area can serve as the stop loss of your dark cloud clover strategy.
The following chart of the Bloomberg Commodity Index displays a dark cloud cover located at a peak price zone. Observe how the price momentarily breaches the highs of the dark cloud cover, only to quickly revert, thereby validating the bearish implication of this pattern.