Dark Cloud Cover: How to Set Your Stop-Loss
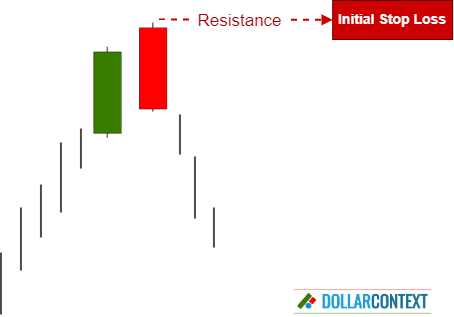
The highs of the dark cloud cover creates a resistance area. This resistance level represents your initial stop loss.
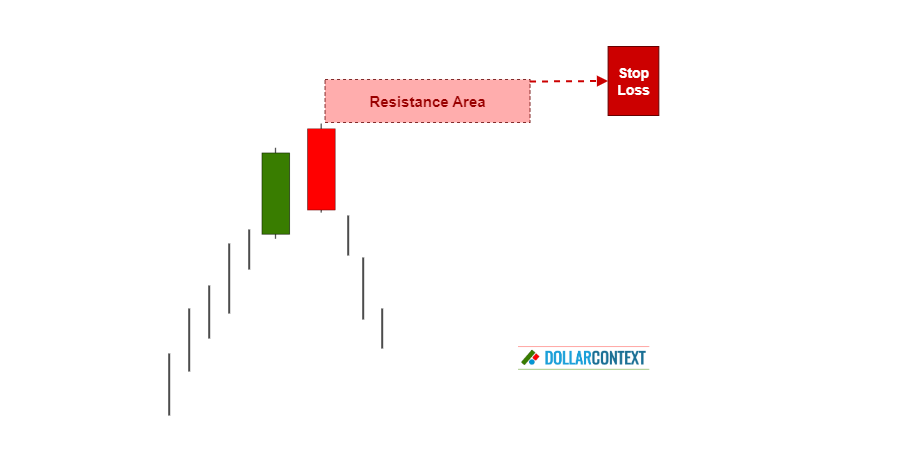
Candlestick patterns, like the dark cloud cover, provide crucial insights about the optimal timing for trade entries. The implementation of a proper stop-loss when using these techniques is essential for risk management.
Here are detailed, step-by-step instructions for setting a stop loss following the appearance of a dark cloud cover pattern:
1. Proper Identification
Make sure you correctly recognize the dark cloud cover pattern on your trading chart. Typically, this pattern is characterized by:
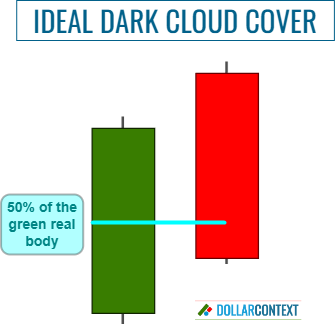
- The initial candle in a dark cloud cover exhibits a significantly large white or green body, accompanied by comparatively modest lower and upper shadows.
- In the second session, the market opens at a higher level. However, as the session progresses, prices fall. Eventually, the trading session concludes below the midpoint of the first real body.
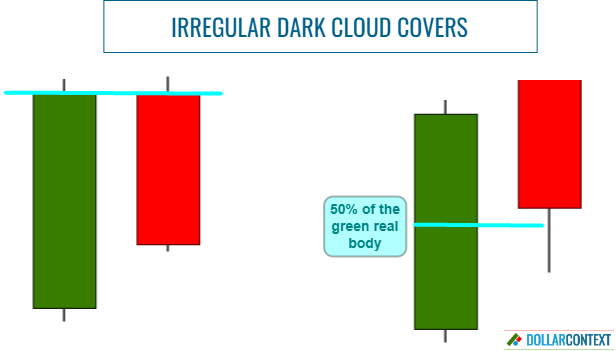
In instances where the black or red candle doesn't open above the first candle or close below its halfway mark, some Japanese traders view it as an incomplete or irregular dark cloud cover. For an irregular pattern to be acknowledged as a valid dark cloud cover combination, the pattern should meet at least two of the following conditions.
- The pattern appears at a significant resistance level.
- The pattern is further reinforced by other preceding or subsequent candlestick patterns that occur around the same price level.
- Compared to the preceding candles, the bodies in the dark cloud cover pattern are notably larger.
2. Verify the Prior Trend
Psychologically, a dark cloud cover symbolizes a shift in market sentiment. It acts as a reversal indicator, implying that it requires a preceding bullish trend to invert.
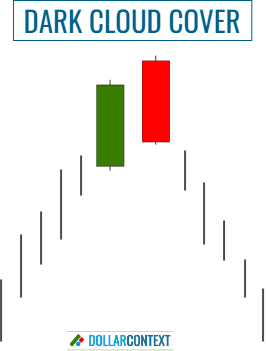
In the event of a sideways trading market or a declining one, the dark cloud clover holds no significance.
3. Pinpoint Your Initial Stop Loss (Resistance Level)
The highs of the dark cloud cover create a resistance area. This resistance level represents your initial stop-loss.
4. Consider Adding a Buffer
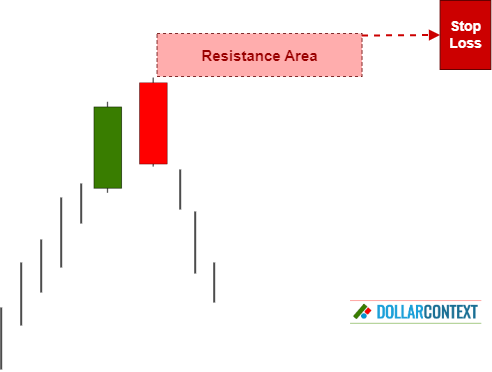
Based on factors like market volatility, risk management strategies, and varying market conditions, you might consider introducing a buffer. This extra safeguard can help you prevent being impacted by false breakouts.
5. Is Your Stop Based on the Close?
A stop triggered upon close happens when the closing price crosses the stop-loss threshold, rather than relying entirely on intra-session price fluctuations.
Decide if you should set your stop at a close level above the resistance. When using candlestick charts, a stop at a close is typically recommended.
In general, when identifying an optimal dark cloud cover, the stop should be based on the close. By contrast, if the combination is an irregular or incomplete dark cloud cover, the bearish implications of the pattern are diminished, and therefore you can base your stop-loss strategy on the intra-session price action.
6. Monitor the Trade
Keep an eye on the market and your position to ensure they are consistent with your trading strategy::
- Adjust your stop-loss as needed. Market conditions can shift dynamically. As your trade unfolds, new candlestick patterns might surface. In such a scenario, you can make minor modifications to your stop-loss point to fall in line with the evolving market structure.
- In the case of favorable price movements, consider implementing a trailing stop-loss to secure gains and control risk.
- Stay disciplined. Refrain from emotionally driven decisions, even amidst market volatility.


