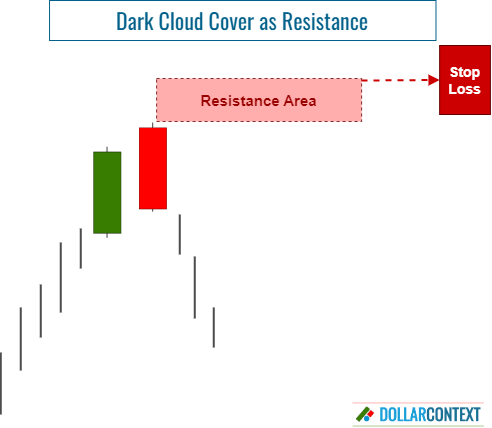
Dark Cloud Cover as Resistance
The highs of a dark cloud cover usually becomes resistance. This level acts as a ceiling that price struggles to break through.

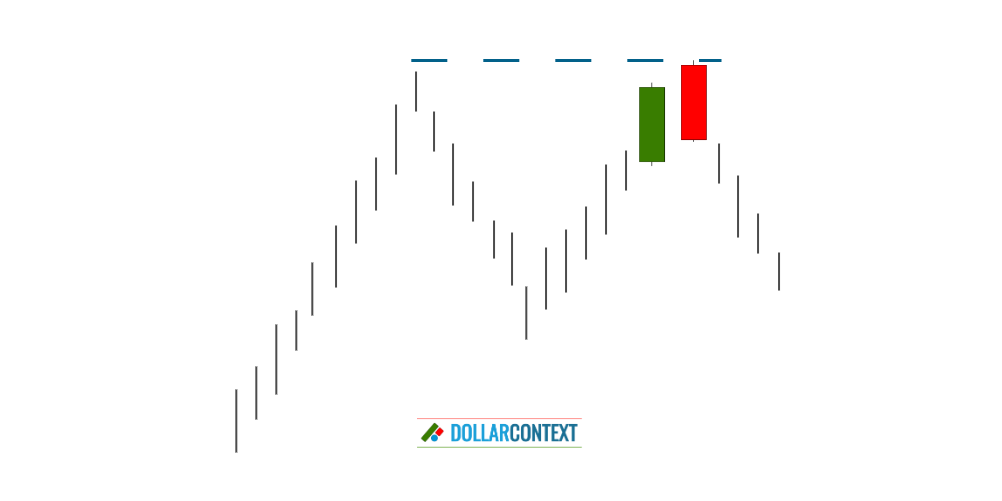
The dark cloud cover indicator is a bearish reversal candlestick pattern that suggests a potential short-term top in price. It consists of two candles: a bullish (green or white) candle, followed by a bearish (red or black) candle that opens higher than the previous session's high (creating a gap up) but closes below the midpoint of the previous day's body.
The highs of a dark cloud cover usually become resistance. This level acts as a ceiling that the price struggles to break through. In this context, we can identify two types of situations:
- The dark cloud cover emerges at a resistance level that was identified earlier.
- The dark cloud cover pattern forms after reaching a new high.
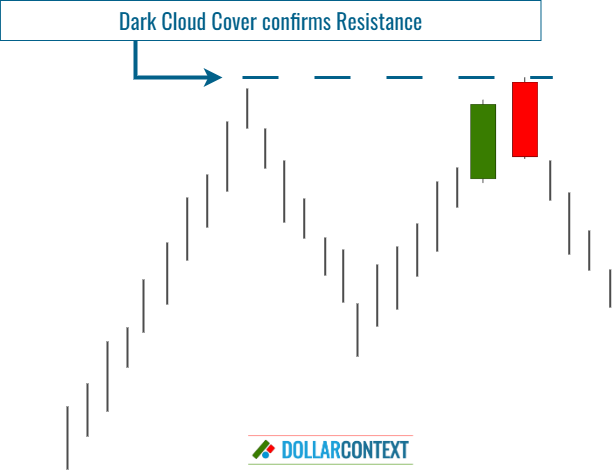
1. Dark Cloud Cover Confirms Resistance
If the pattern forms at a previously identified resistance level, it further confirms the robustness of this resistance, indicating that the market may indeed be reversing into a downtrend.
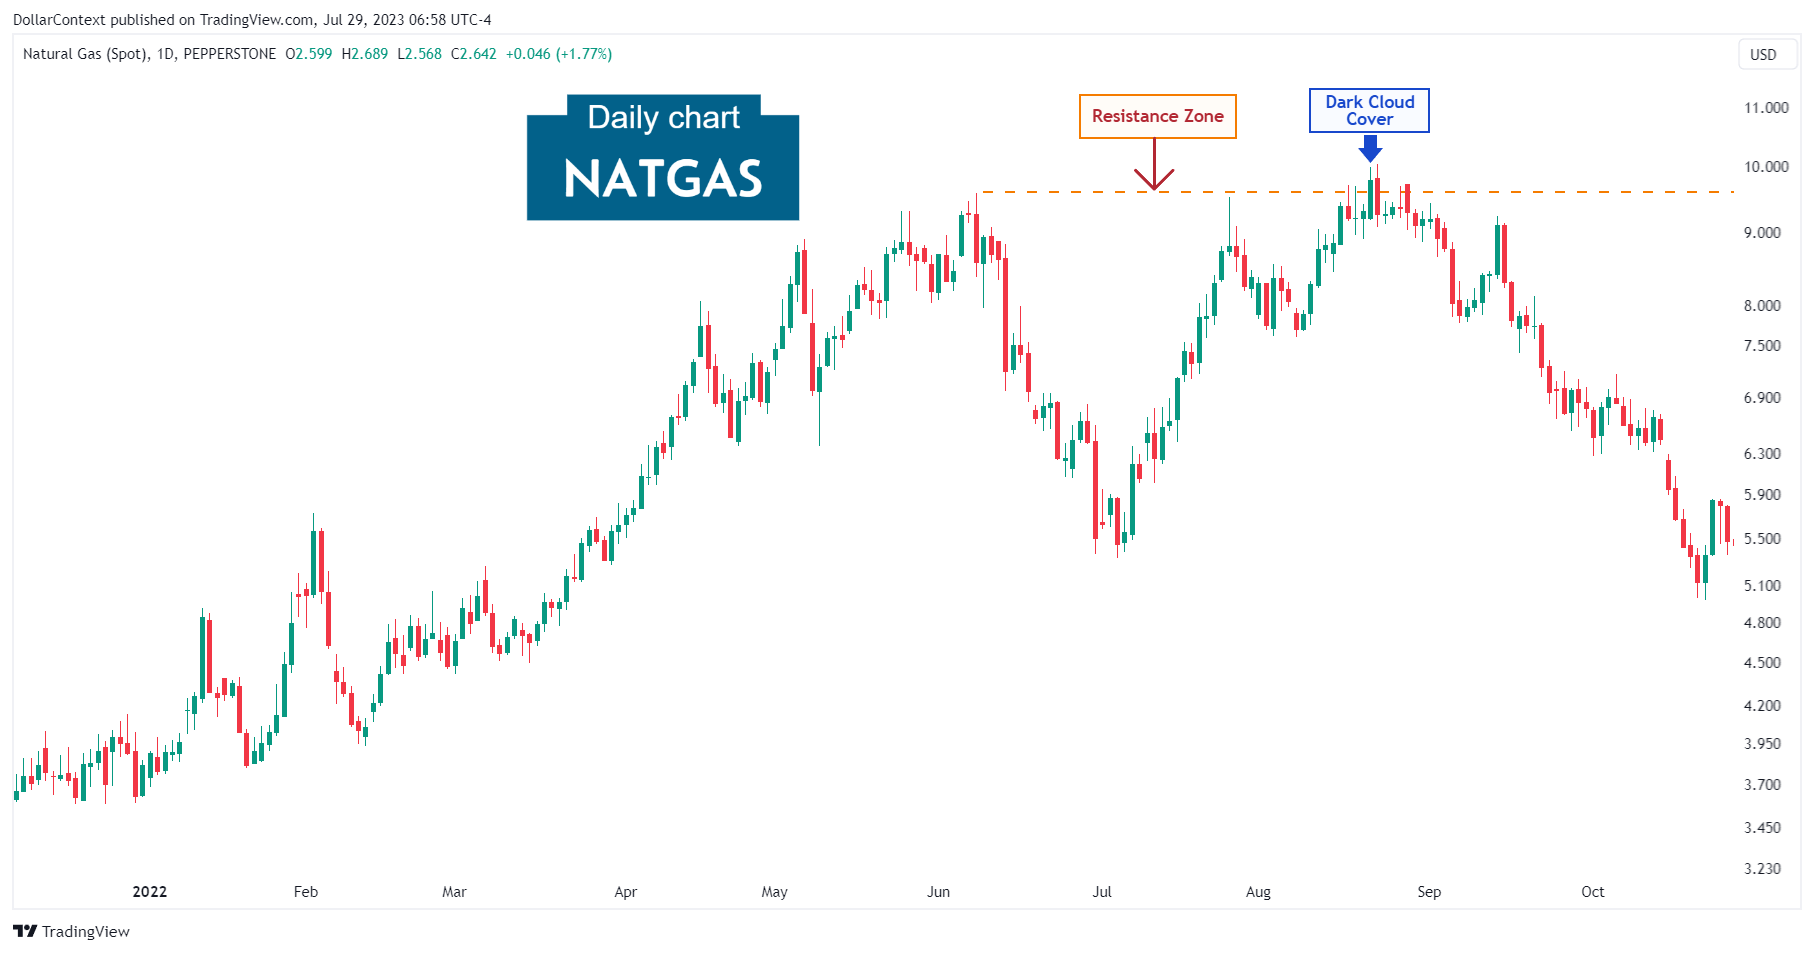
This chart of natural gas shows how a dark cloud cover pattern (observed near the $10 mark in August 2022) validates a resistance level previously set around this price.
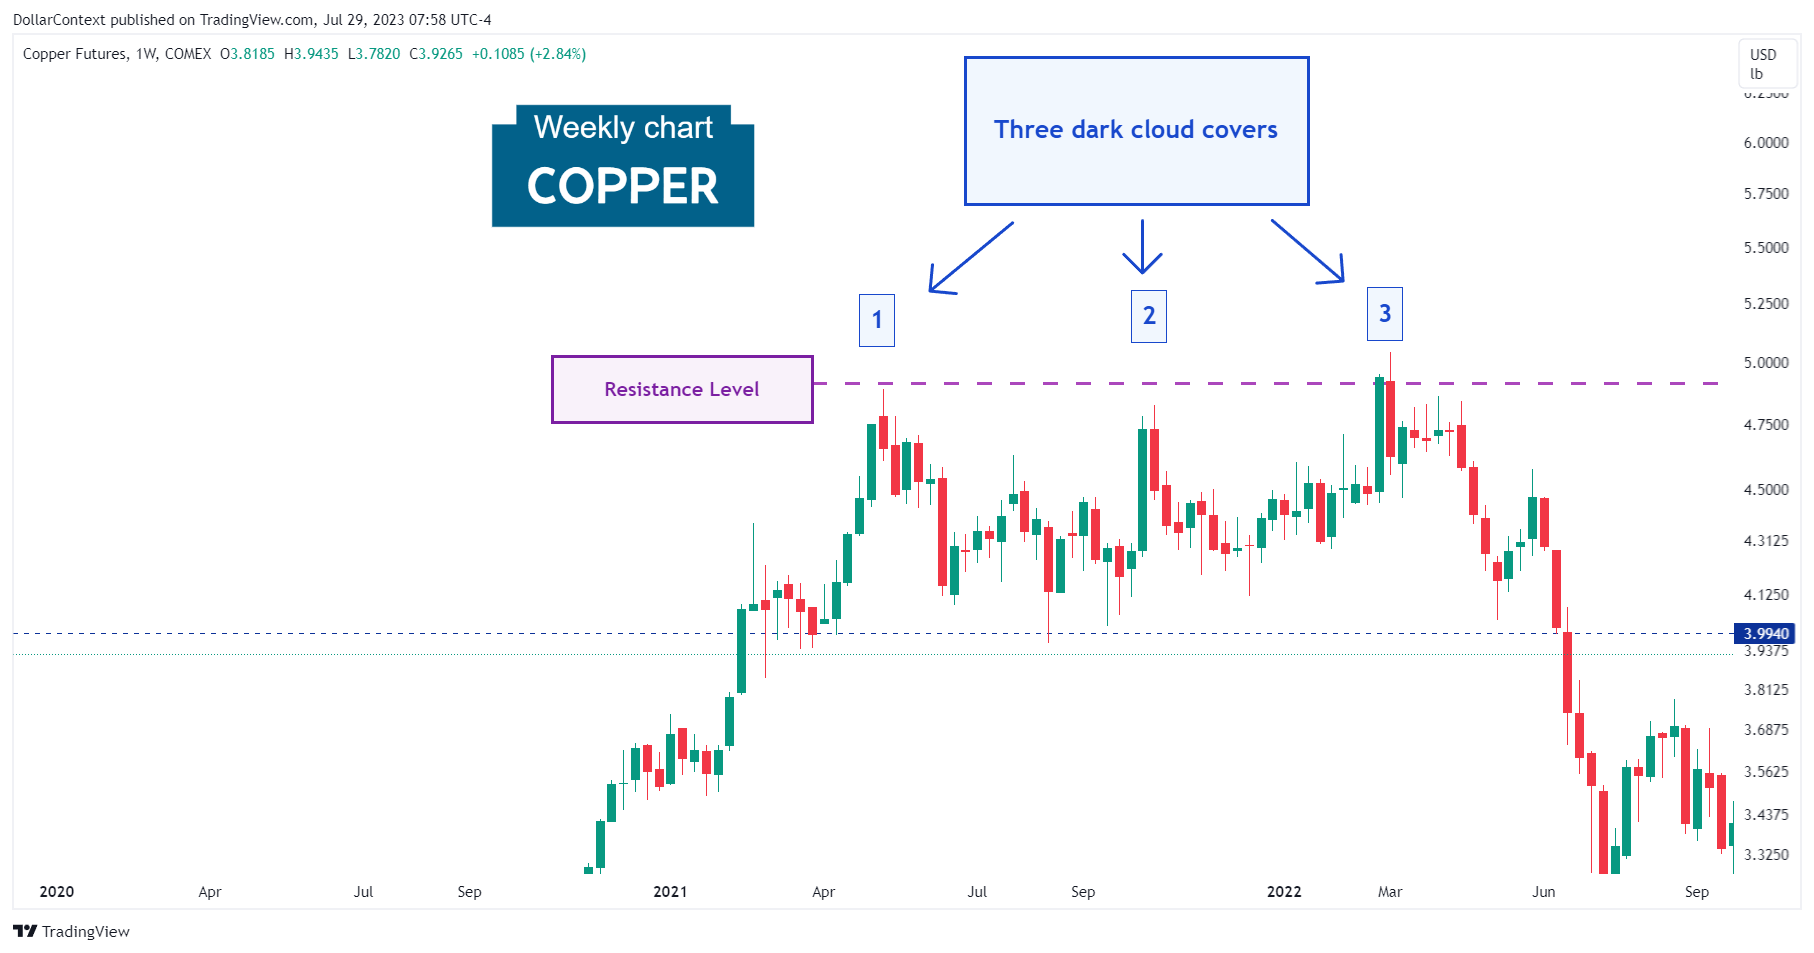
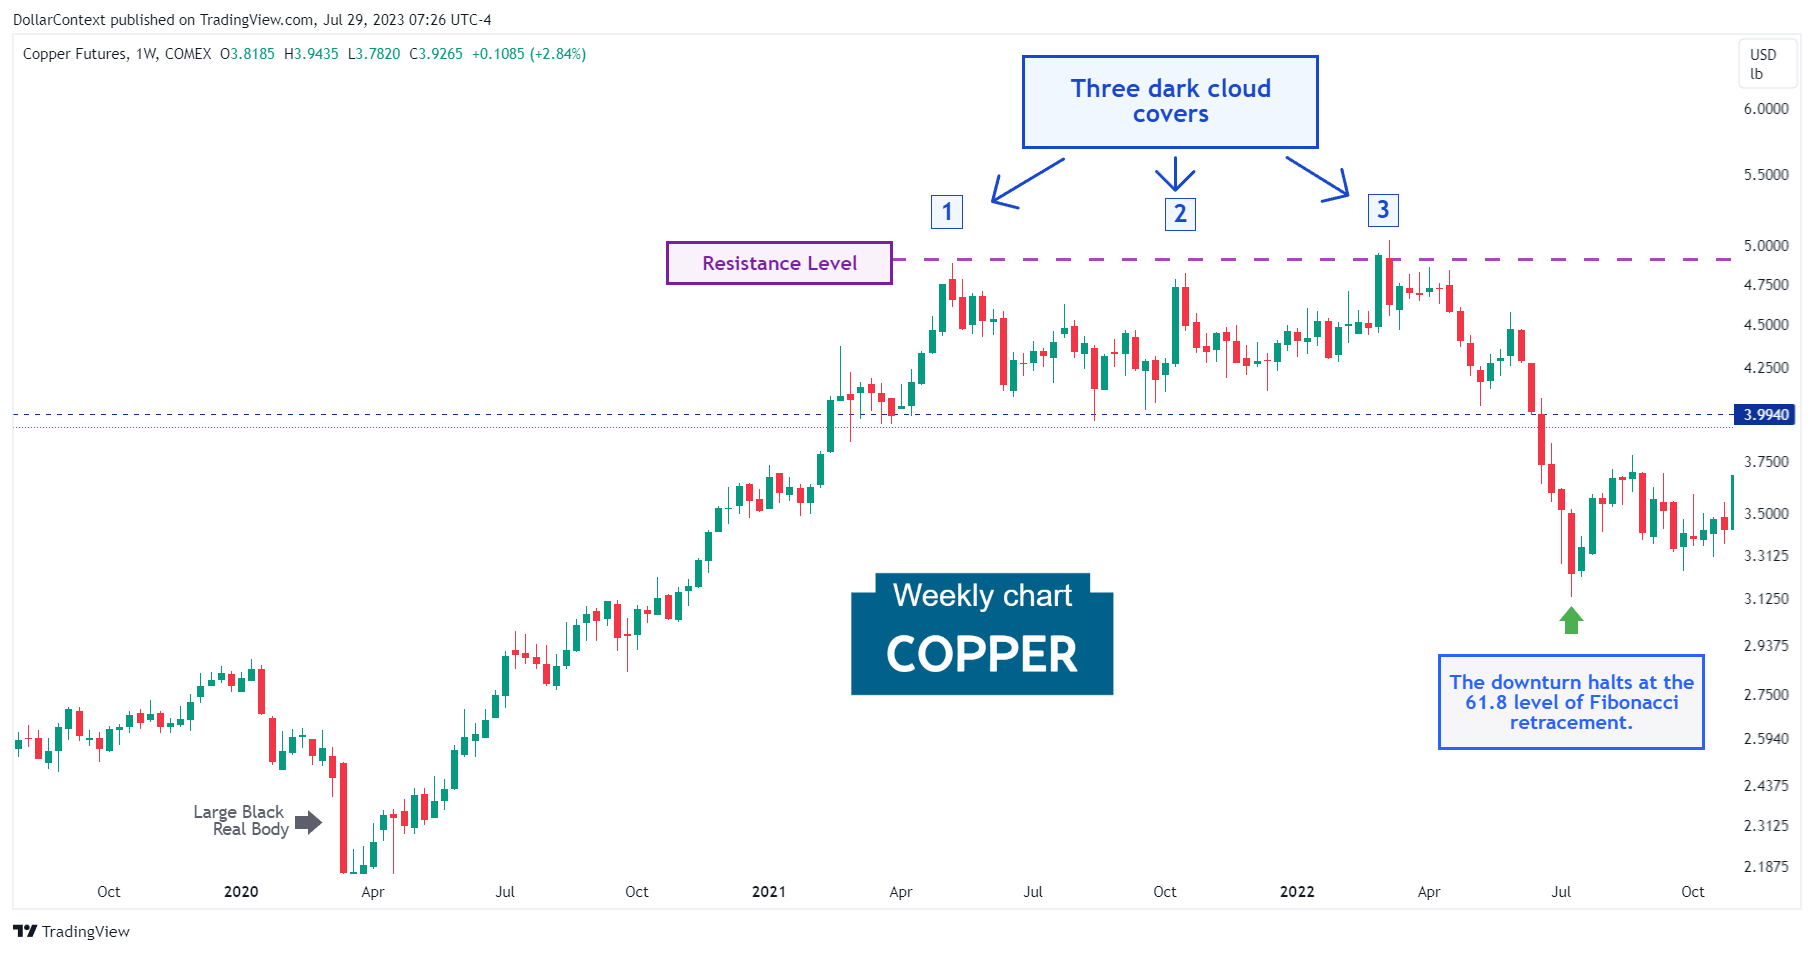
2. Setting a New Resistance Level
If the dark cloud cover pattern forms a new high, it creates a fresh resistance zone that you can use to determine your stop-loss level. Traders are usually advised to monitor this region closely.
In May 2021, the weekly chart of copper exhibited a dark cloud cover (noted as “1” on the chart), which led to the formation of a relatively new resistance level. Intriguingly, this high point was later successfully validated as resistance through the manifestation of two additional dark cloud covers.
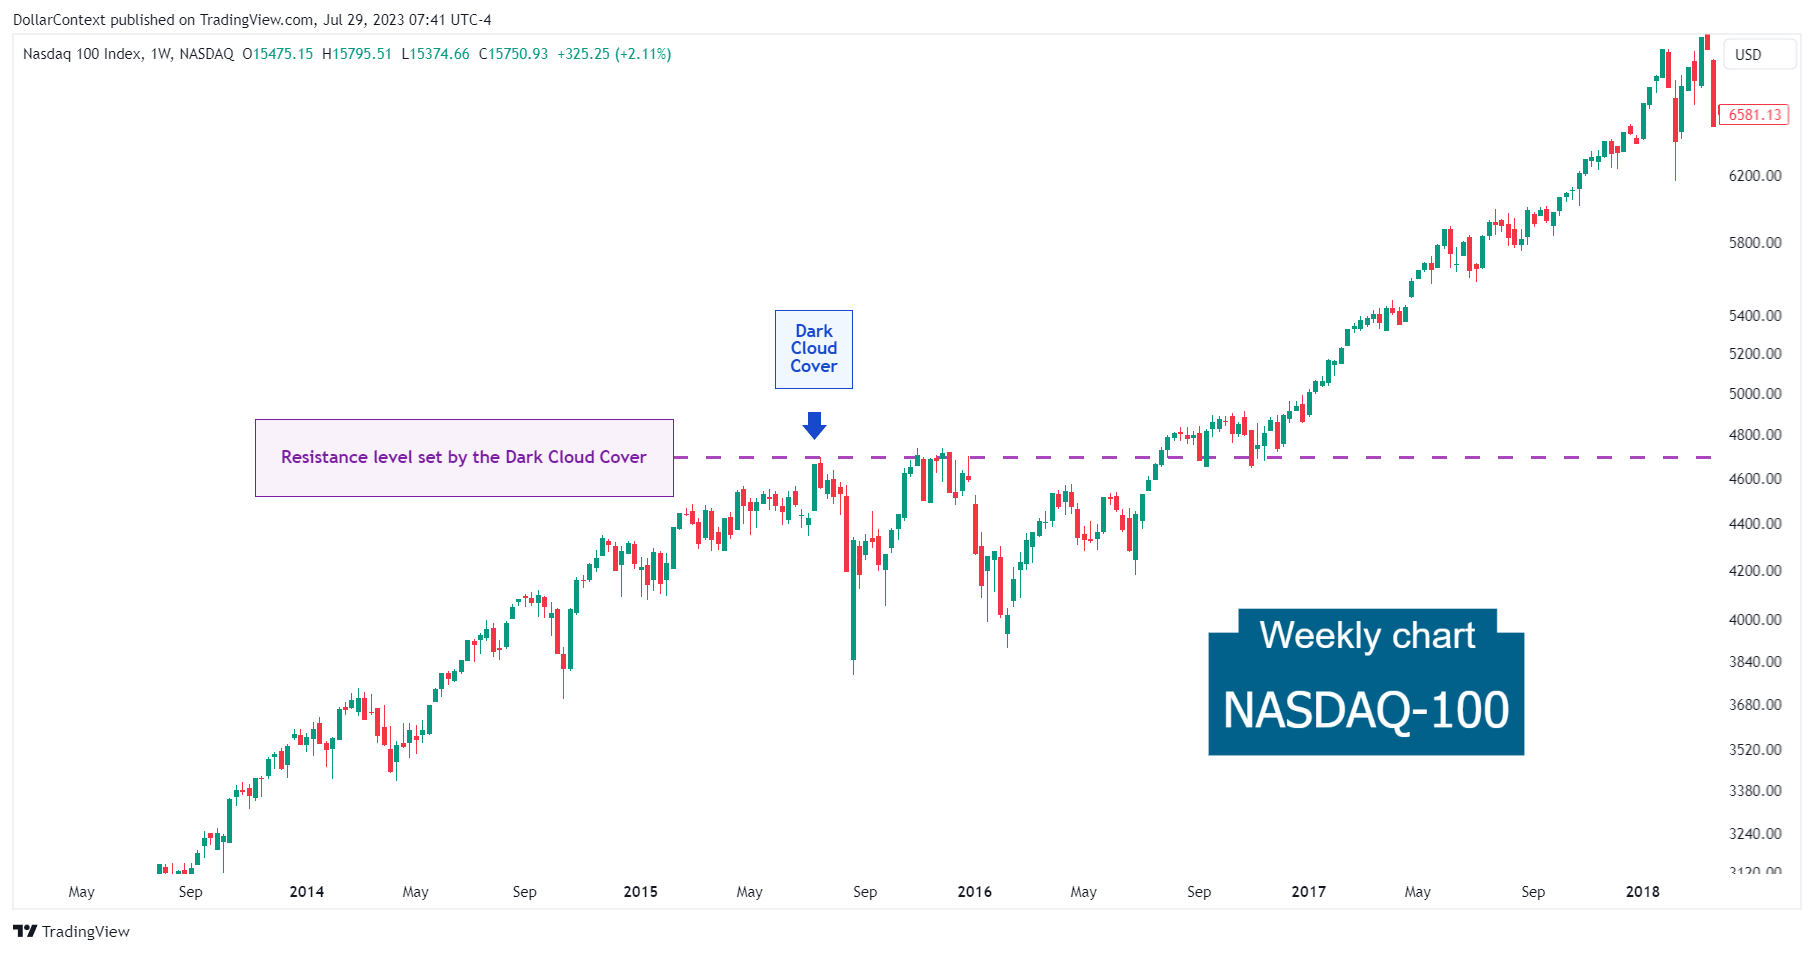
3. Breakout of the Resistance Level
As with any form of technical analysis, there should be a price at which you should reconsider your initial strategy based on a resistance level set by a dark cloud cover.
For a pattern like the dark cloud cover, if the price settles above the peak of the resistance, it's likely that the market will continue its upward trajectory.
The weekly chart of the NASDAQ-100 during 2015 and 2016 exhibits a successful breakout of the initial resistance set by the dark cloud cover.
4. False Breakouts
A breakout of a resistance level is often seen as a potential trading signal, with the expectation being that the price will continue to move in the same direction as the breakout.
In many instances, however, the market does not continue to accelerate in the same direction. Instead, it reverses course and moves back within the previous range.
To mitigate the chances of being stopped out when using a stop loss with a dark cloud cover, you can implement these actions:
- Base your stop-loss on the close.
- Consider adding a buffer.
- The credibility of the breakout diminishes drastically if one or more candlestick patterns appear at, or marginally above, the original resistance level established by the dark cloud cover.
This chart is a closer view of the copper chart displayed in section 2. Notice how the peak points of the dark cloud cover, labeled "3," breached the resistance levels set by the initial dark cloud cover. However, this ended up being a false breakout.