
Doji Strategy: A Comprehensive Tutorial
Today, we'll examine a crucial indicator of Japanese candlestick charting: the doji.

We'll examine a crucial indicator of Japanese candlestick charting: the doji.
Before exploring the details of this formation, let's underscore three fundamental characteristics of most candlestick patterns, including the doji:
- Trend Reversal: Candlestick patterns often serve as signals of potential reversals, indicating that the current trend might be nearing its end, and a shift in direction could be on the horizon. For the doji, it can appear following either an uptrend or a downtrend.
- Different Timeframes: They are versatile across diverse time frames in liquid markets, ranging from minutes and hours to days, weeks, and even months.
- Different Asset Classes. They are applicable in any market with available price data, whether it's commodities, stocks, forex, or indices. This versatility arises because candlestick patterns are based on price action.
Contents
1. The Shape of a Doji
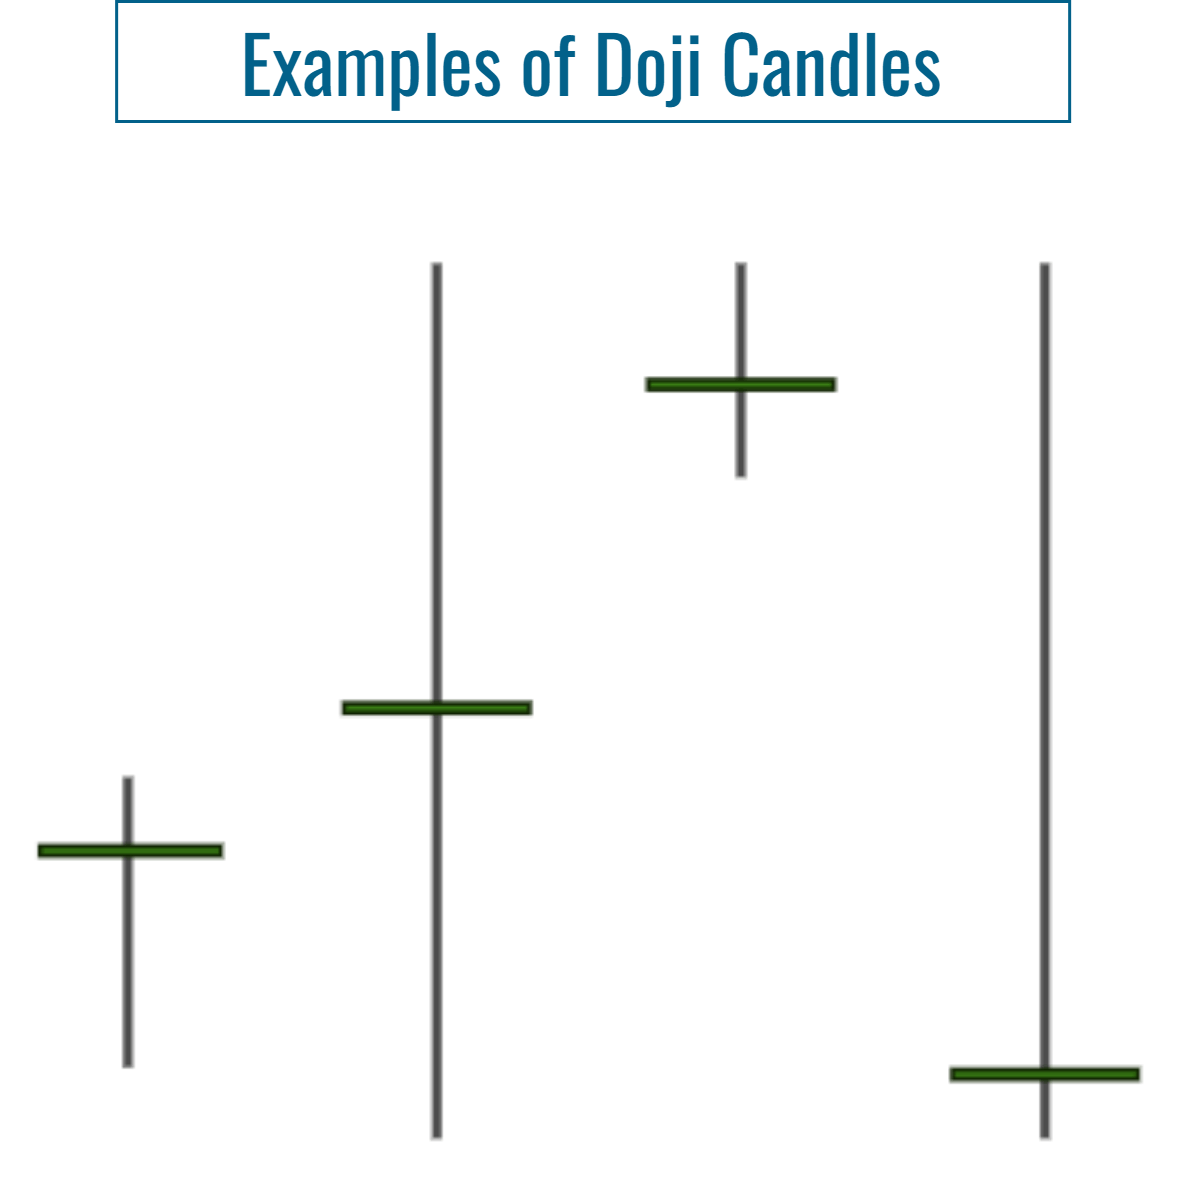
A doji is a candlestick where the opening and closing prices are virtually the same. Visually, it is represented by a very thin line (or a cross or plus sign), signifying that there was little movement between the opening and closing prices.
The length of the upper and lower shadows can vary. The doji is often interpreted as a sign of indecision in the market, with neither the buyers nor the sellers gaining a clear advantage.
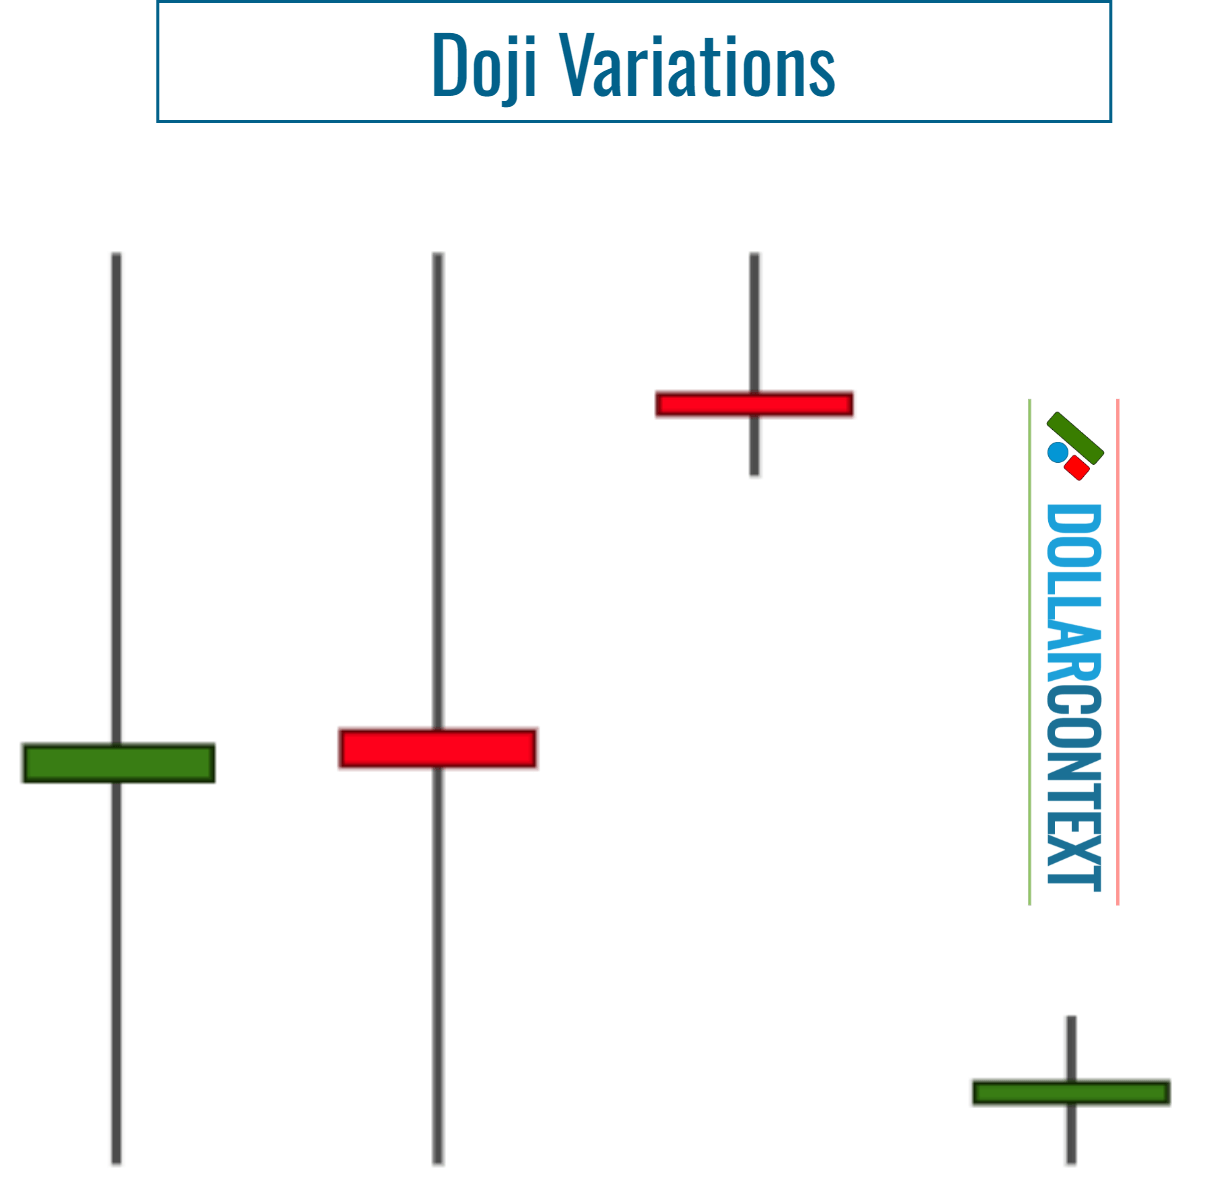
While traditionally a doji has the exact same opening and closing prices, in practical analysis, if the opening and closing prices are extremely close, the candle can still be considered a doji under certain conditions. These conditions are described in the following two sections. A near-doji session can be termed a variation of a doji.
2. Context
When determining the significance of a doji session, the circumstances under which this candlestick appears are as relevant as the candle's form itself.
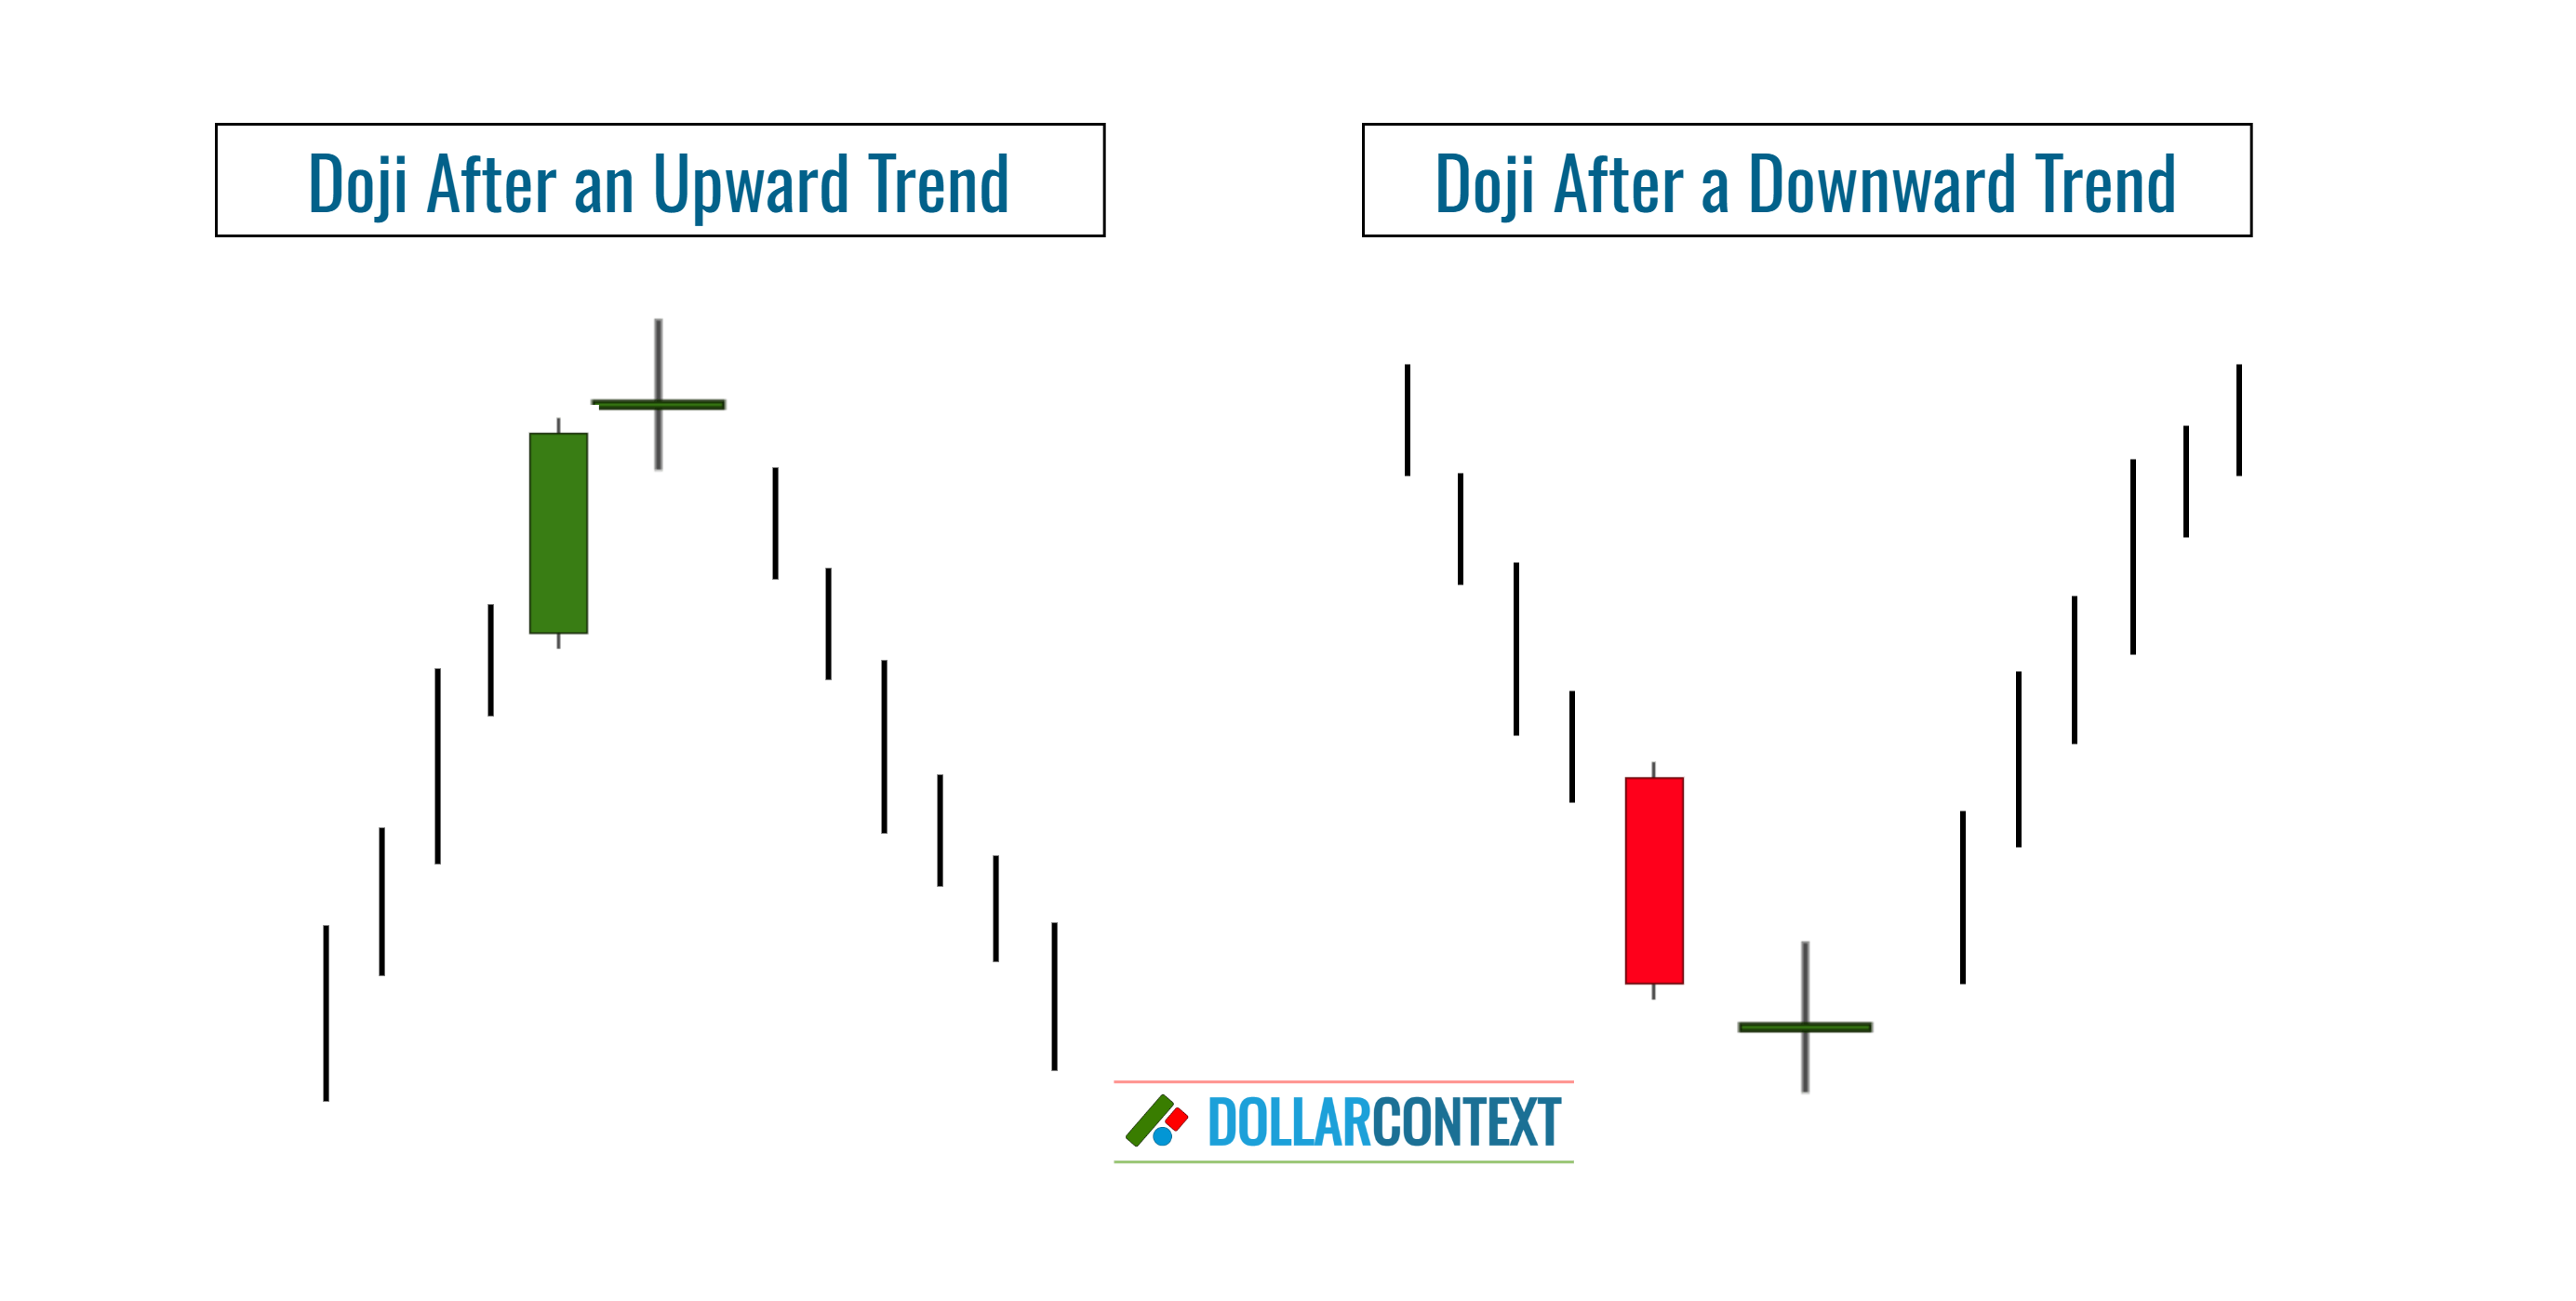
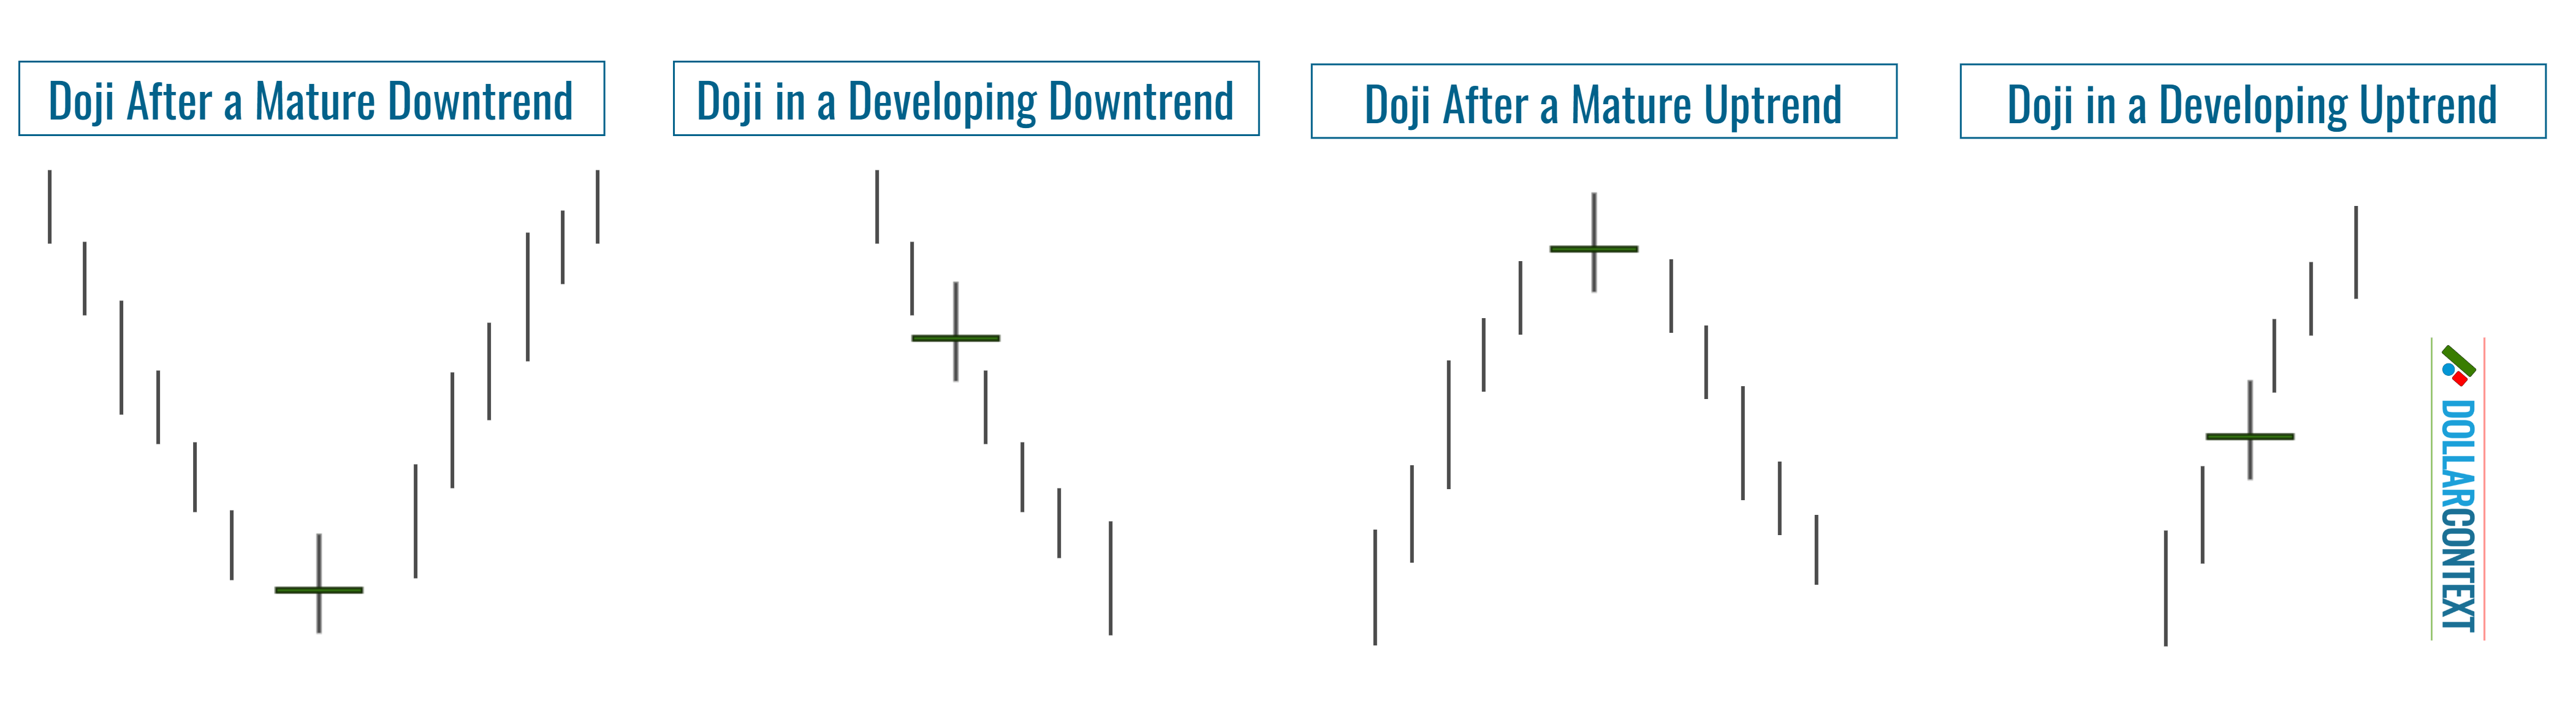
A doji represents perfectly a market in equilibrium, hinting at a possible inflection point between bulls and bears. When a doji surfaces following a sustained uptrend or a prolonged downtrend, it signals a potential shift in the market direction.
Mature vs. Emerging Trends: A doji following a swift upward movement may suggest a market peak. However, if the market has only recently started its upward trajectory, the chances of it being at its zenith are diminished. The same logic applies when the doji appears in a downward move.
In sideways trading scenarios, a doji is neutral, symbolizing minor market indecision. However, if a doji surfaces near the upper or lower boundary of a broad range, it could indicate a shift towards the opposite extreme of that range.
Why a doji candle near the base or a top of a wide range can indicate a reversal? It's because this indicator appears after a minor downtrend, set against the backdrop of a prevailing lateral price movement on a broader scale.
After the appearance of a doji, the probability of a reversal increases in relation to the length and intensity of the preceding trend.
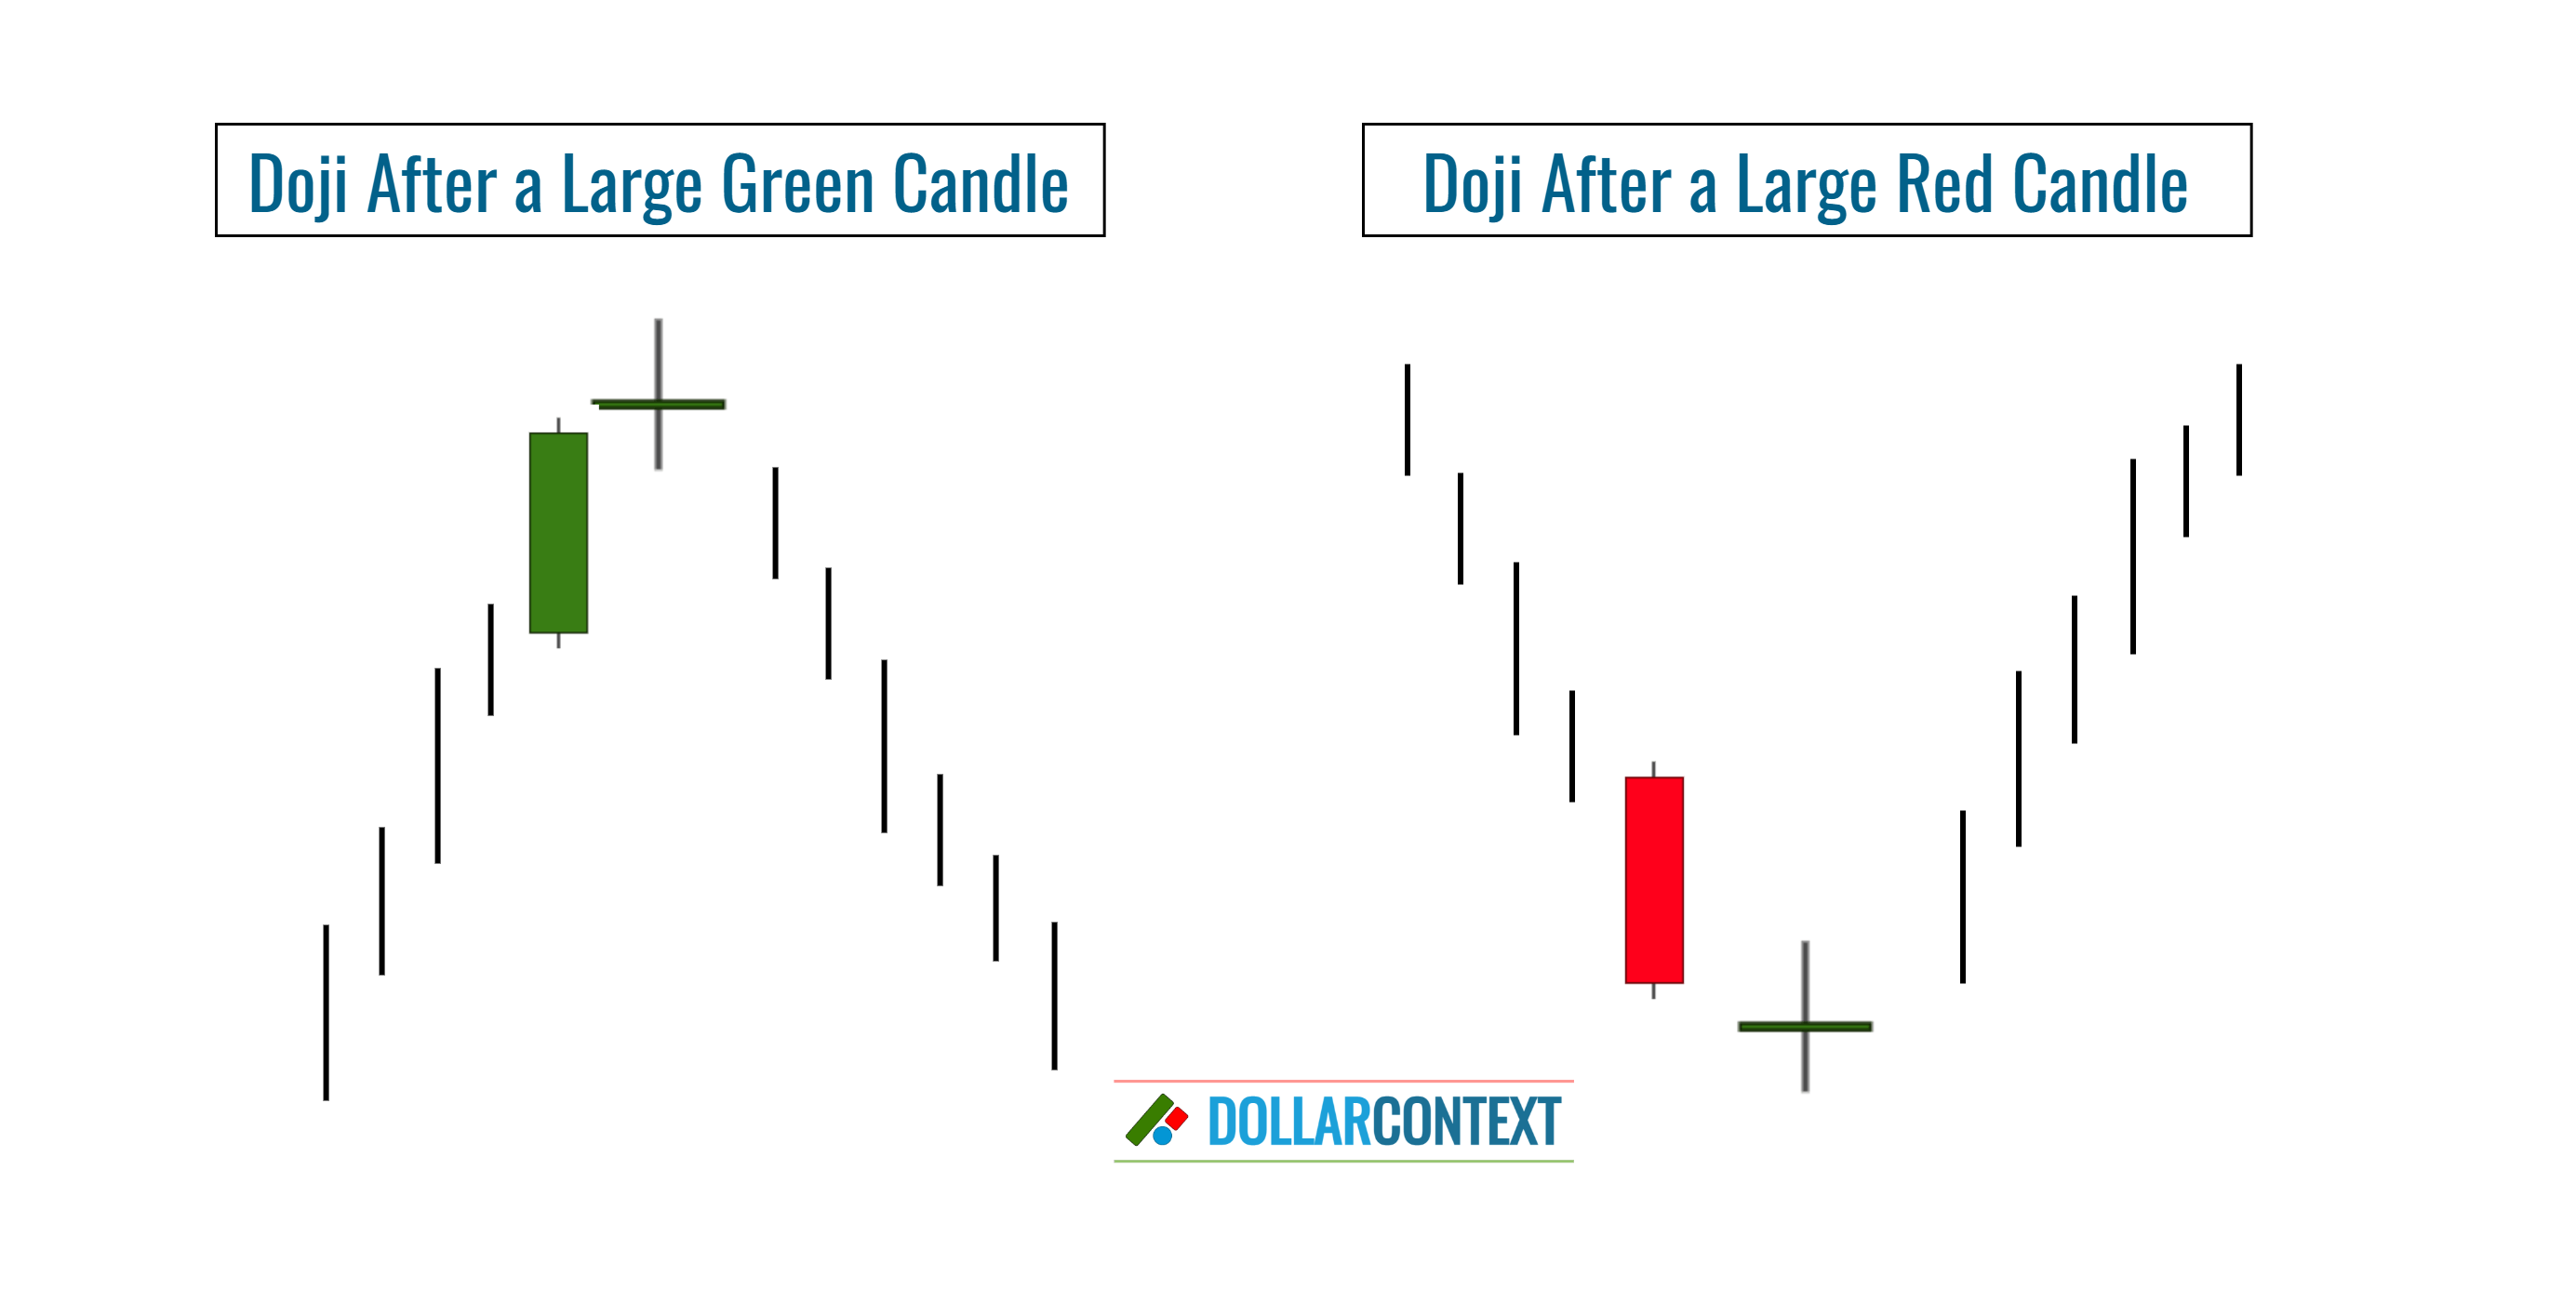
A doji becomes particularly meaningful when it appears following a tall white/green candle, especially if this candle comes after a prolonged or distinct uptrend. In these situations, the Japanese perceive the market to be "exhausted." Yet, if this peak is exceeded, the market's upward trajectory might continue. The same reasoning applies when a doji emerges after a lengthy black/red candle that follows a downtrend.
When evaluating the doji's trustworthiness as a reversal signal, the following contextual factors are relevant as well:
- Support/Resistance Zone: The reversal implications of a doji are markedly amplified if it surfaces within a known support or resistance region.
- Subsequent Candlestick Patterns: In some cases, a doji might be surrounded by other reversal patterns within a similar price bracket. The presence of these patterns collectively boosts the likelihood of a genuine reversal.
- Market Extremes: If a market is nearing an extremely oversold or overbought state, the chances of a trend shift following a doji heighten.
3. Confirmation
A doji shouldn't be hastily interpreted as a direct buy or sell signal. While it can suggest a potential trend shift, it's more accurate to see it as a sign of a transitional market. Traders should ideally wait for the following sessions after a doji to ascertain the market's direction.
How can we determine if a doji variation, that is, a session resembling a doji (with close, yet not identical opening and closing prices) truly qualifies as a doji? While there's no strict rule book for this, several methods can guide your judgment:
- Prior Bodies: When the session in question is preceded by a sequence of small real bodies in an ascending or descending market, the significance of the near-doji-like candle might be lessened. Yet, if multiple doji candles appear within the same price area following a well-established trend, the chances of a trend reversal grow.
- Frequency of Doji on a chart: Doji candles act as unique indicators of potential trend shifts. Their relevance increases in markets where they're a rare sight. If a chart routinely showcases numerous doji sessions, the emergence of another one might not be deemed particularly noteworthy.
- Market Junctions: If the market is at a critical juncture, a near-doji candle is more significant.
- Following Candlestick Patterns: The presence of other candlestick patterns around the near-doji session, which either corroborate or magnify the prospect of a market change, It suggests that the near-doji is probably a valid indicator of a turnaround in the market.
4. Psychology Behind a Doji
Psychologically, a doji is a visual representation of possible changing mood in the market.
In essence, the doji captures a moment of indecision and uncertainty in the market. The psychological interpretation hinges on the realization that, after all the trading activity during that period, traders couldn't commit to a clear direction.
This indecision, especially when observed after a pronounced trend, can be a crucial clue for traders about potential reversals or continuations.
5. Types of Doji Candles
According to the location of the doji's body in relation to its shadows and other situational aspects, we can identify the following types of doji candlesticks:
- Standard Doji: This is the traditional doji where the opening and closing prices of the candle are identical or nearly so.
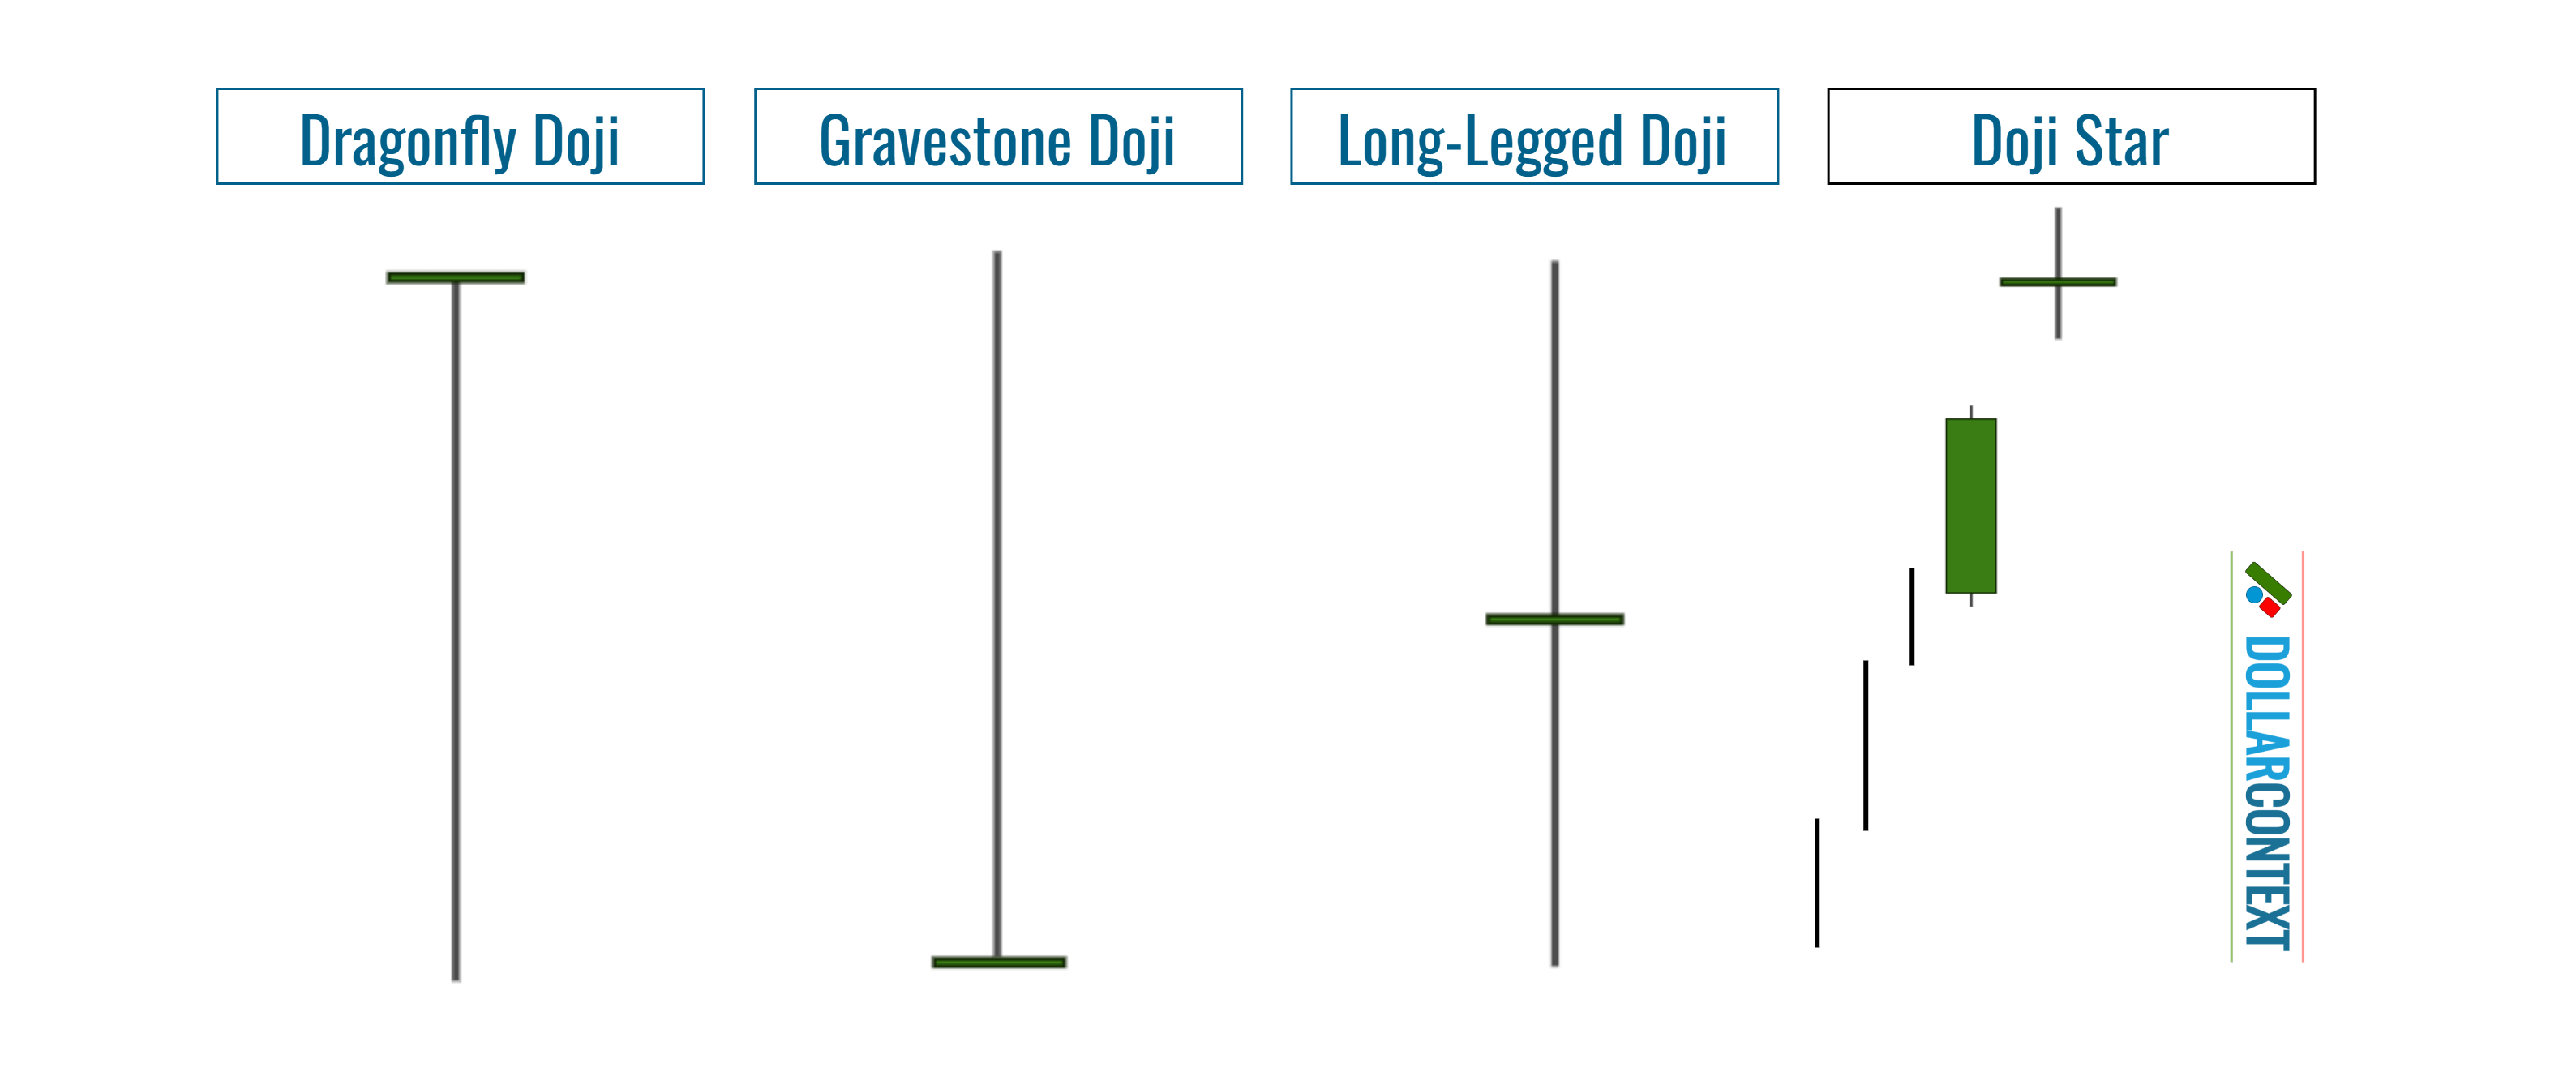
- Dragonfly Doji: With the opening, closing, and high prices aligning closely and a prominent lower shadow, this signals a surge in buying interest.
- Gravestone Doji: It showcases nearly identical opening, closing, and low prices with a dominant upper shadow, hinting at increased selling interest.
- Long-legged Doji: Characterized by extended shadows on both ends, it highlights pronounced volatility and heightened market indecision.
- Doji Star: A star displays a compact real body positioned away from the previous candle's body. If this star takes the form of a doji instead of a minor real body, it's labeled a doji star.
6. Entry Points for a Doji Strategy
When opening a position after a doji, you can use different strategies.
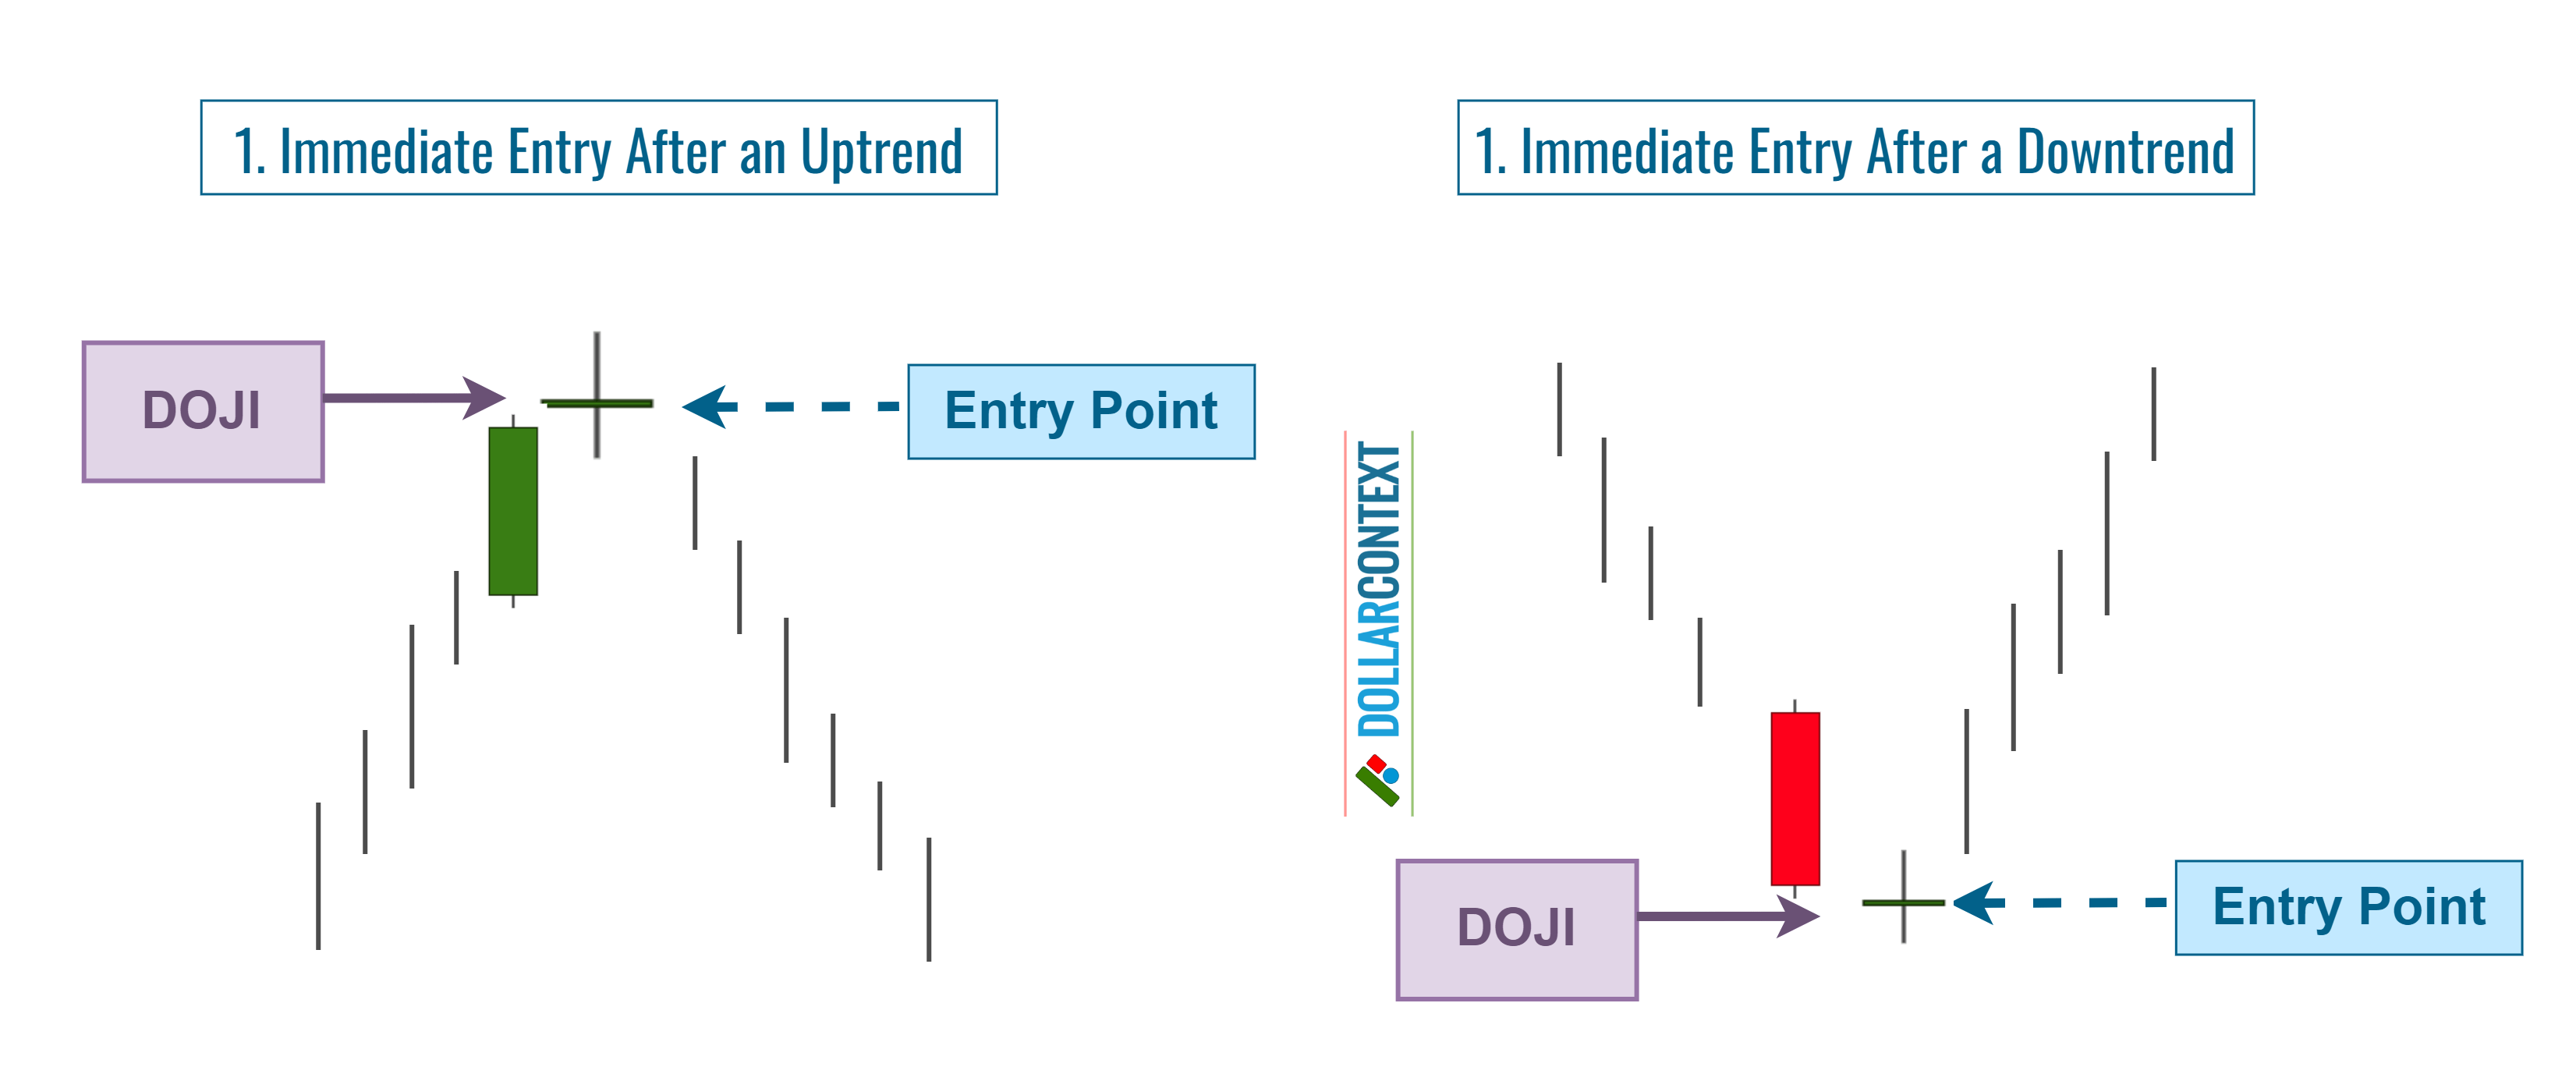
6.1 Immediate Entry
Once the doji session is formed, one can initiate an entry if the previous trend is mature enough and additional technical indicators point to a reversal. This tactic is more aggressive and hinges on expecting a swift reversal.
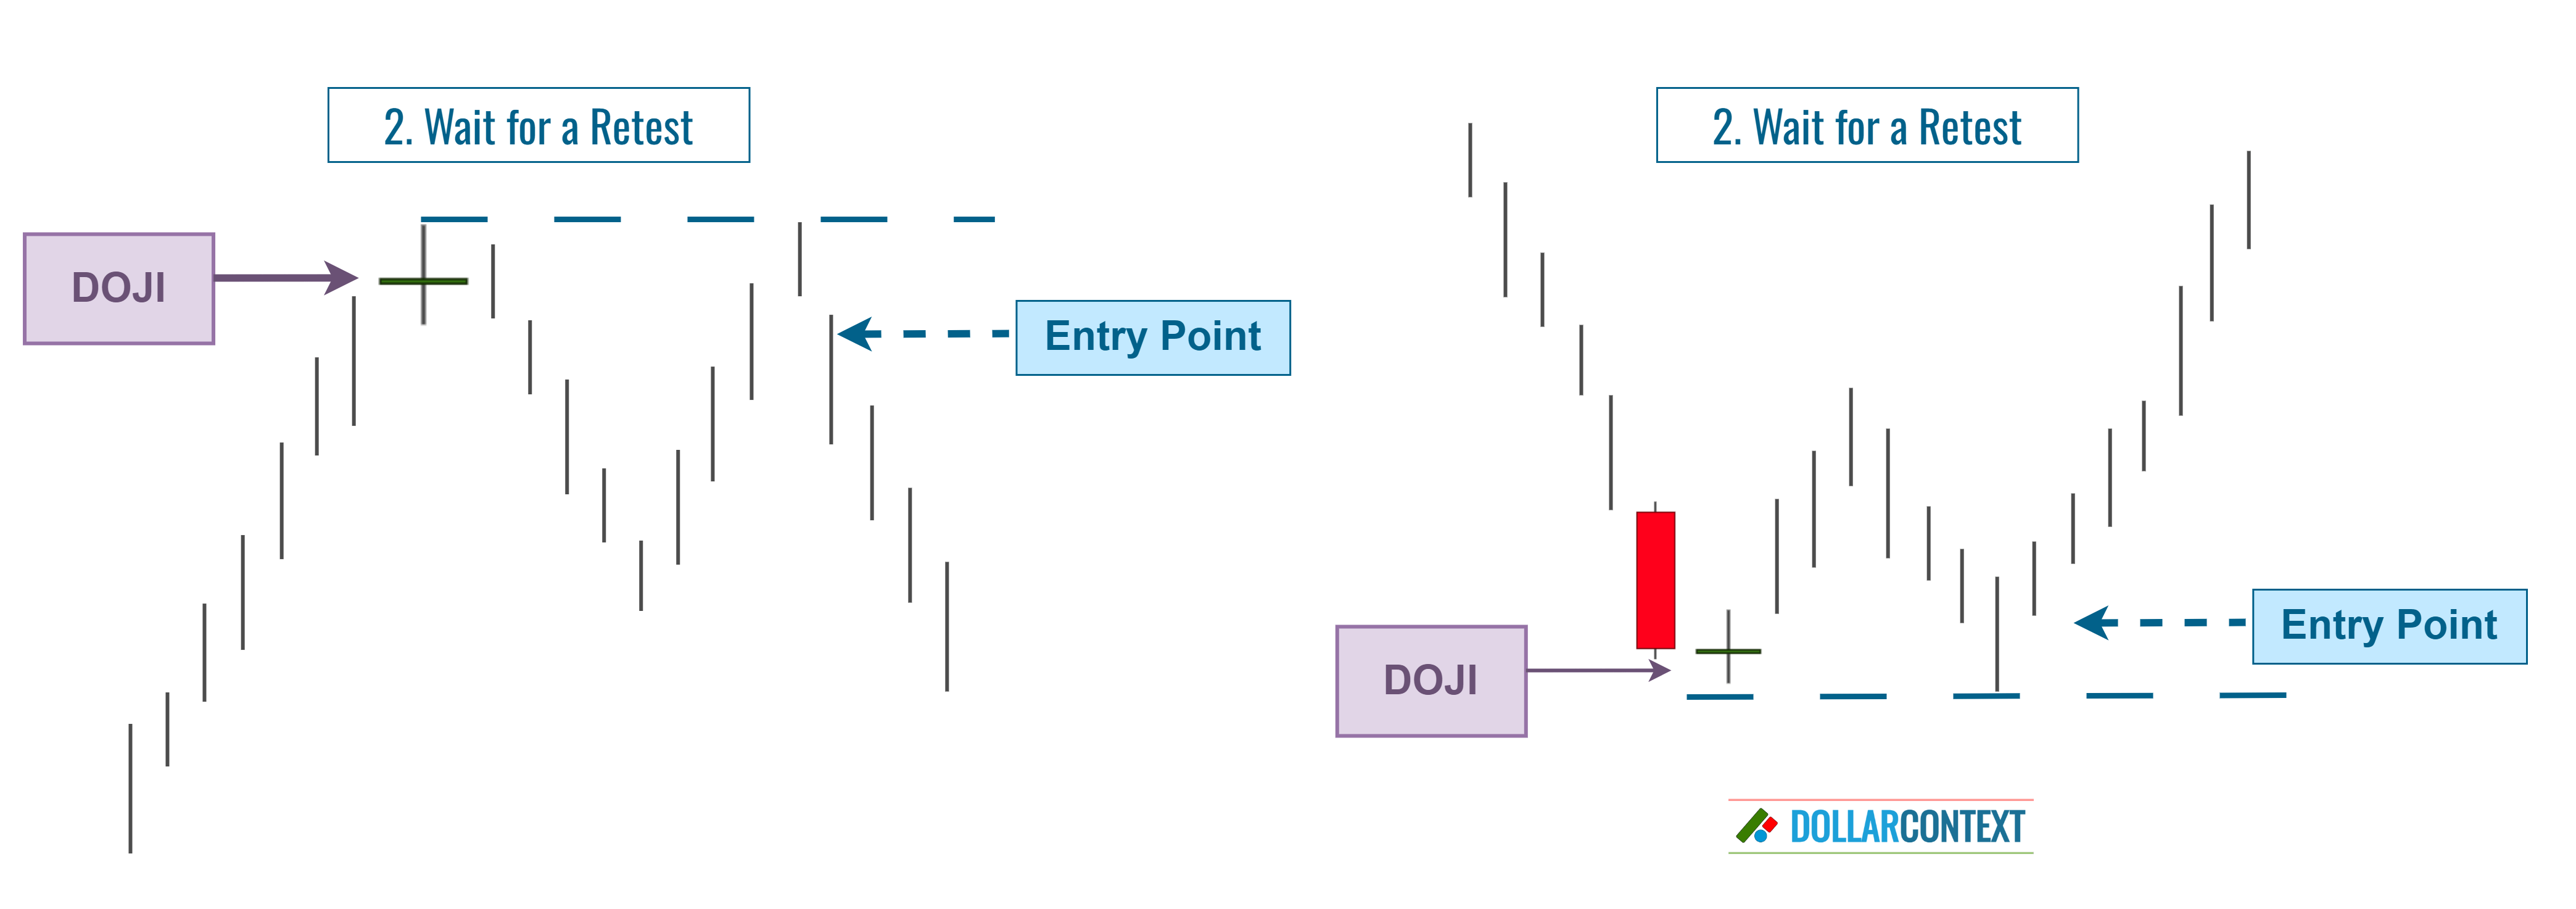
6.2 Wait for a Retest
It's important to recognize that after a strong or mature rally, the appearance of a doji session might still face residual buying pressure in the short term. As a result, the initial downward move may not be trustworthy, causing the market to retest the highs of the doji. This is why some traders prefer to wait for the market to revisit the high of the doji before initiating a short position.
As illustrated in the image below, the same concept holds true in the opposite scenario.
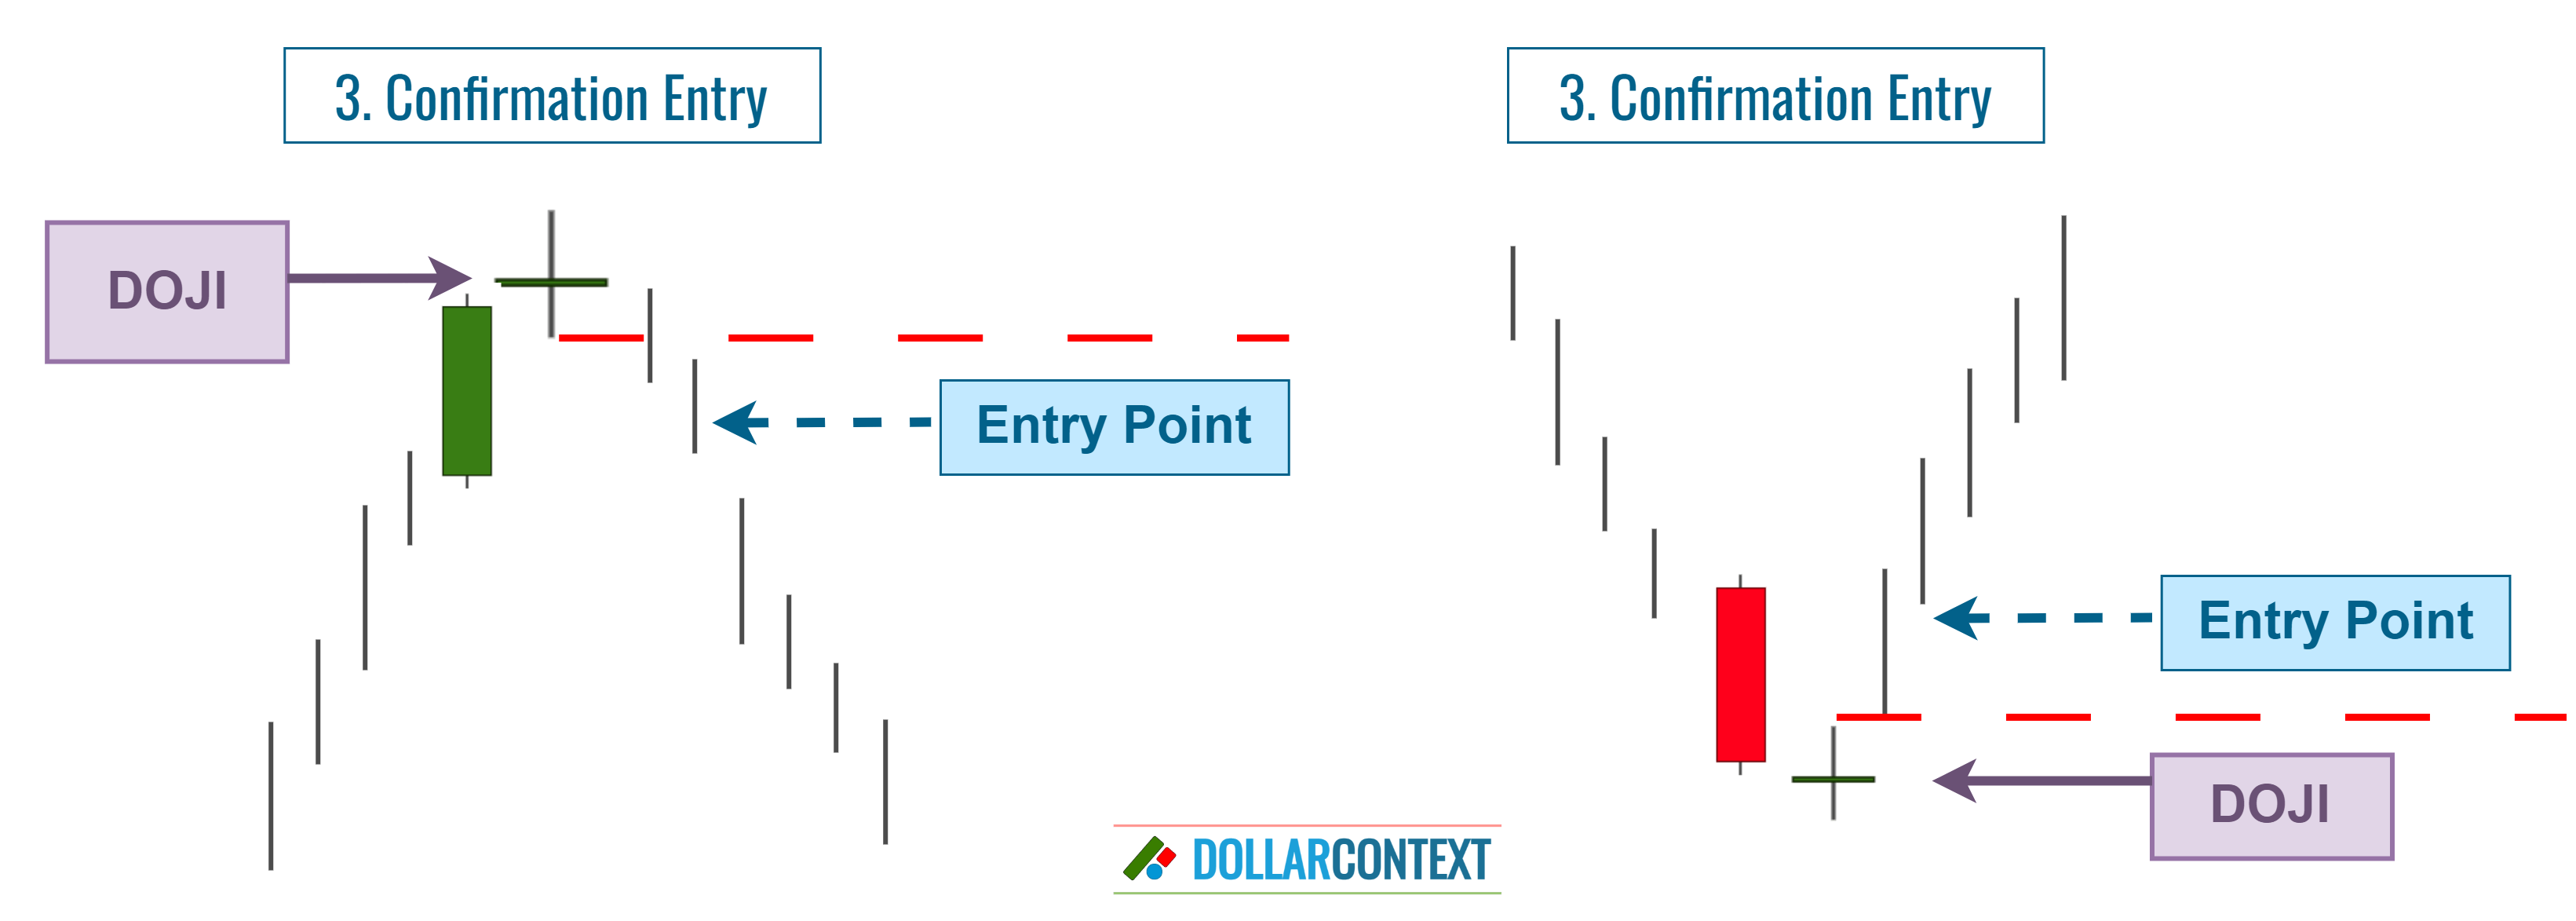
6.3 Confirmation
Initiate an entry when the price corroborates the direction of the emerging trend. This tactic aims to secure further evidence of strong reversal momentum.
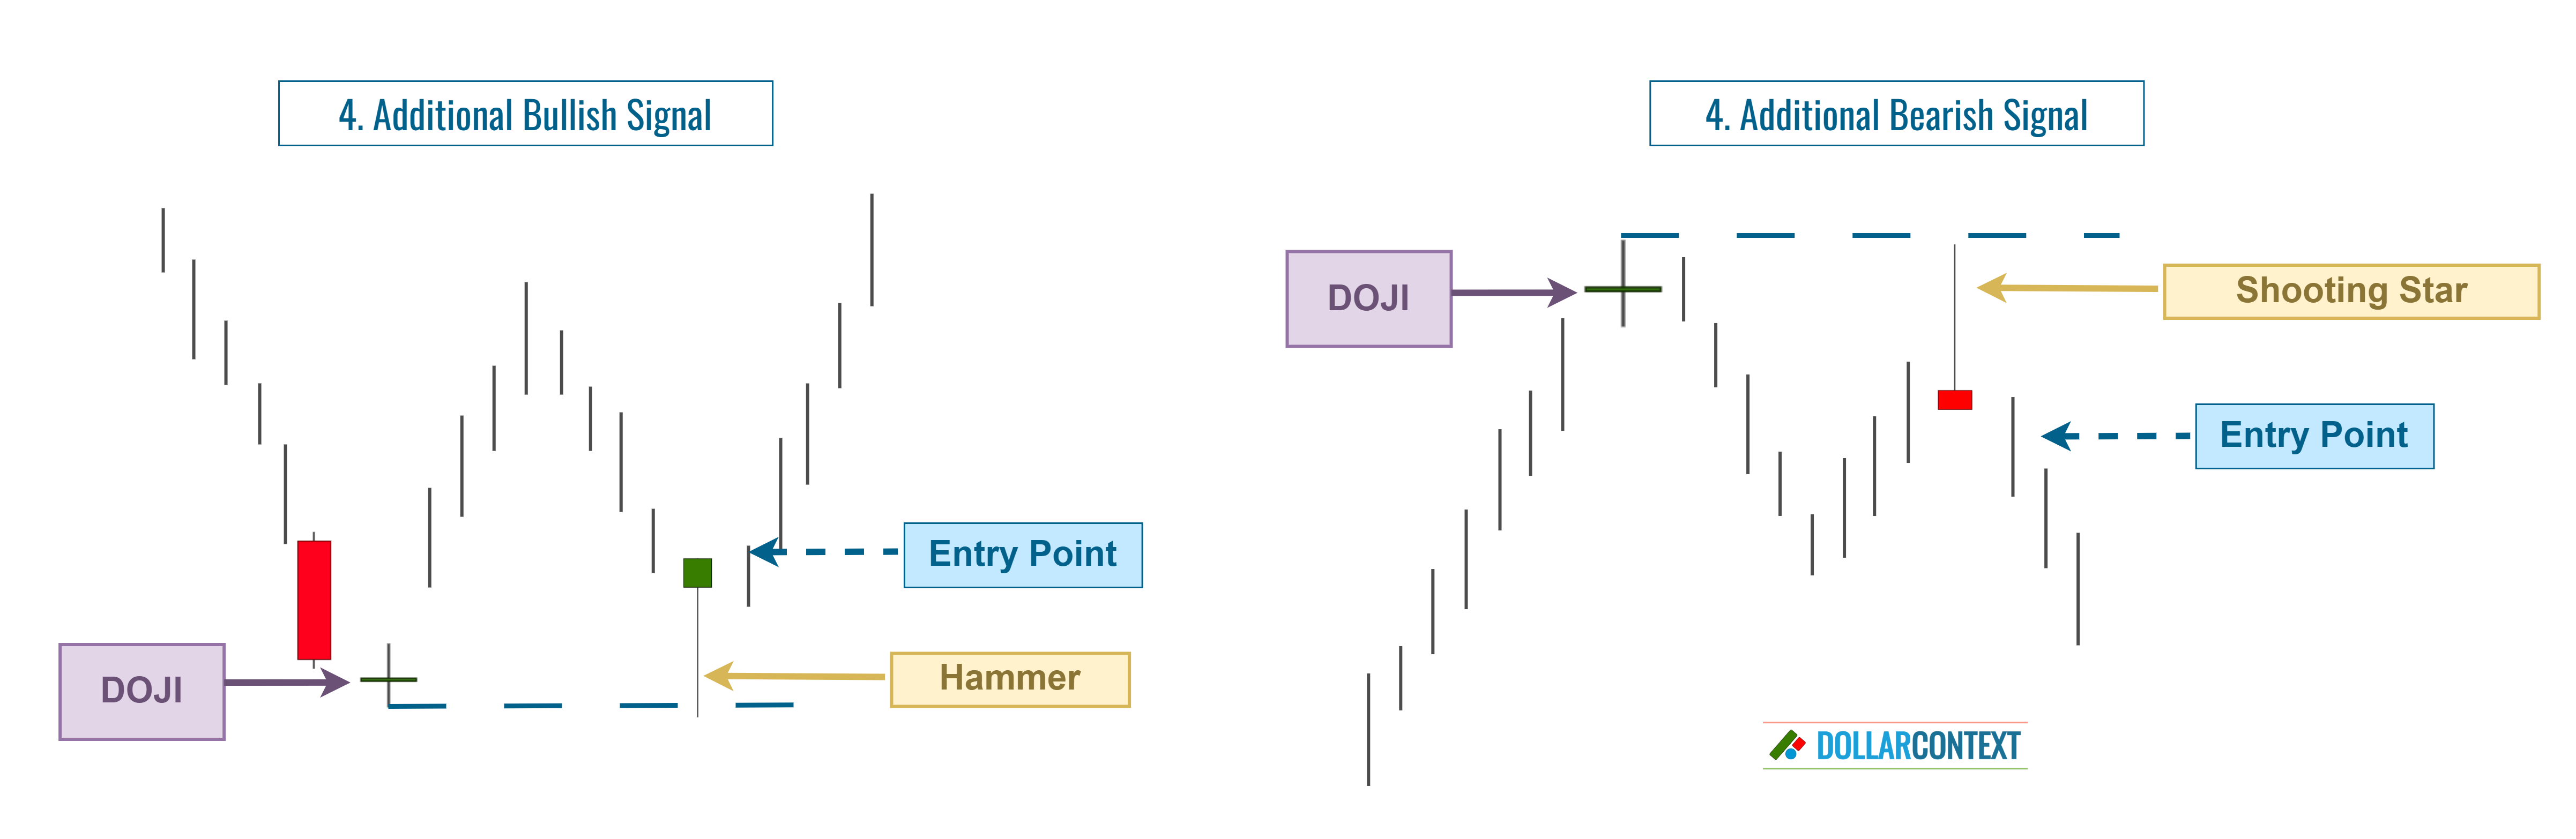
6.4 On an Additional Bullish Signal
After the doji session, consider delaying your entry until another reversal candlestick pattern or signal emerges, enhancing the probability of a trend shift. This could appear as a hammer, shooting star, or another indicative reversal pattern.
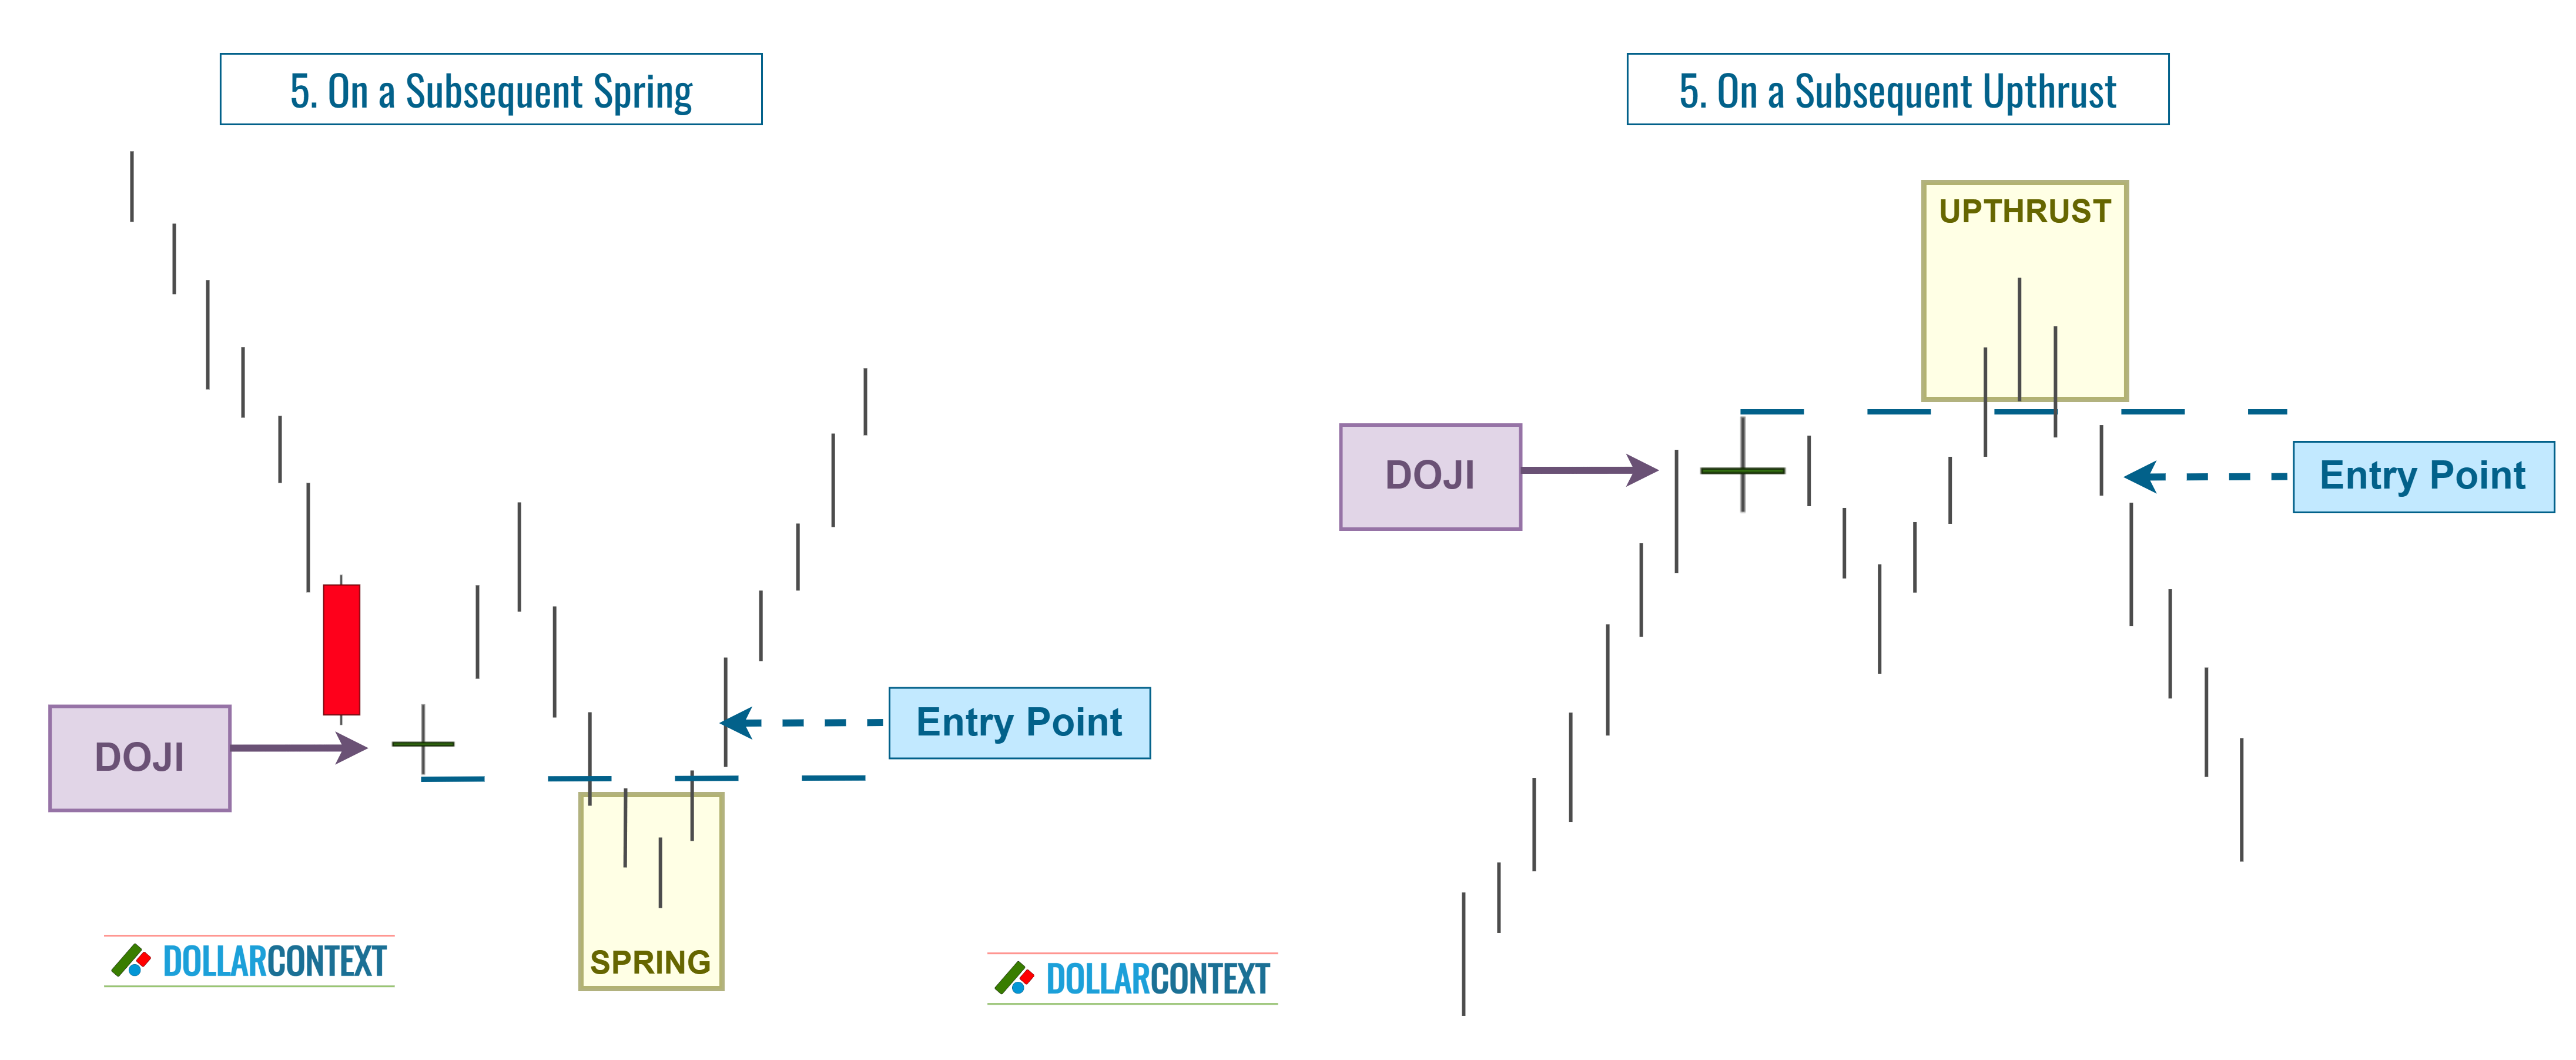
6.5 After a False Breakout (Spring or Upthrust)
A spring depicts a scenario where the market momentarily breaches a support level, only to swiftly reverse and head in the opposite direction. Essentially, it's a deceptive downward breakout.
Conversely, an upthrust occurs when the market momentarily showcases a false breakout to the upside. Both signals suggest that the breakout may falter, and a new trend in the opposing direction could take hold.
6.6 Mixed Strategy
A mixed approach involves initiating a preliminary entry upon identifying a doji session, and then increasing the position as the market provides additional confirmation signals.
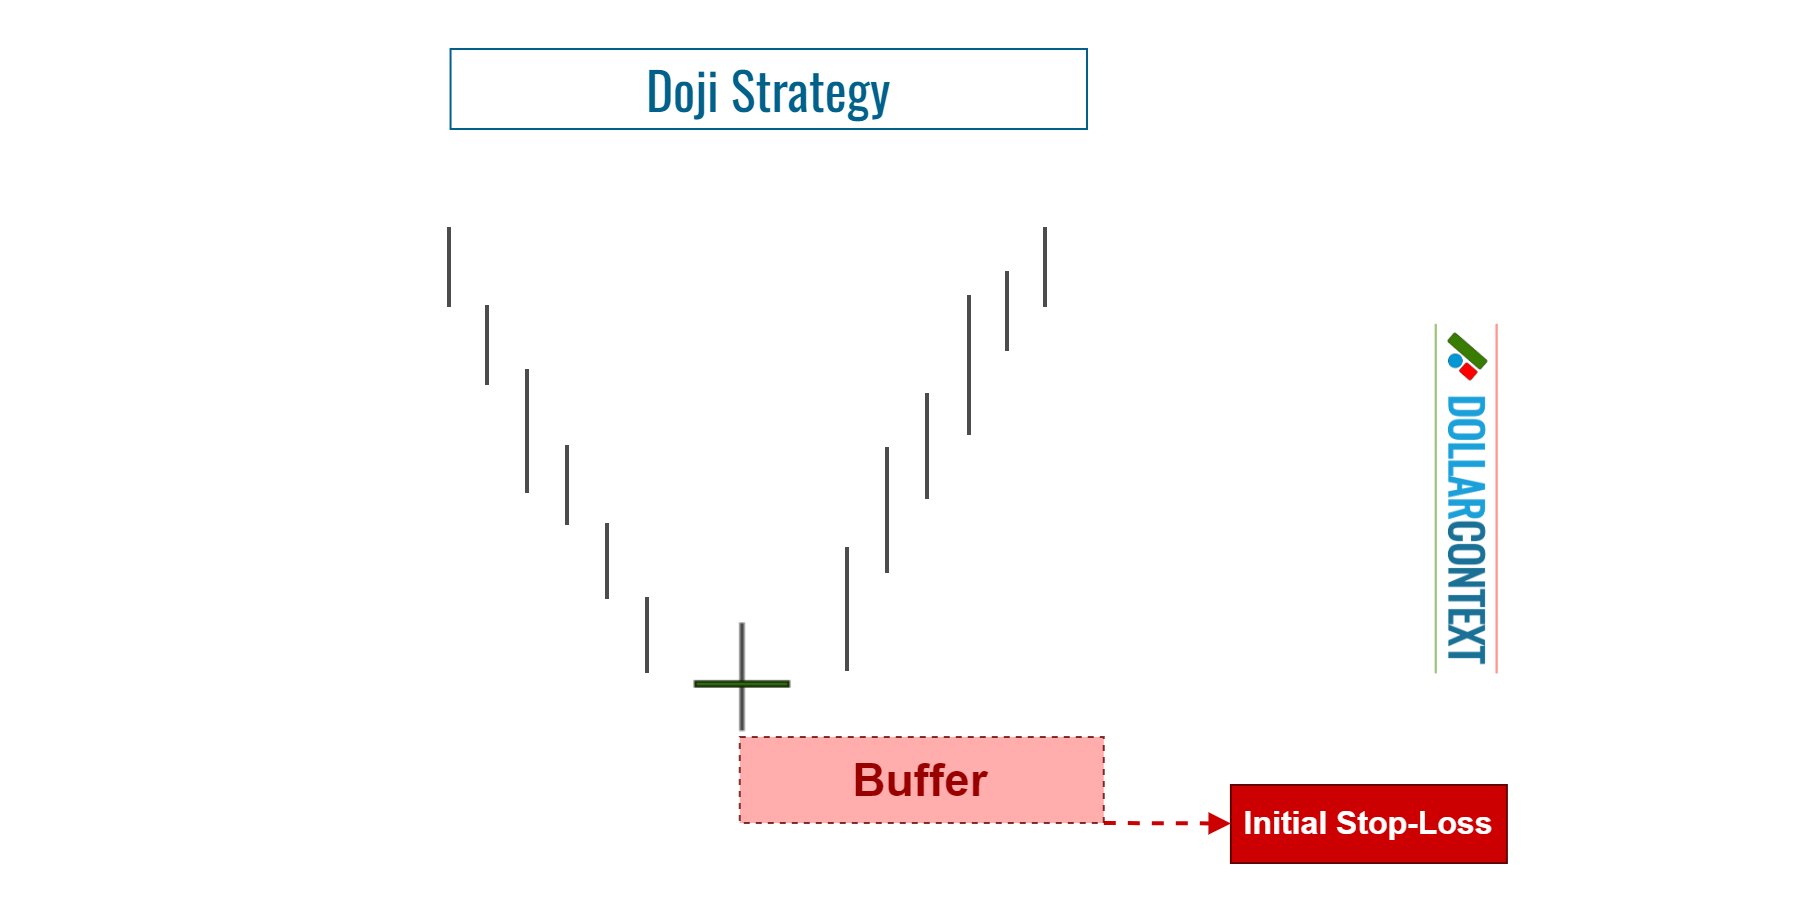
7. Stop Loss
Following an uptrend, the price range of a doji often becomes a resistance area. Conversely, after a downtrend, the price range related to a doji frequently establishes itself as a support zone. You can use those levels as your initial stop-loss for your doji strategy.
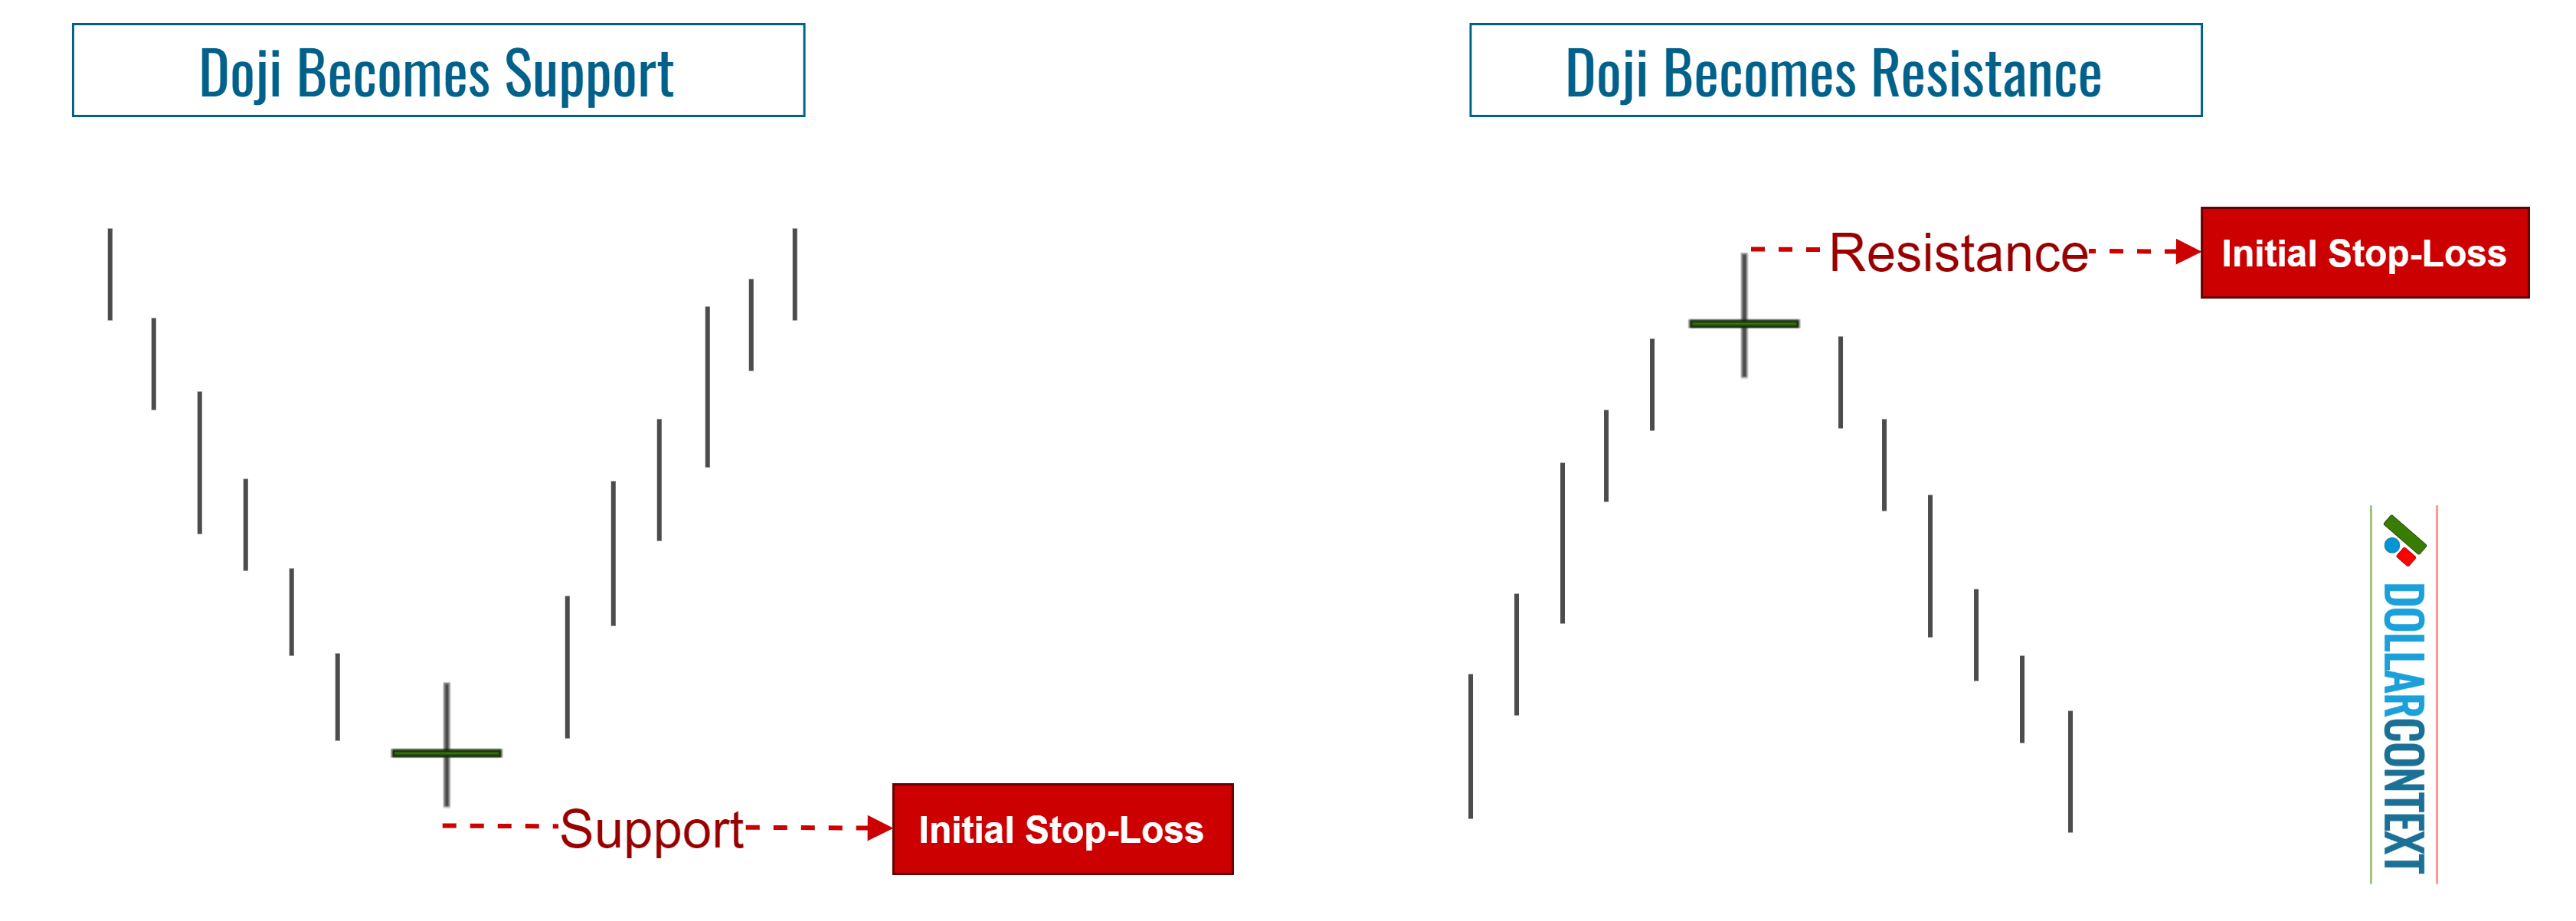
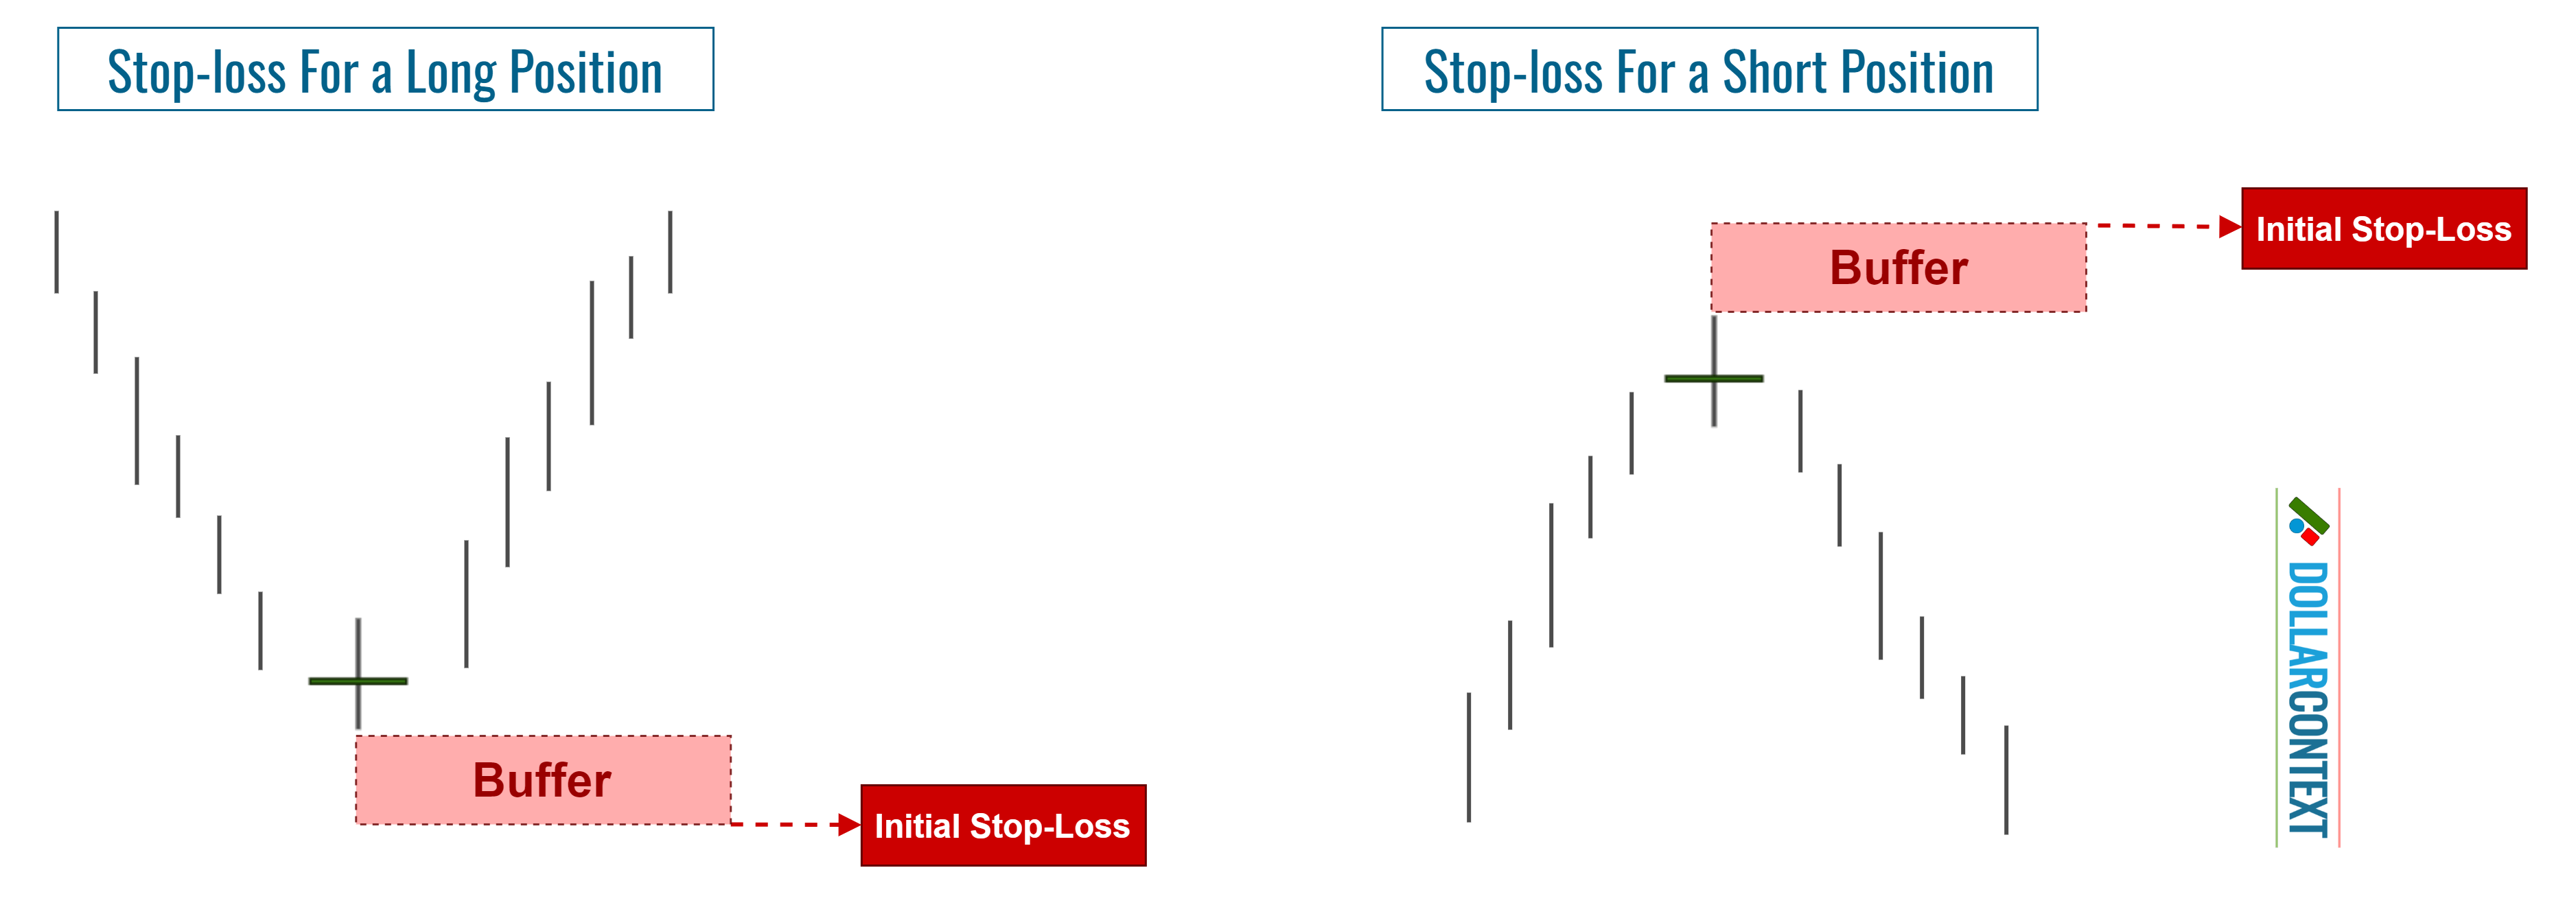
However, to safeguard against hasty exits during turbulent sessions or due to false breakouts, consider these two supplementary considerations:
- Introduce a buffer to mitigate the effects of false breakouts.
- Set a stop based on closing prices rather than solely on intra-session price fluctuations.
As your trade progresses, you may observe additional candlestick patterns that reinforce the initial support established by the doji. In such instances, consider adjusting your stop-loss accordingly to encompass the lowest or highest point across these patterns.
8. Profit Target
Although candlestick patterns frequently indicate trend shifts and potential entry opportunities, they don't inherently provide profit-taking levels. To identify these points, you can explore other methods such as moving averages, classic chart formations, Fibonacci tools, etc.
Having said that, if you're in a favorable position triggered by a doji and a subsequent candlestick pattern emerges signaling a new shift in the market sentiment, consider this new pattern as a cue to exit the doji trade.
9. Examples
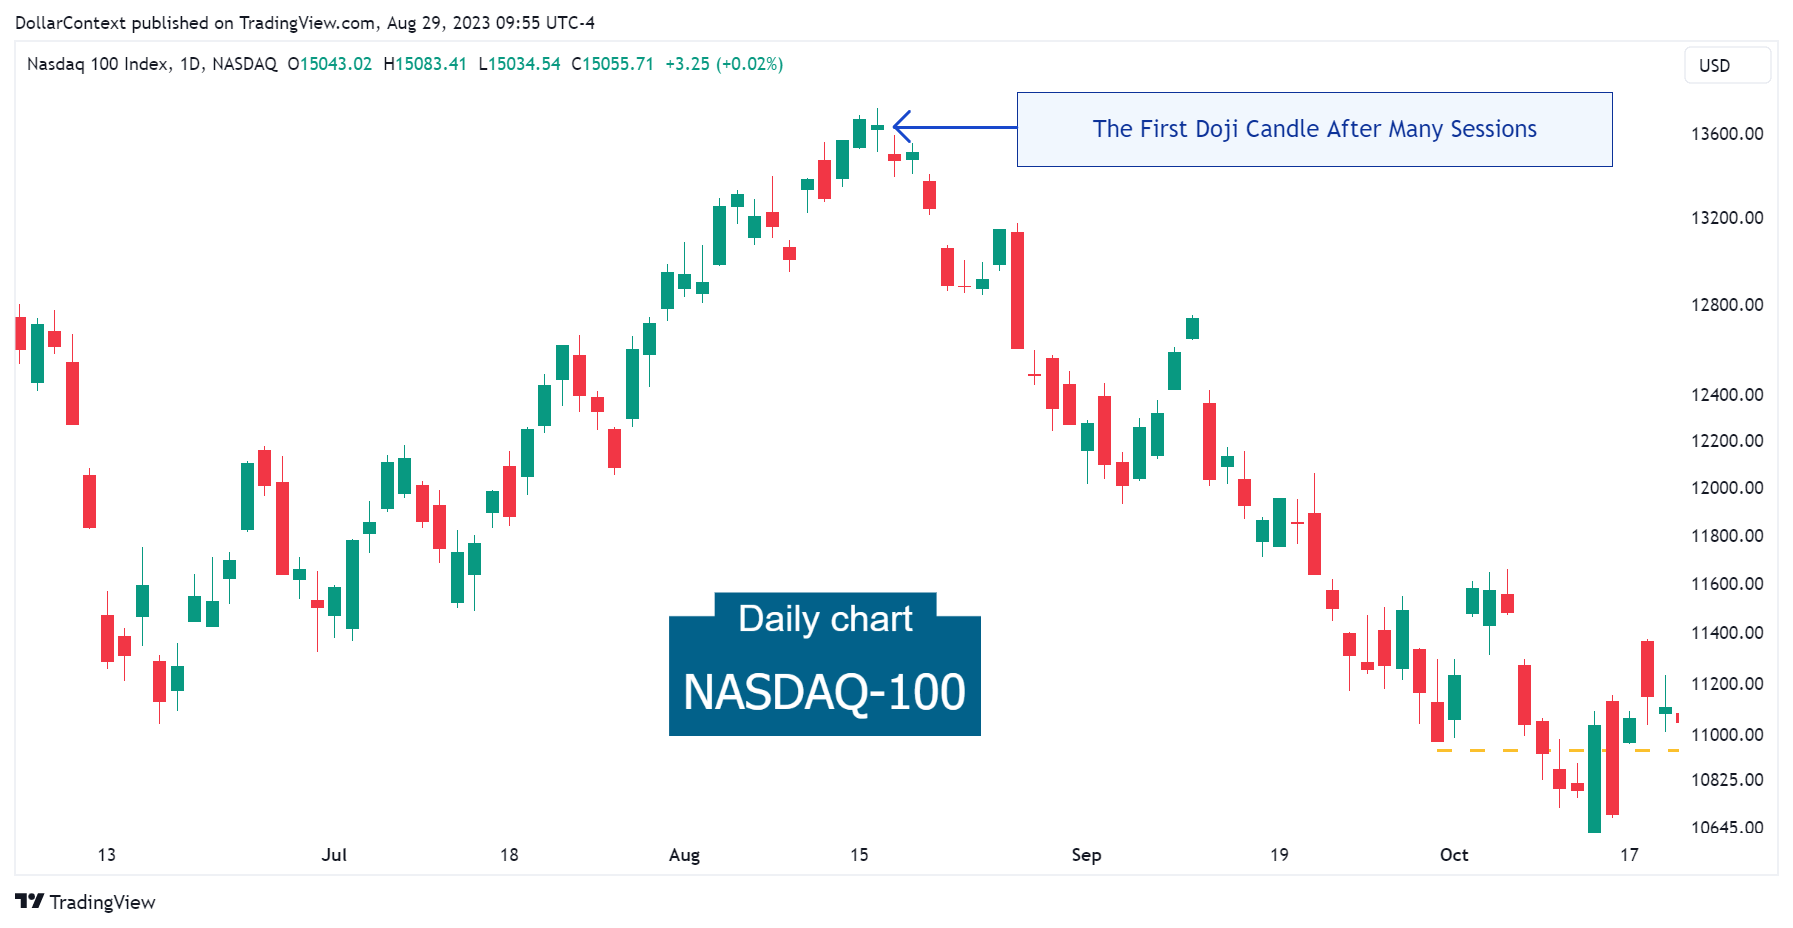
9.1 Nasdaq-100 (Daily Chart)
The chart below showcases the potential sentiment change a doji candle can signal after a long upward or downward movement. Following a lengthy ascent, the Nasdaq-100 index displayed a doji. Take note of the pronounced market decline that followed this cue.
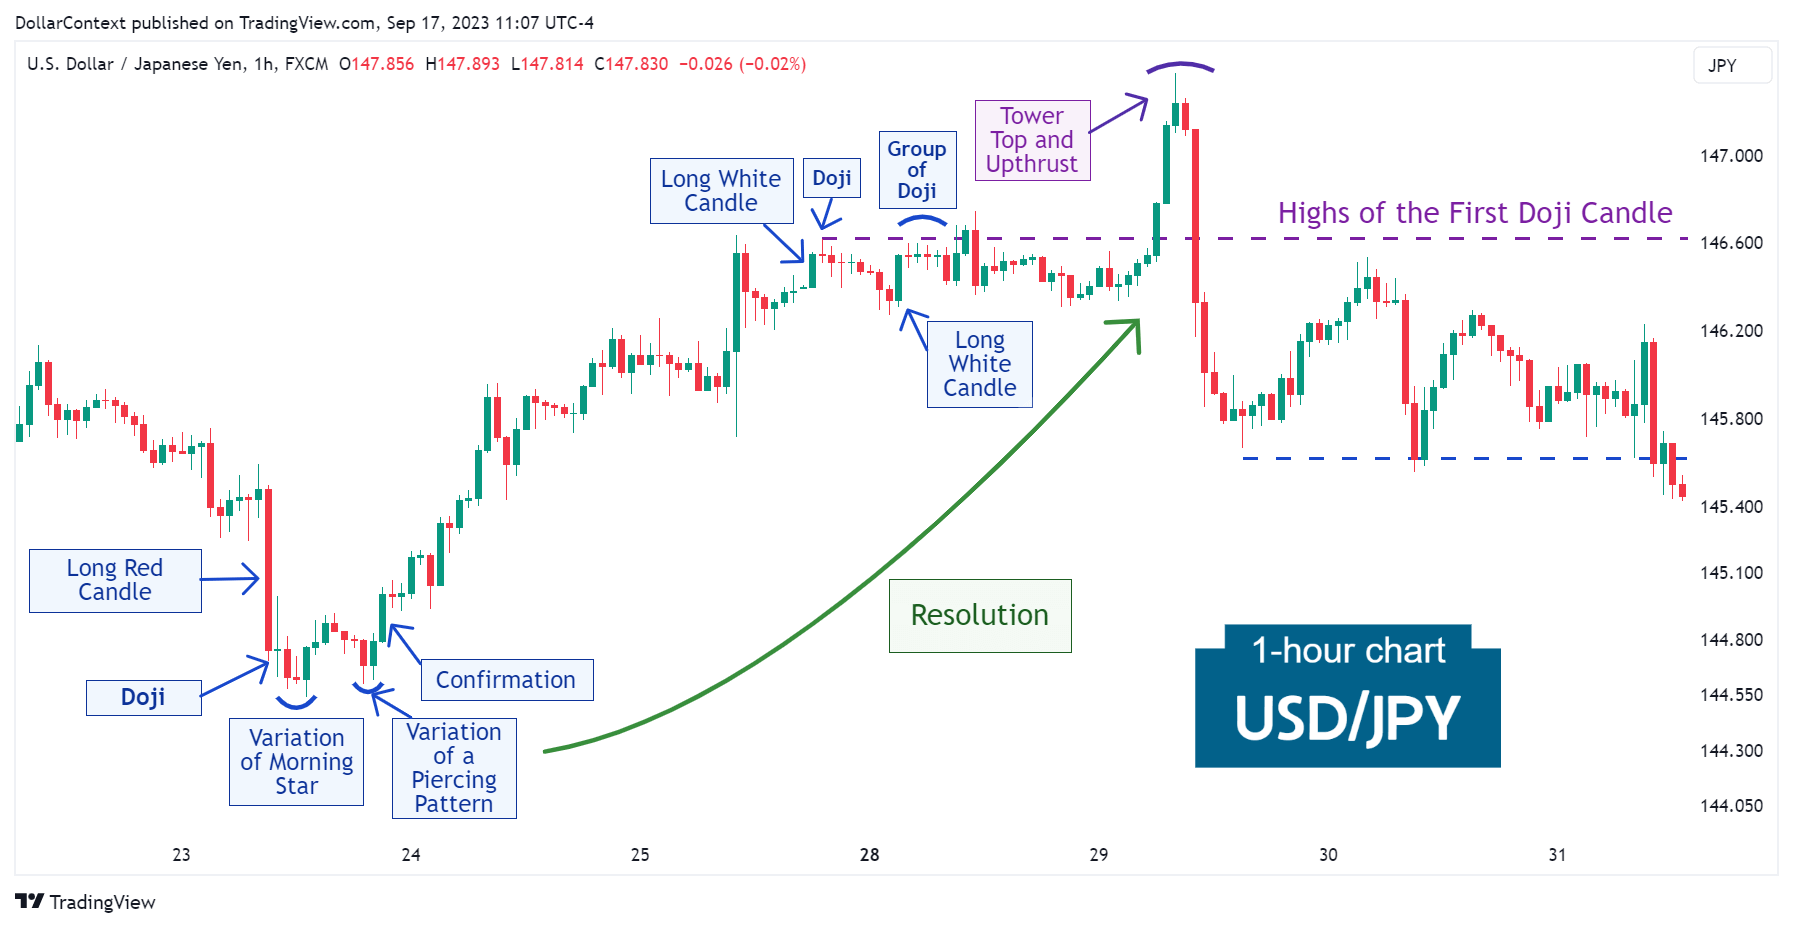
9.2 USD/JPY (Hourly Chart)
After a prolonged downtrend in August 2023, the USD/JPY presented a prominent red candle followed by a doji session. Subsequent to the doji, a sequence of other candlestick formations lent more credibility to the anticipated reversal.
Notice how a series of candlestick indicators in late August could be considered to anticipate the rally's conclusion.
9.3 More Examples (Case Studies)
- Case Study 0001: Doji After a Pronounced Red Candlestick (USD/JPY)
- Case Study 0006: Doji After a Long White Candlestick (WTI)
- Case Study 0011: Three Doji Candles and Tower Top (EUR/USD)
- Case Study 0017: High-Wave and Doji After a Tall Green Candle (AUD/USD)


