The Psychology Behind a Doji Candle
Today we examine the implications of a doji candle in market psychology.

This article is part of the Doji candlestick tutorial series. For the complete guide, see the Doji Candlestick Pattern — Complete Guide.
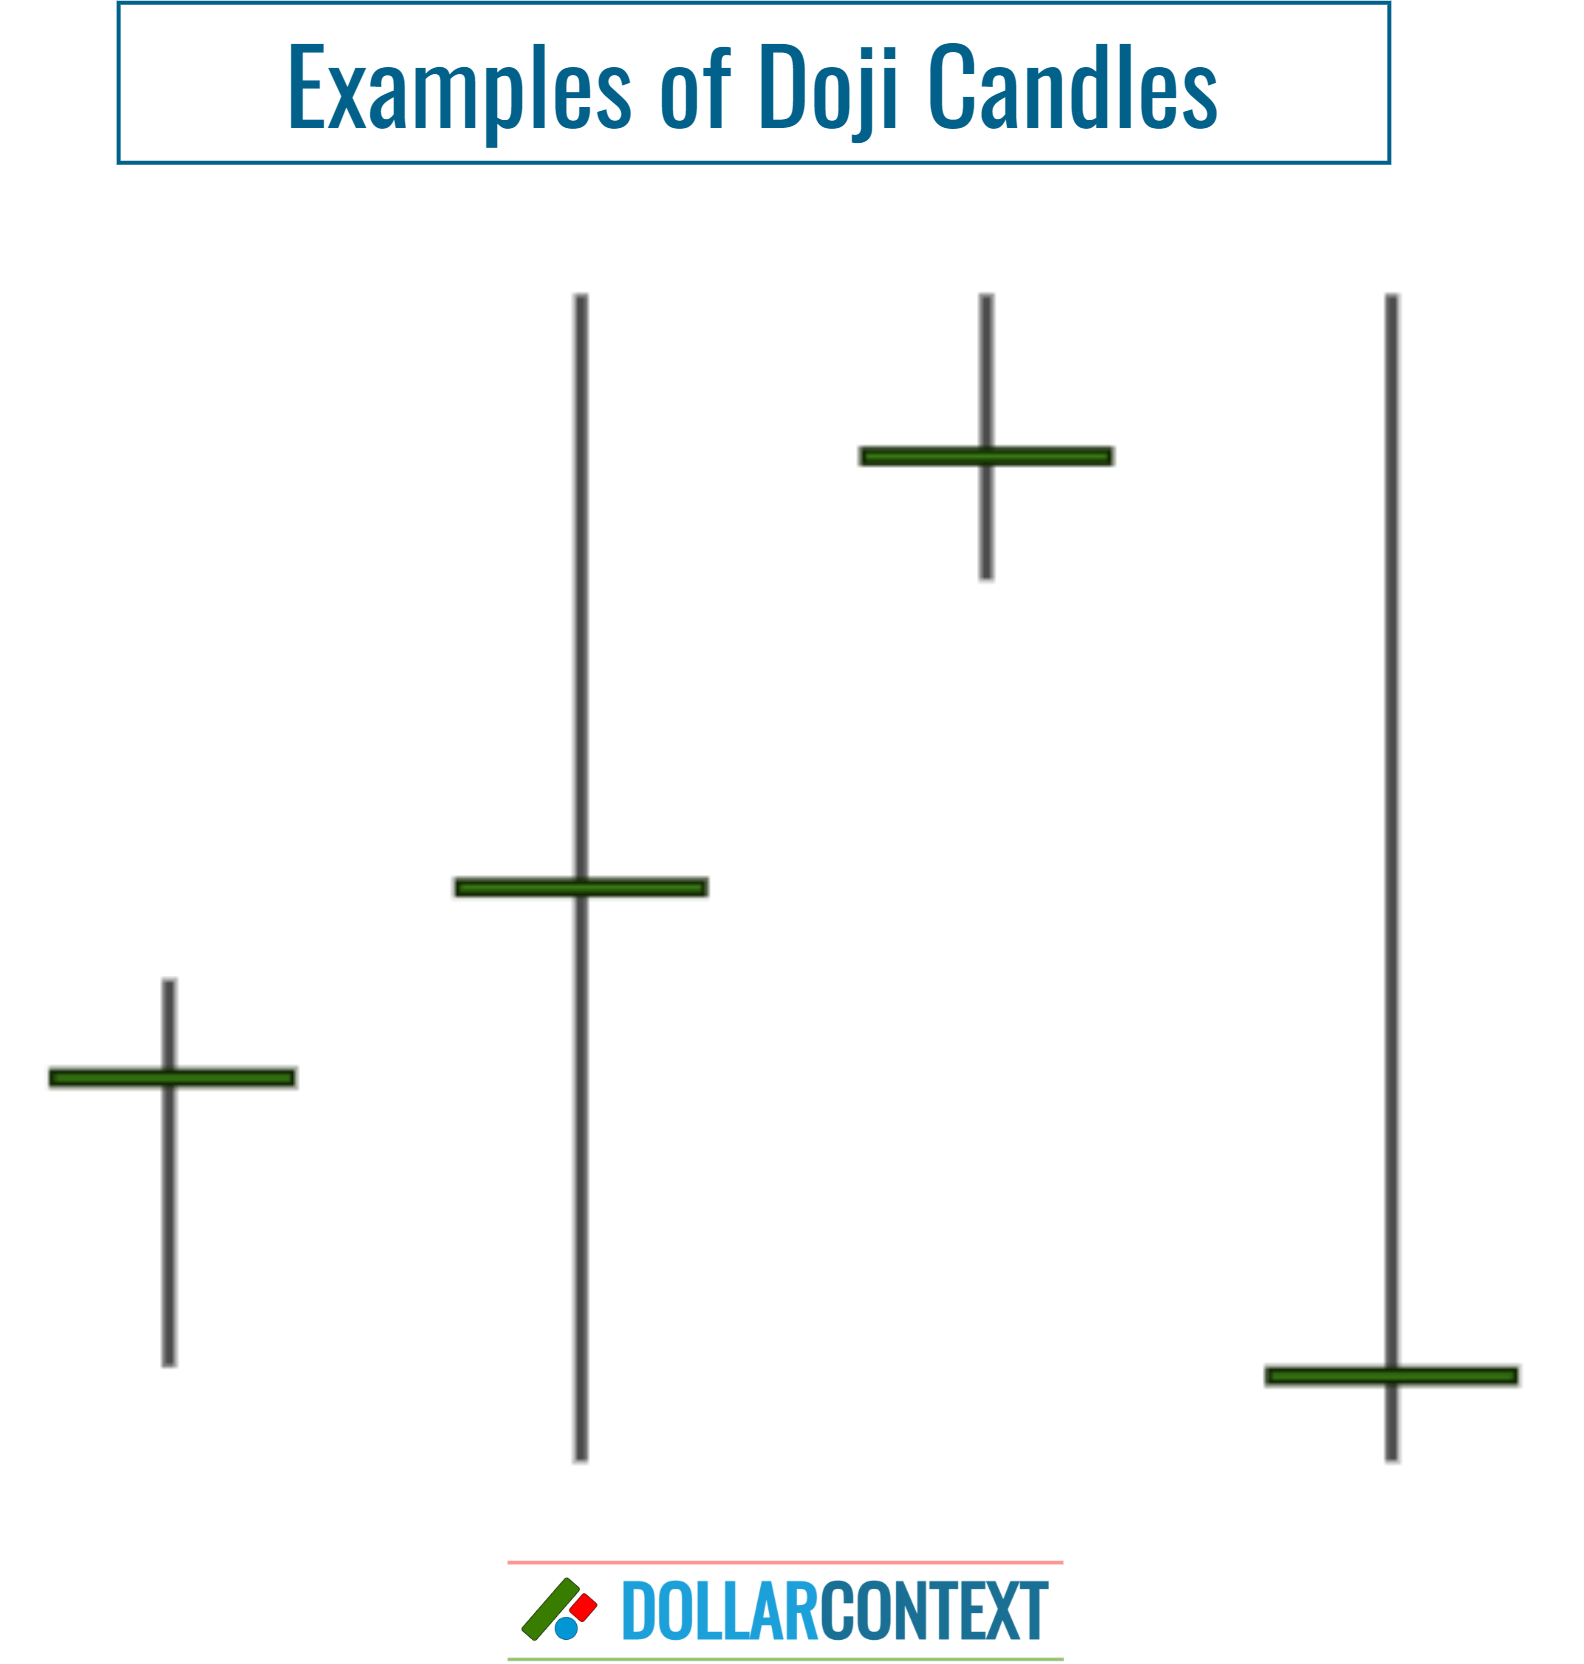
A doji candlestick forms when a security's open and close prices for the period are virtually the same. The result is a candlestick with a flat, horizontal body and a thin line (representing the day's trading range).
Psychological Aspects of a Doji Candle
Depending on where it occurs in a price trend, a doji can have various interpretations. These can be described as follows:
- Indecision and Equilibrium: The primary psychological message conveyed by a doji is one of indecision between buyers and sellers. The security opened and closed at roughly the same price, which means neither the bulls nor the bears could gain the upper hand. This suggests a balance or equilibrium in the market.
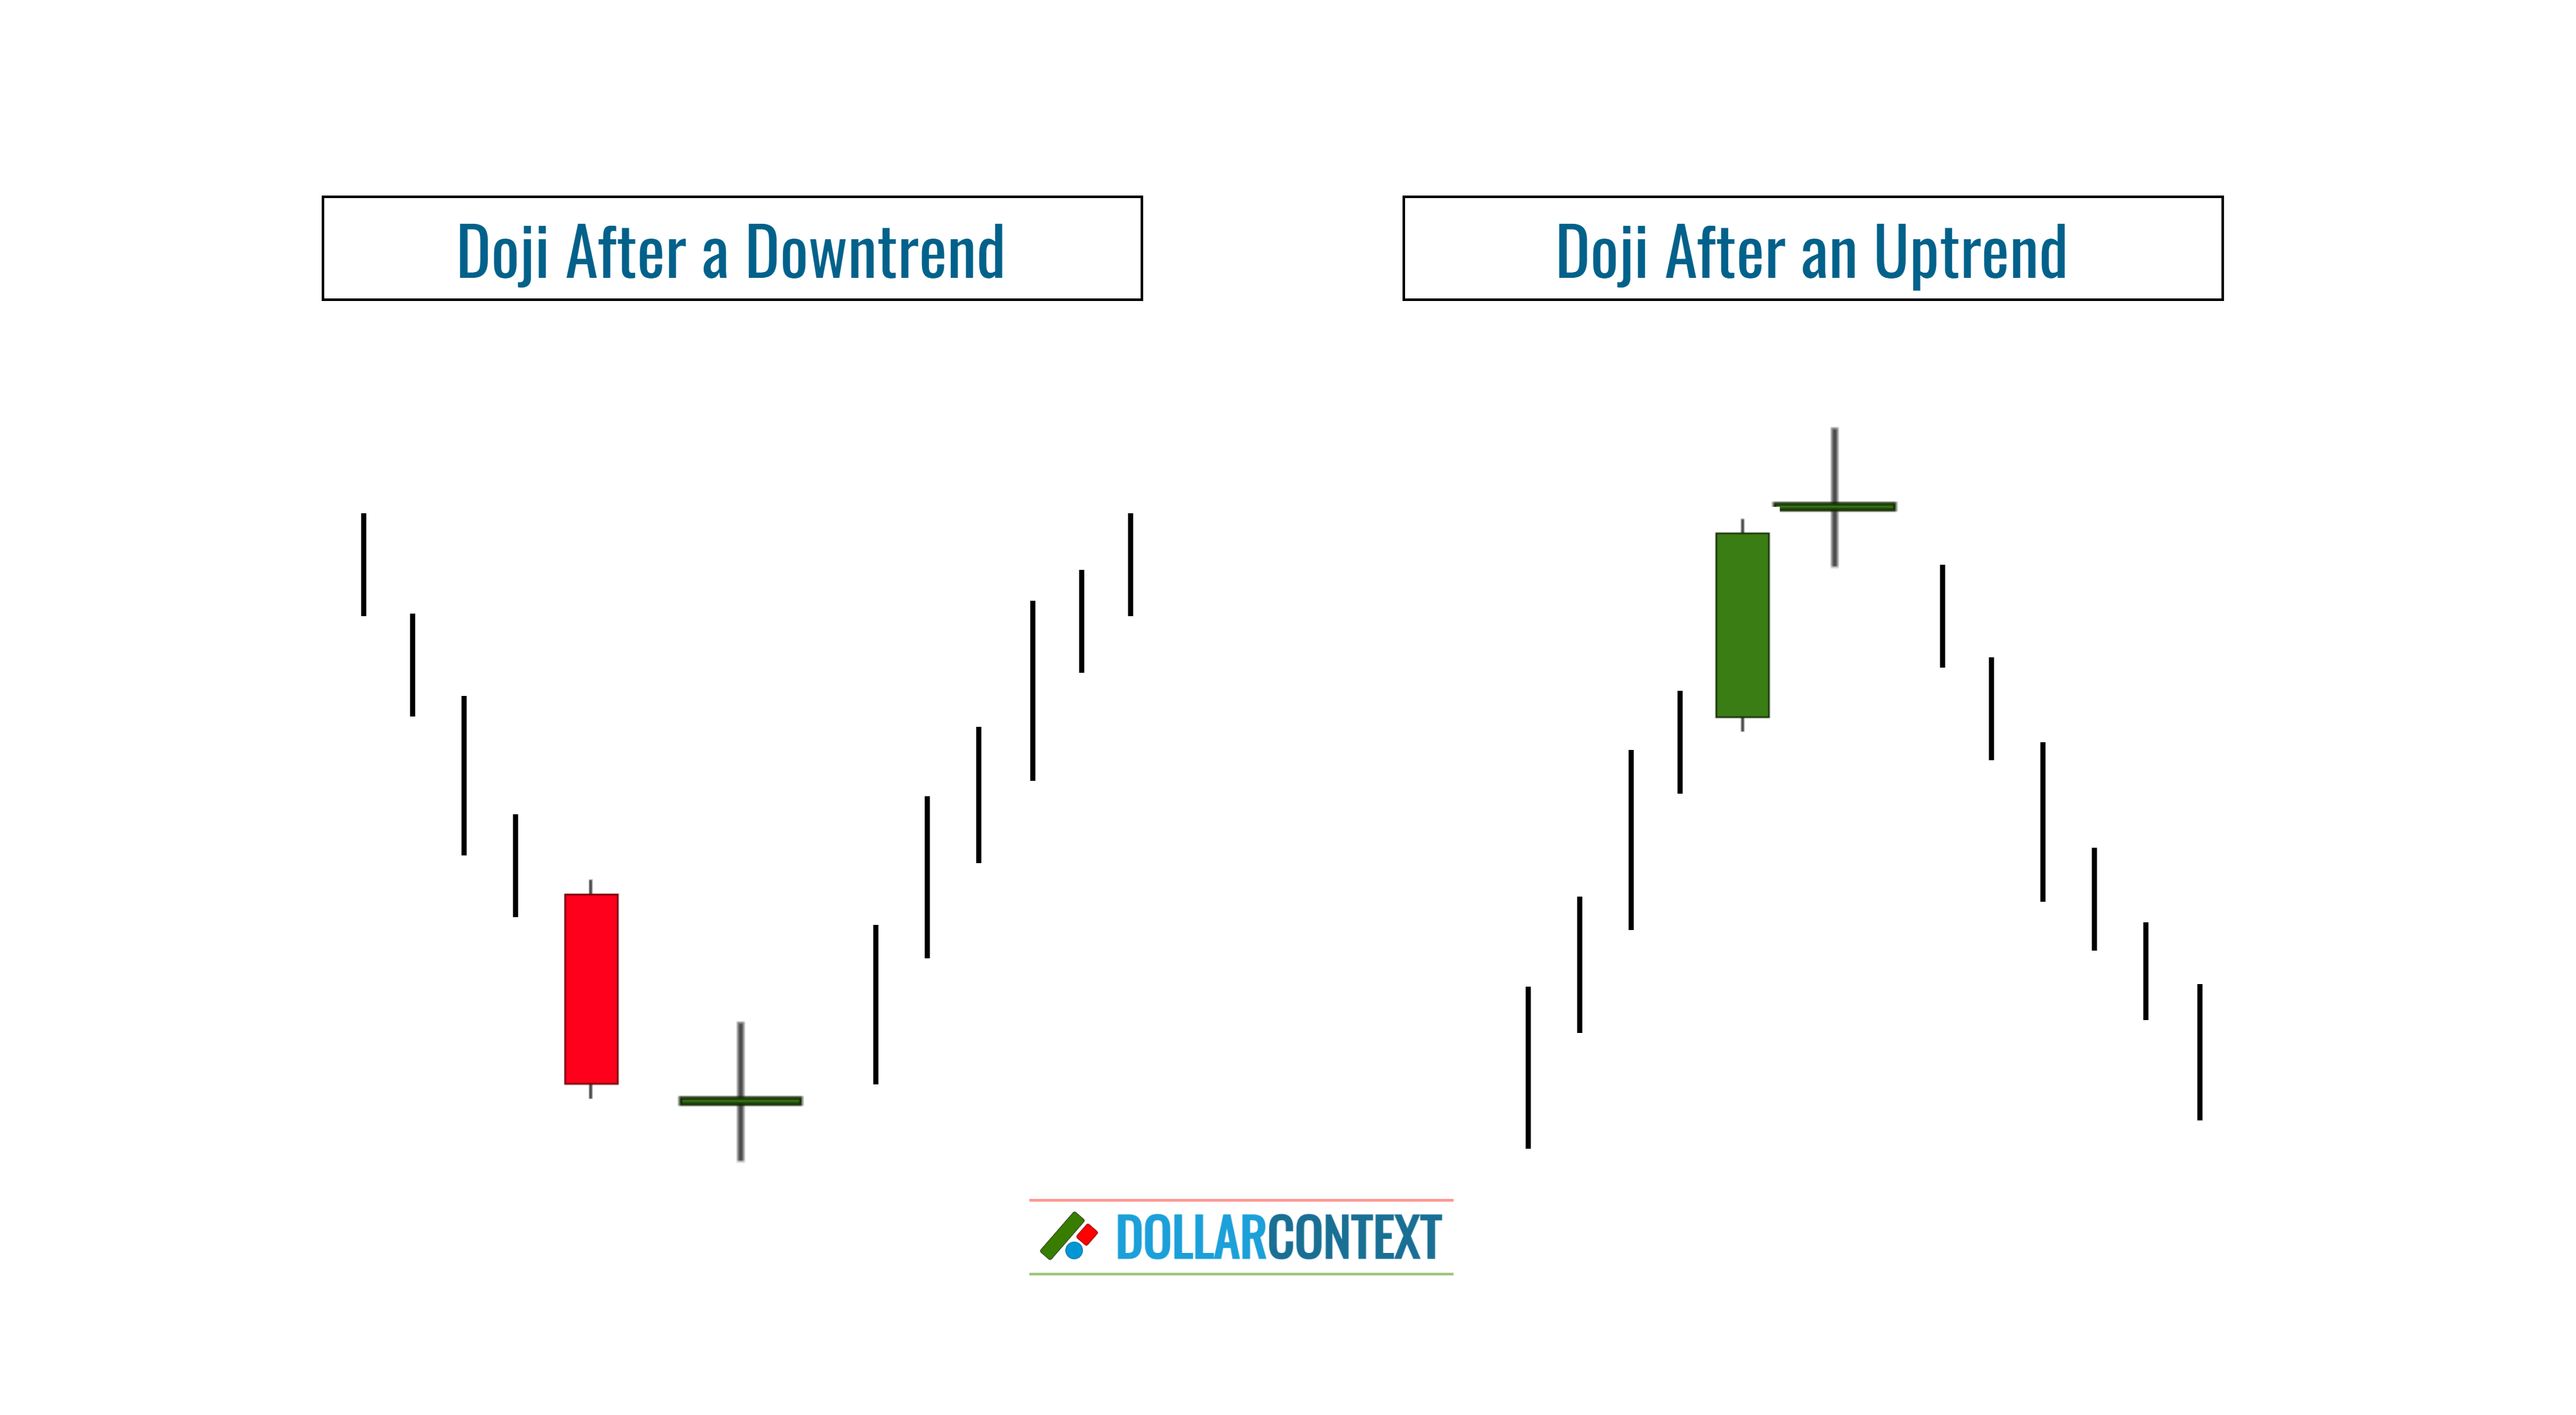
- Potential Reversal Signal: If a doji appears after a prolonged uptrend or downtrend, it can be interpreted as a potential sign that momentum is waning, and a price reversal may be on the horizon. The established trend may be running out of steam, and the indecision reflected by the doji might be the first indication of a changing market sentiment.
- Context Matters: To hold significance, a doji should emerge after a strong or prolonged trend. On the other hand, the psychological implications of a doji can vary based on its location in the broader chart pattern. For example, a doji that occurs near a significant resistance level after an uptrend might be seen as a stronger sign of a potential reversal than one that appears in the middle of a trading range.
Different Types of Doji
There are several types of doji candles, each with its own subtle psychological nuances.
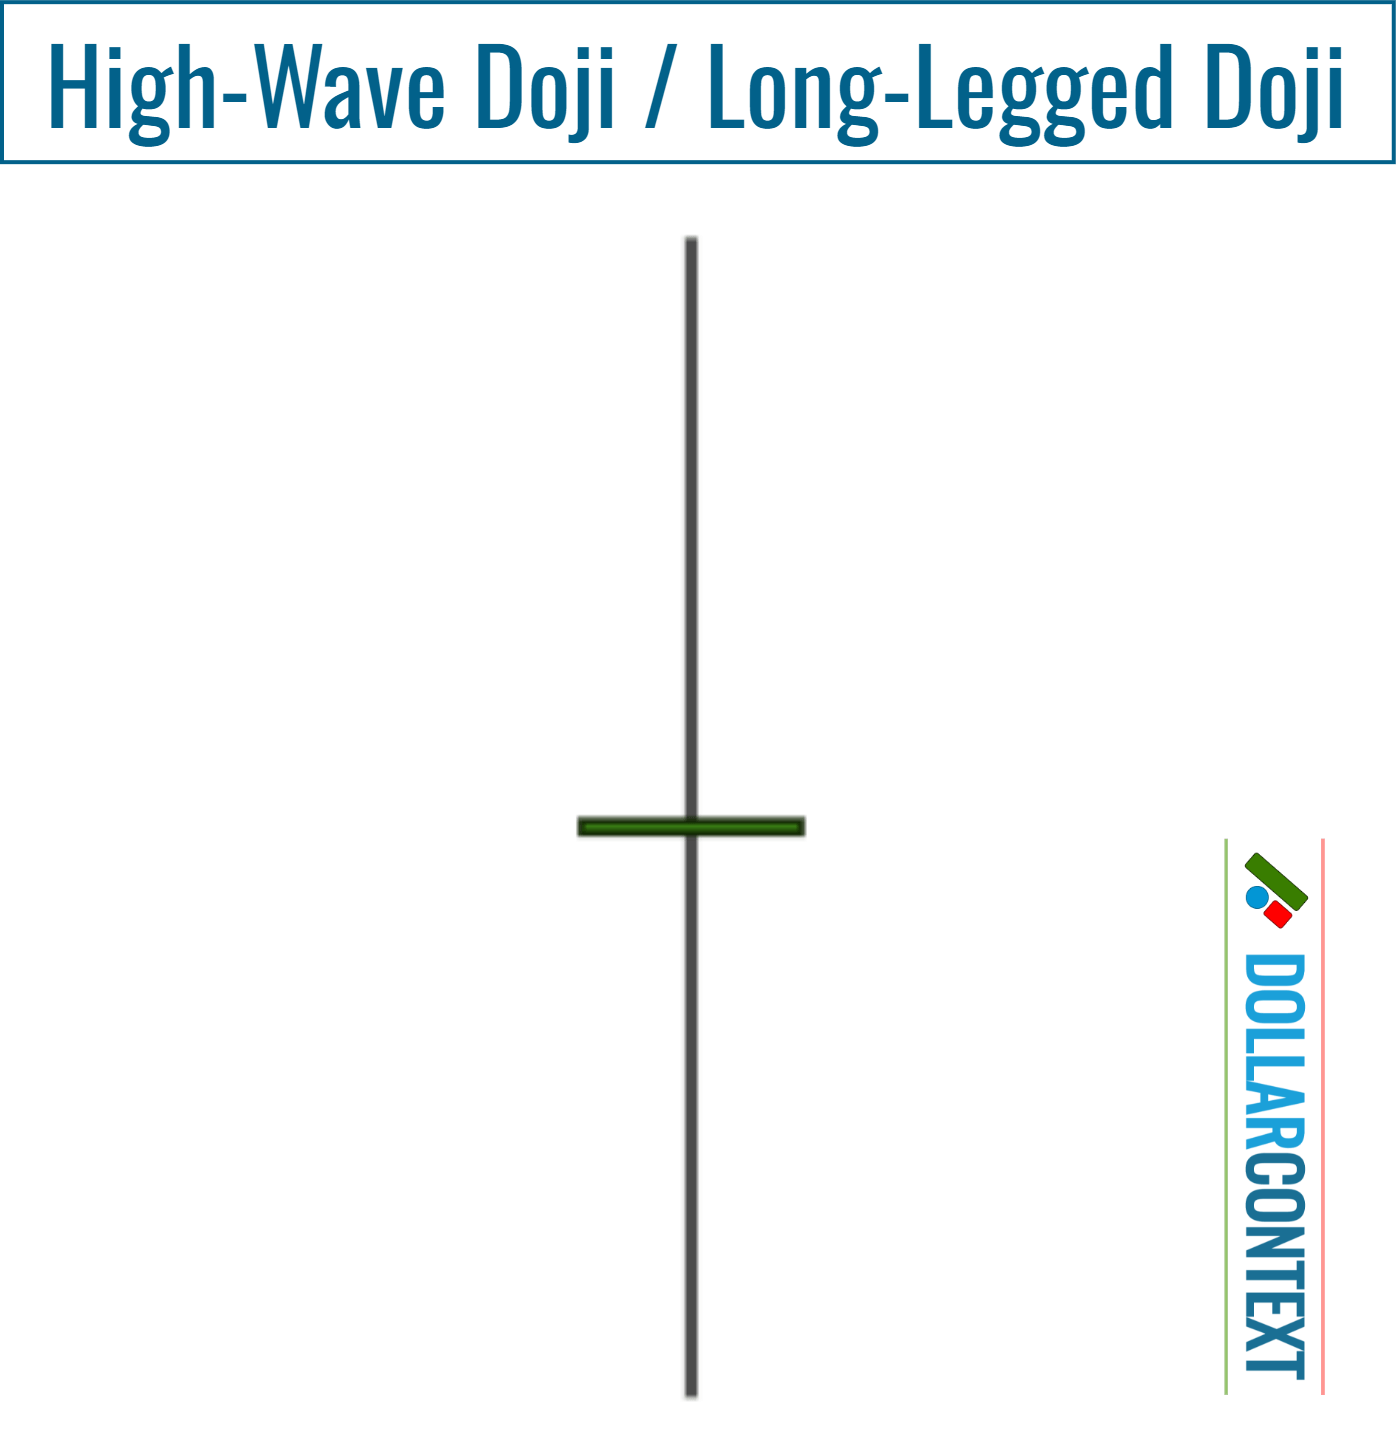
For example, a long-legged doji, also known as high-wave doji, suggests a great deal of indecision as prices moved significantly in both directions during the period but then closed near the opening level.
A dragonfly doji has a long lower shadow and no upper shadow, suggesting that sellers pushed prices lower, but buyers were able to push prices back to the opening level.
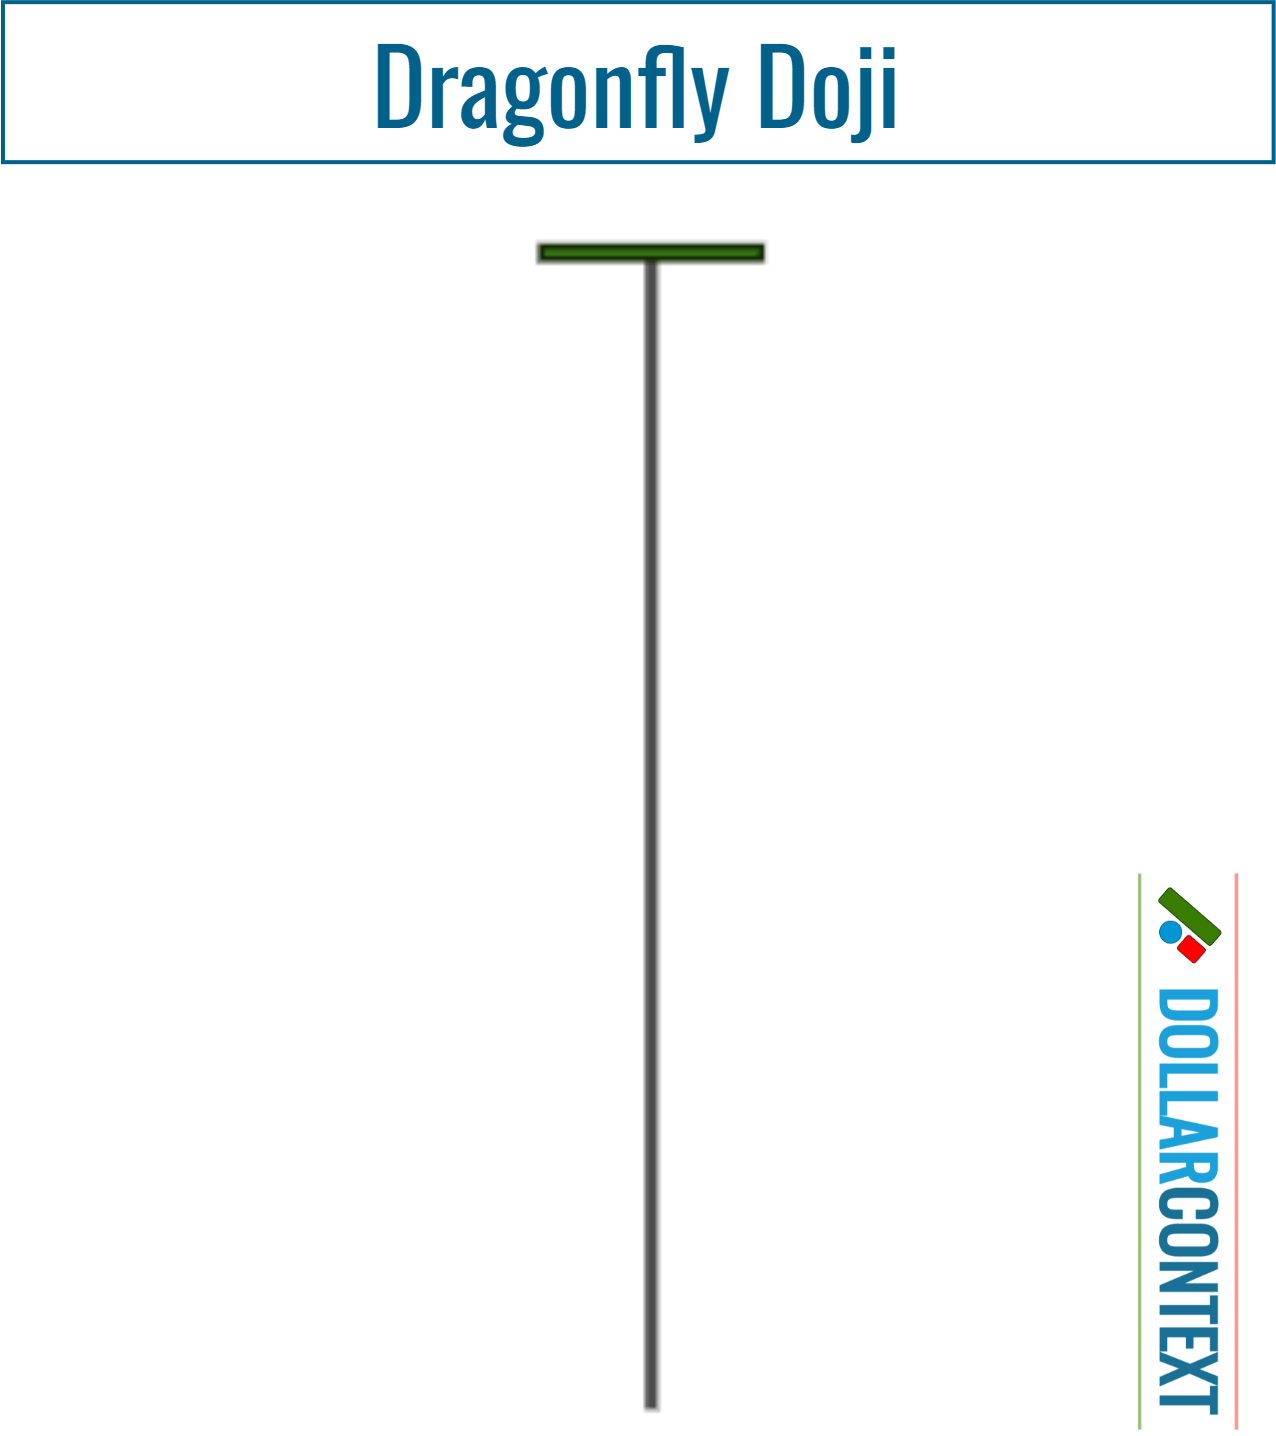
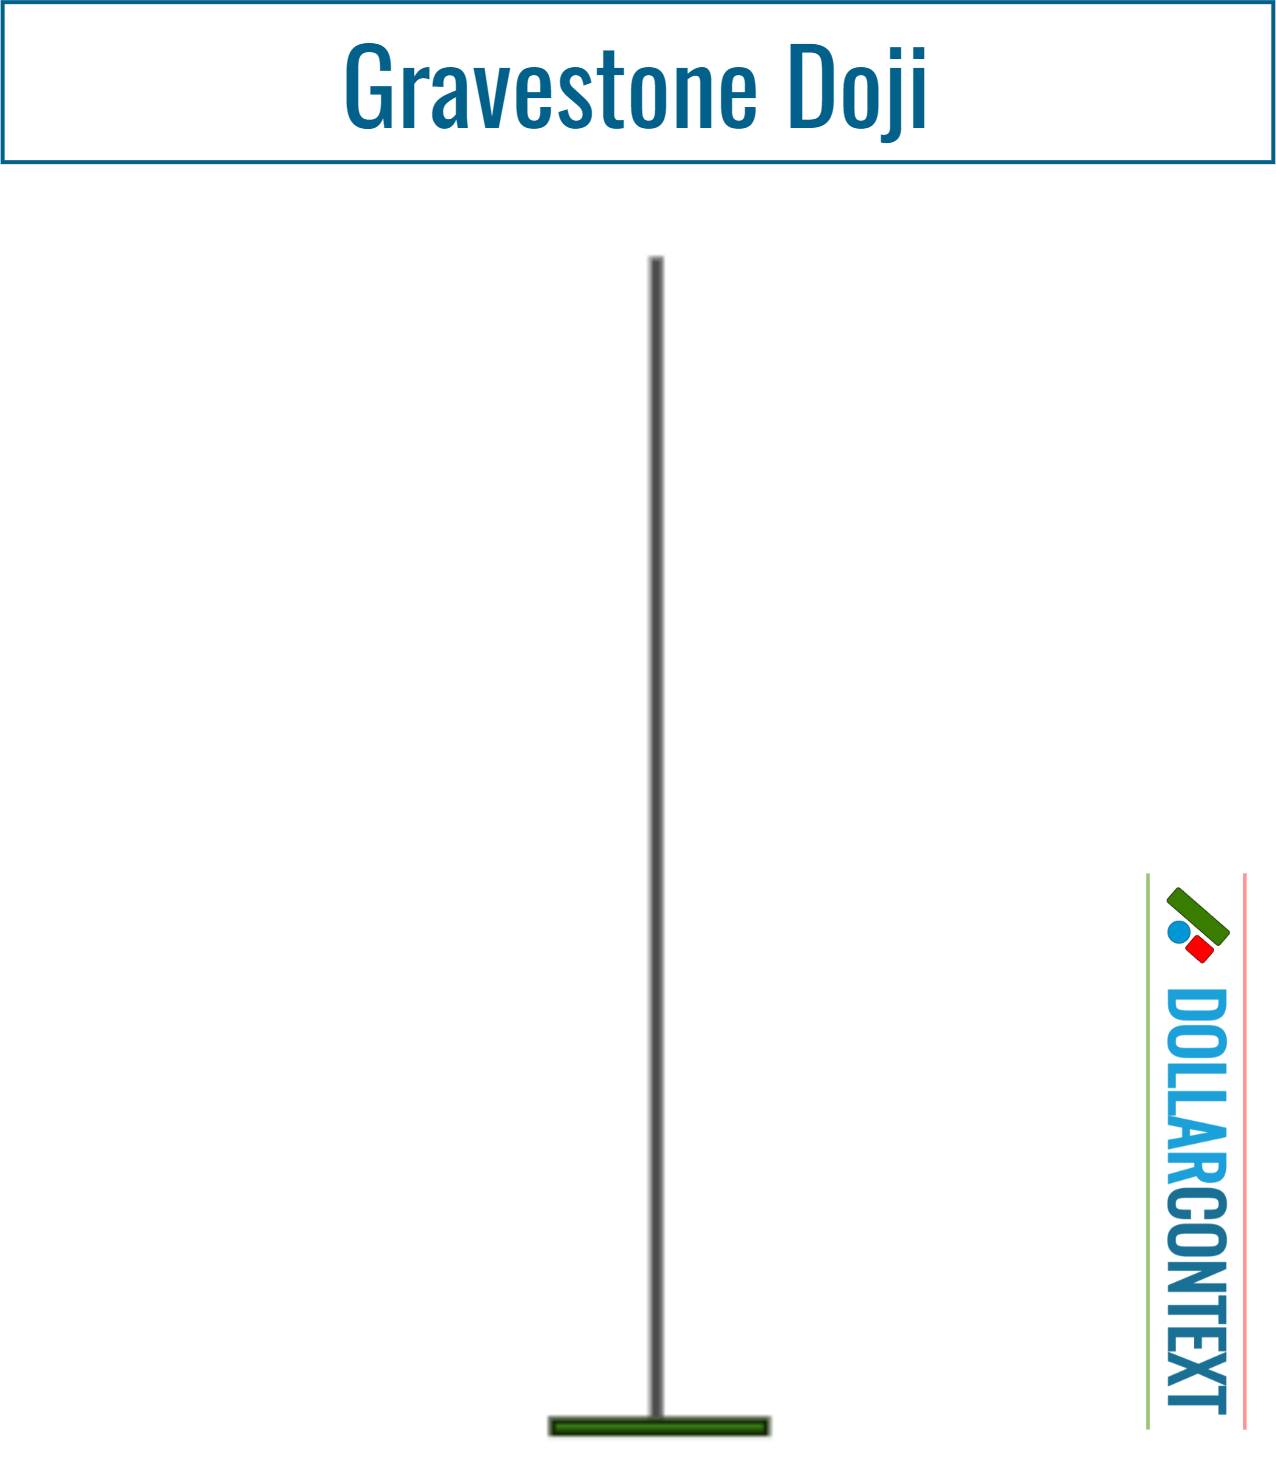
A gravestone doji is the opposite of the dragonfly, where prices were pushed higher, but sellers managed to bring them back down to the opening level.
Example
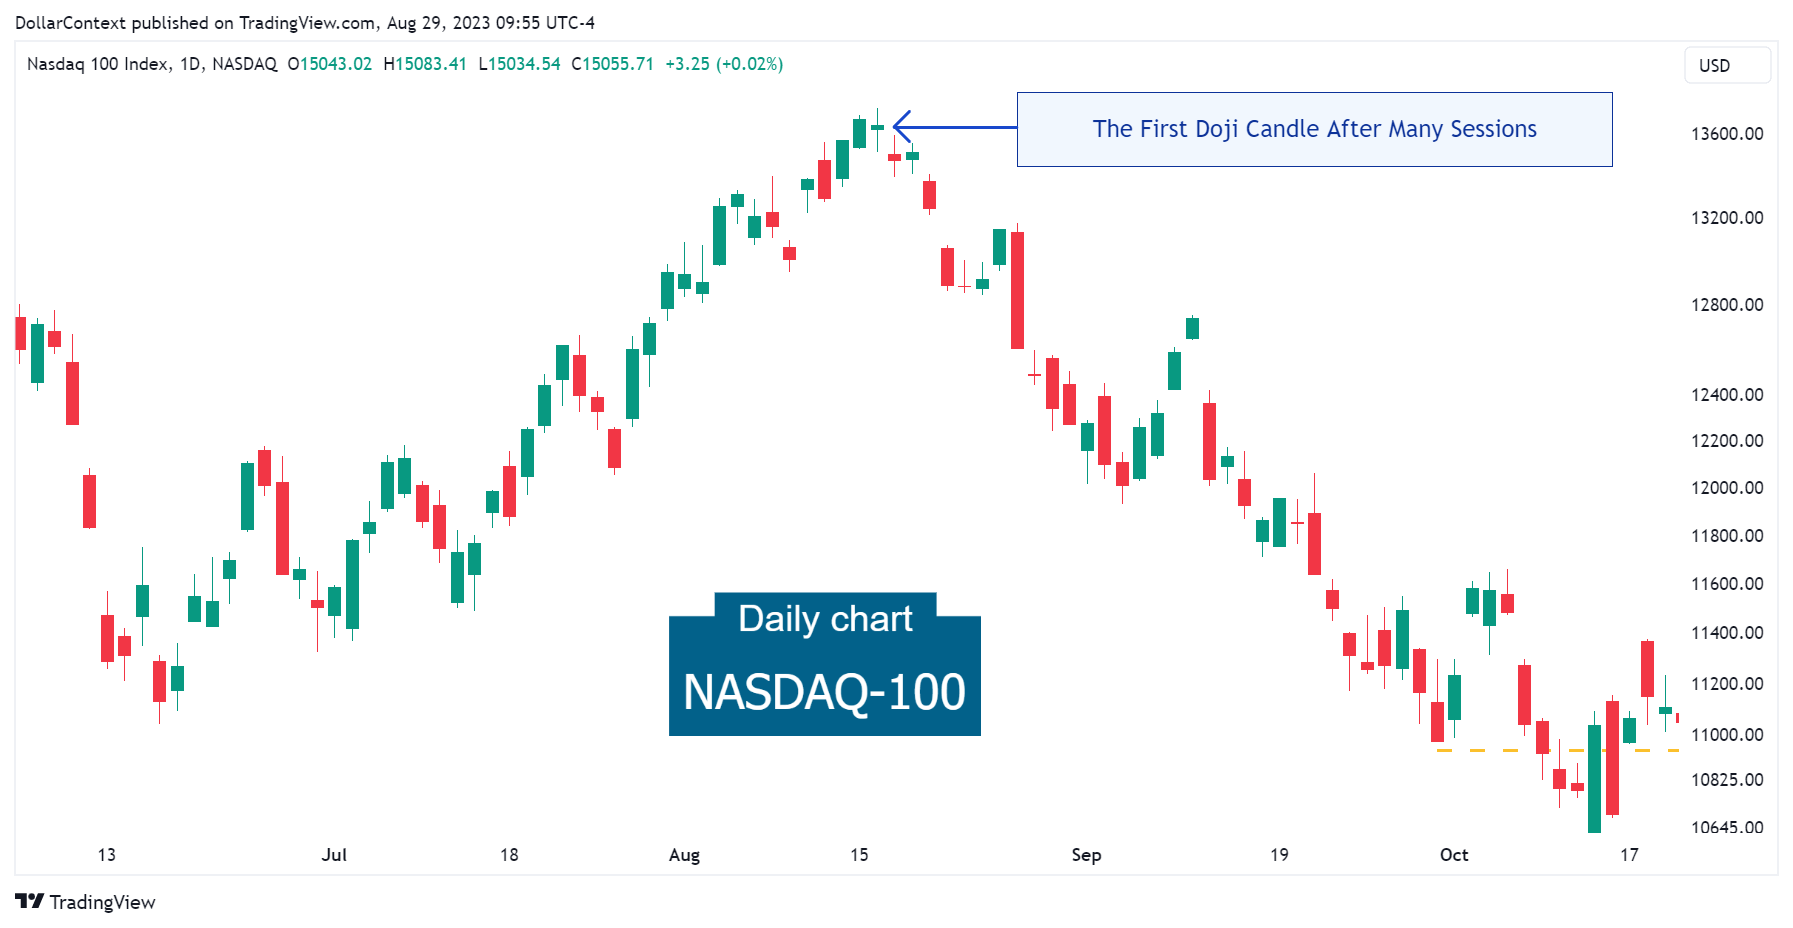
The chart below illustrates the sentiment shift that a doji candle can indicate following a prolonged upward or downward trend. After an extended rise, the Nasdaq-100 index presented a doji. Observe the significant downtrend in the market that ensued after this signal.
