How to Recognize a Doji Candle
A doji is a candlestick where the opening and closing prices are the same. That is, a doji session displays a horizontal line instead of a real body.

Shape of a Doji
A doji is a candlestick where the opening and closing prices are the same. That is, a doji session displays a horizontal line instead of a real body.
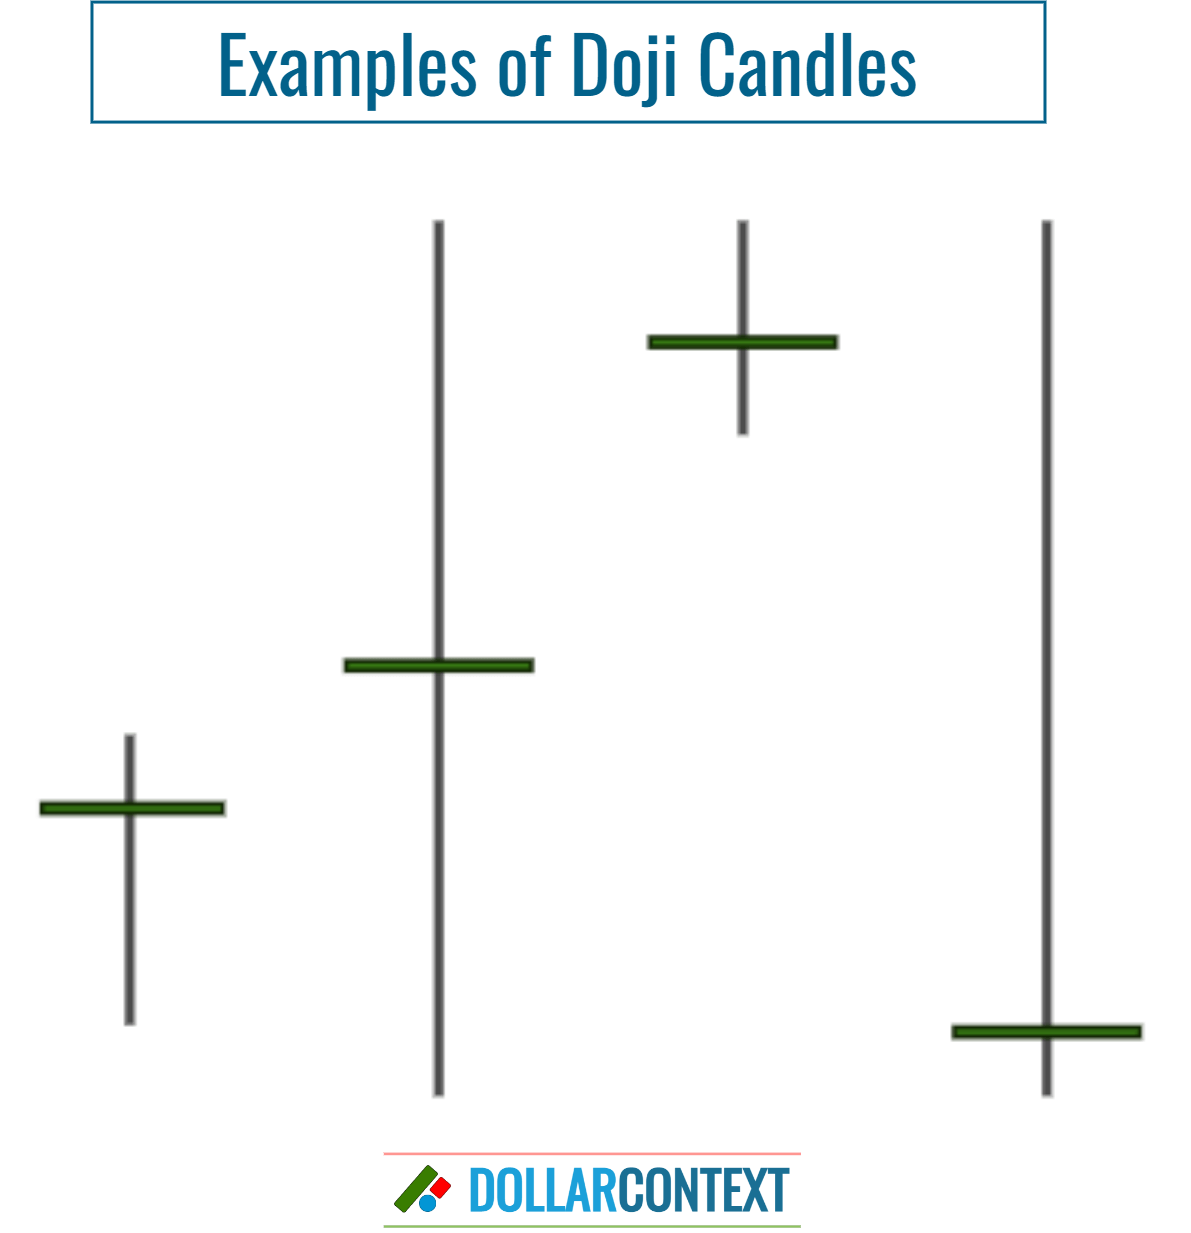
Note that the upper and lower shadows of a doji candle can be short or long.
Essentially, a doji looks like a thin cross or plus sign (+), and it signifies, psychologically, indecision in the market, with neither the buyers nor the sellers gaining an upper hand during that time period.
If the opening and closing prices are almost the same, the candle can be considered a doji under certain conditions. These near-doji candles are known as doji variations.
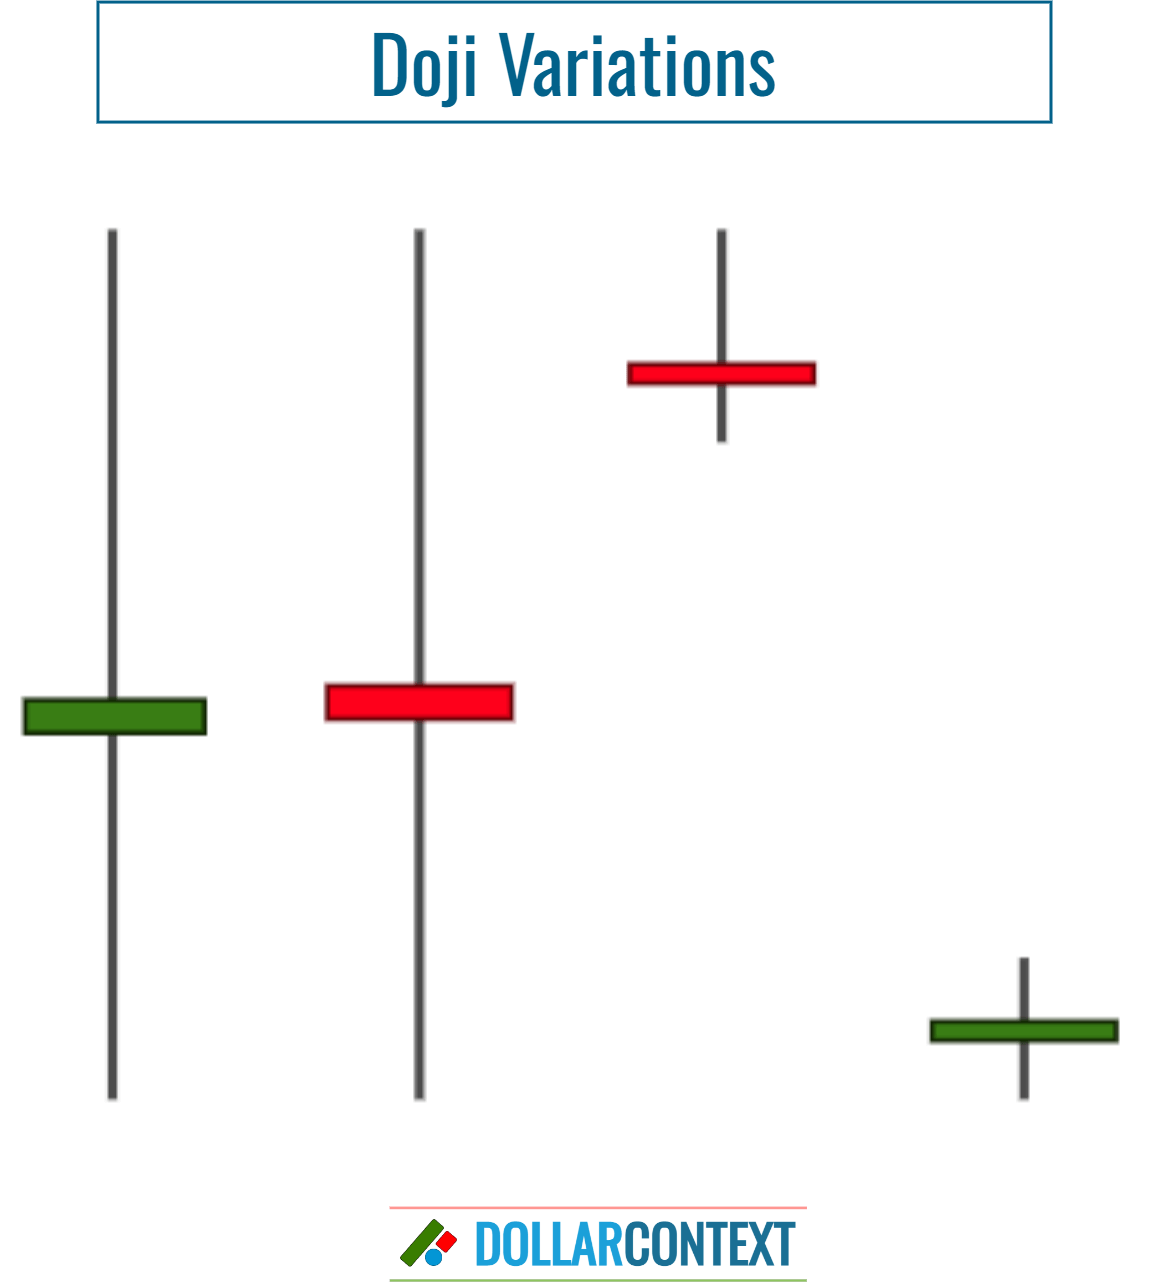
How can you determine if a candle with nearly matching open and close prices (a doji variation) should be counted as a doji? One approach is to compare the near-doji session with recent market activities. If there's a series of small bodies, the significance of the near-doji session diminishes.
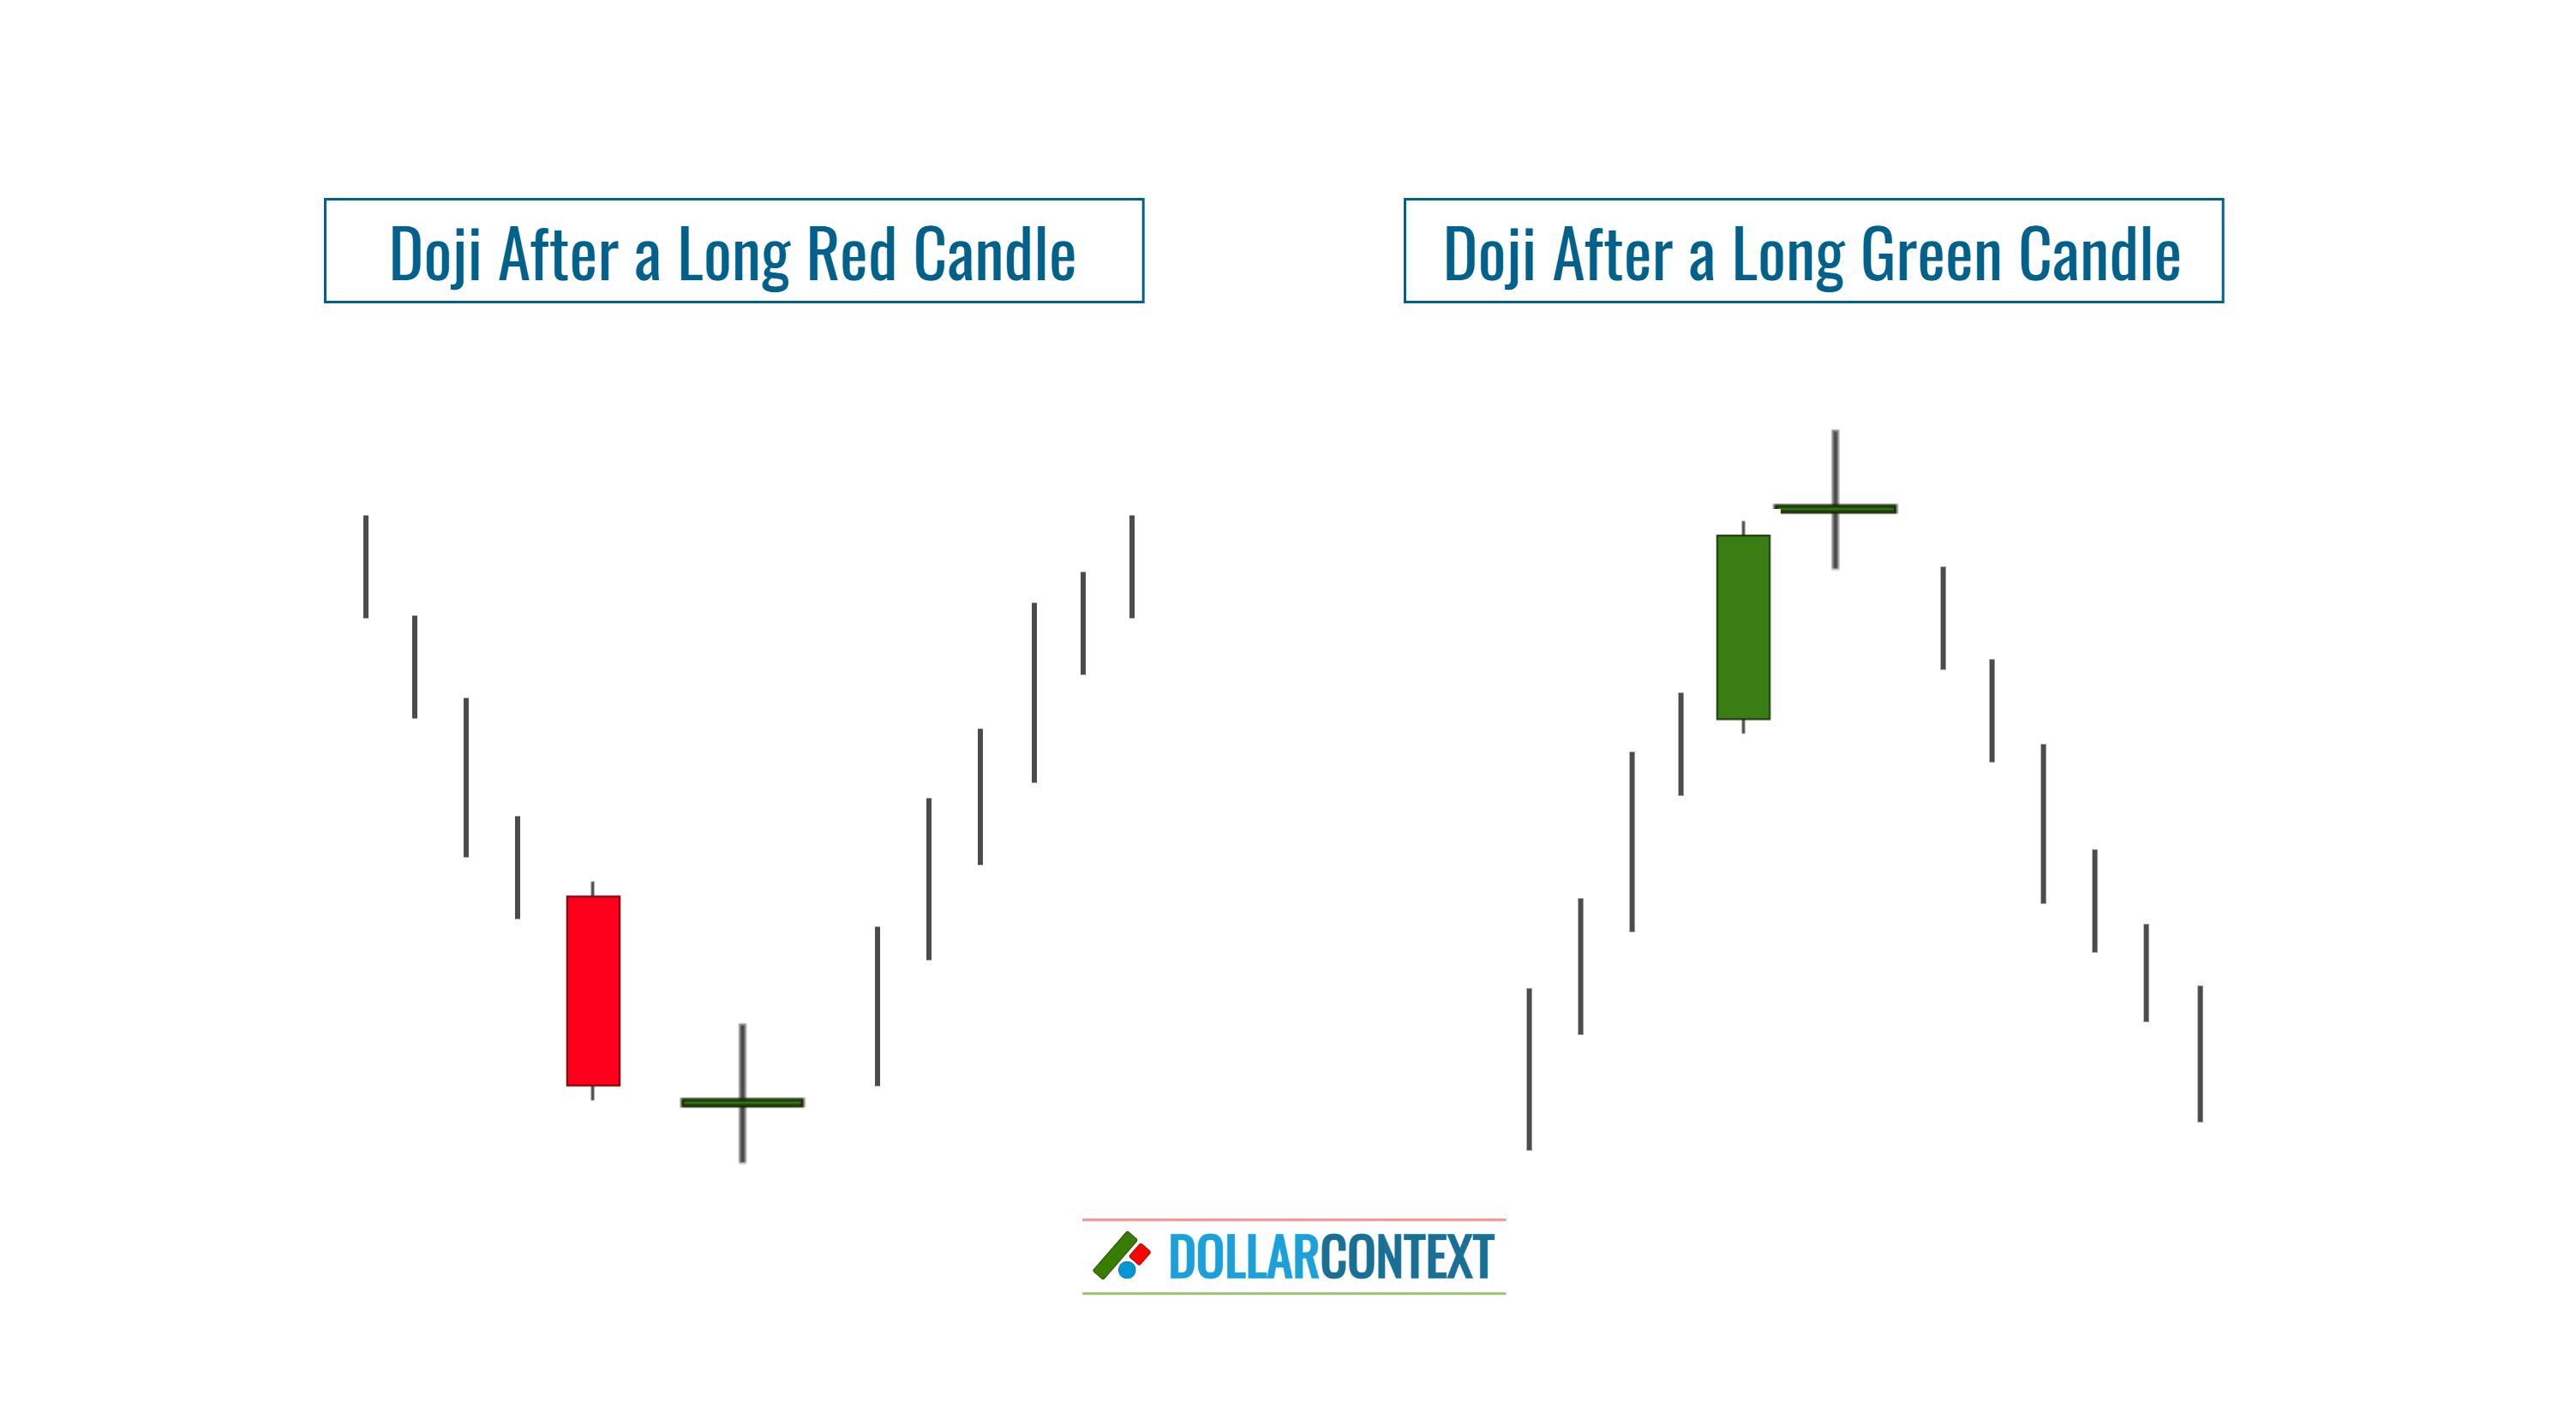
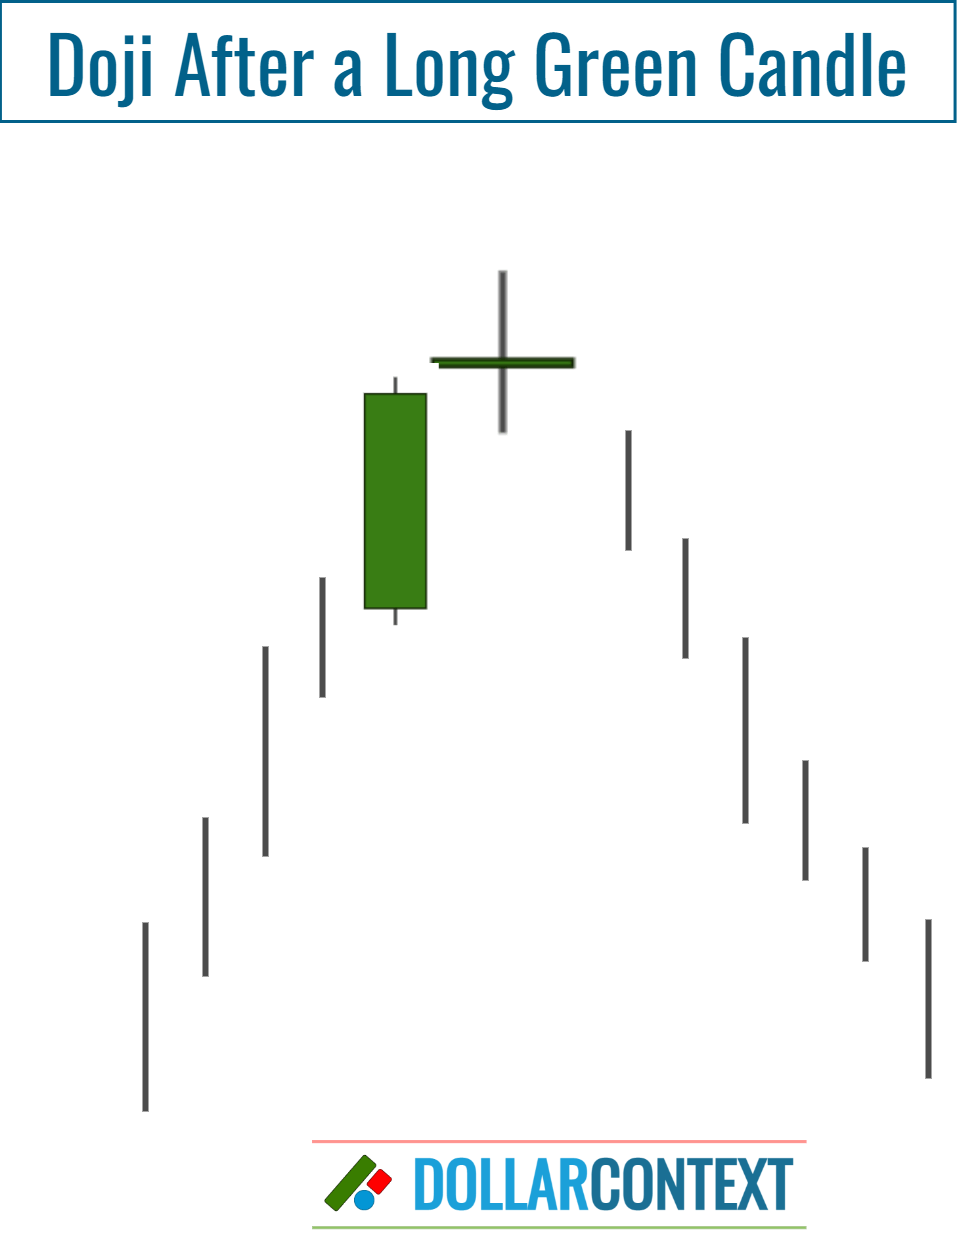
By contrast, when a doji appears after a long white (or green) body, especially within a mature bullish market, it is especially significant and warrants close attention. In this situation, you can open a short position based on your doji strategy.
Likewise, the opposite applies. When a doji follows a long black (or red) candle, especially within an extended bearish market, its significance increases, and it merits careful observation.
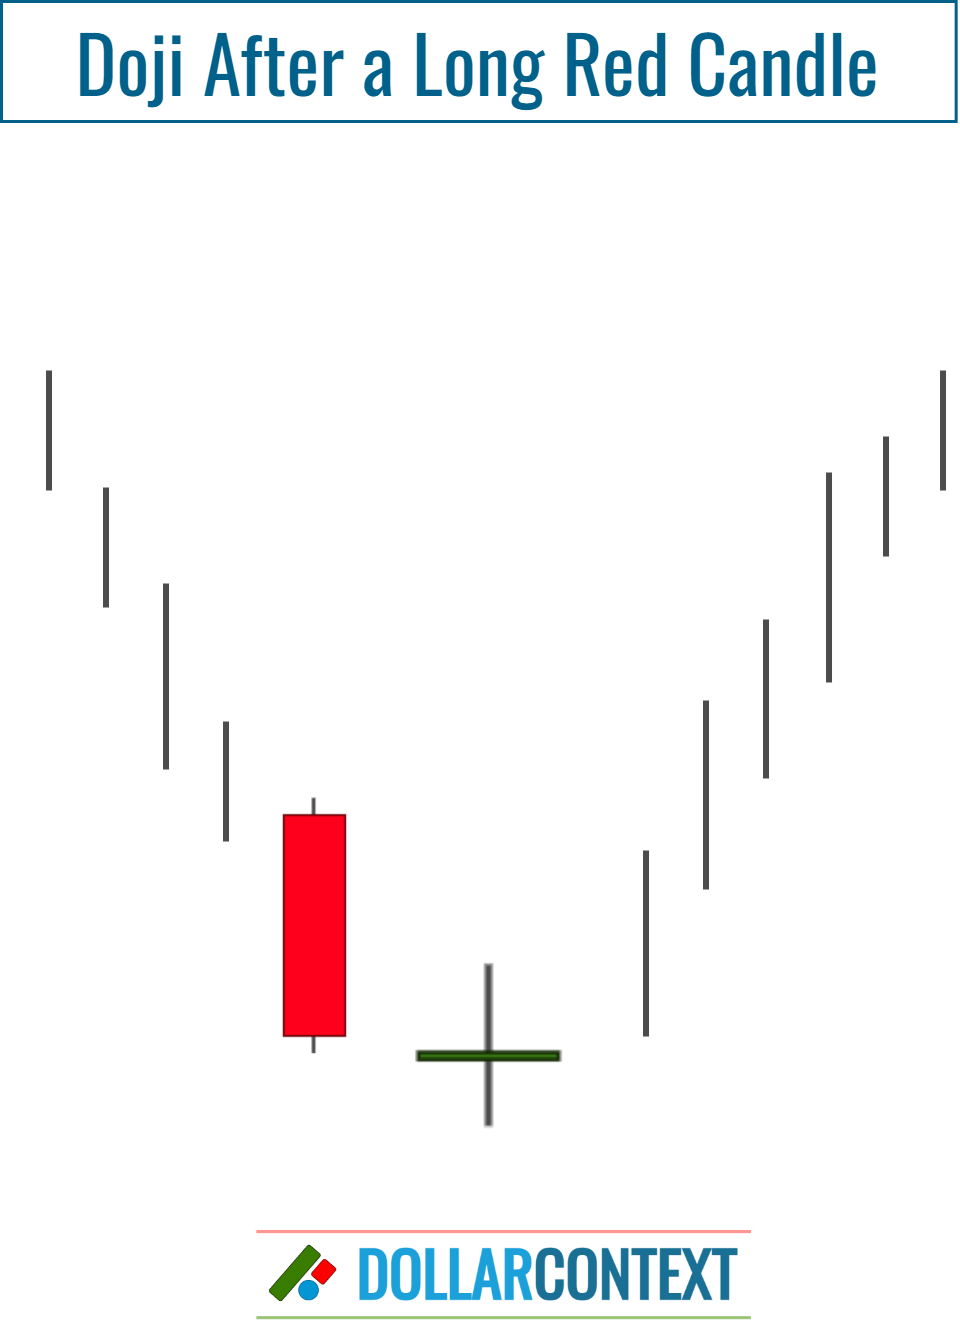
After a mature uptrend, the highs of a doji candle become resistance. This level can serve as your stop-loss when using a doji strategy. On a similar note, after a mature downtrend, the lows of a doji become support.
Specific Types of Doji Candles
There are particular types of doji candles, each carrying its own specific psychological nuances.
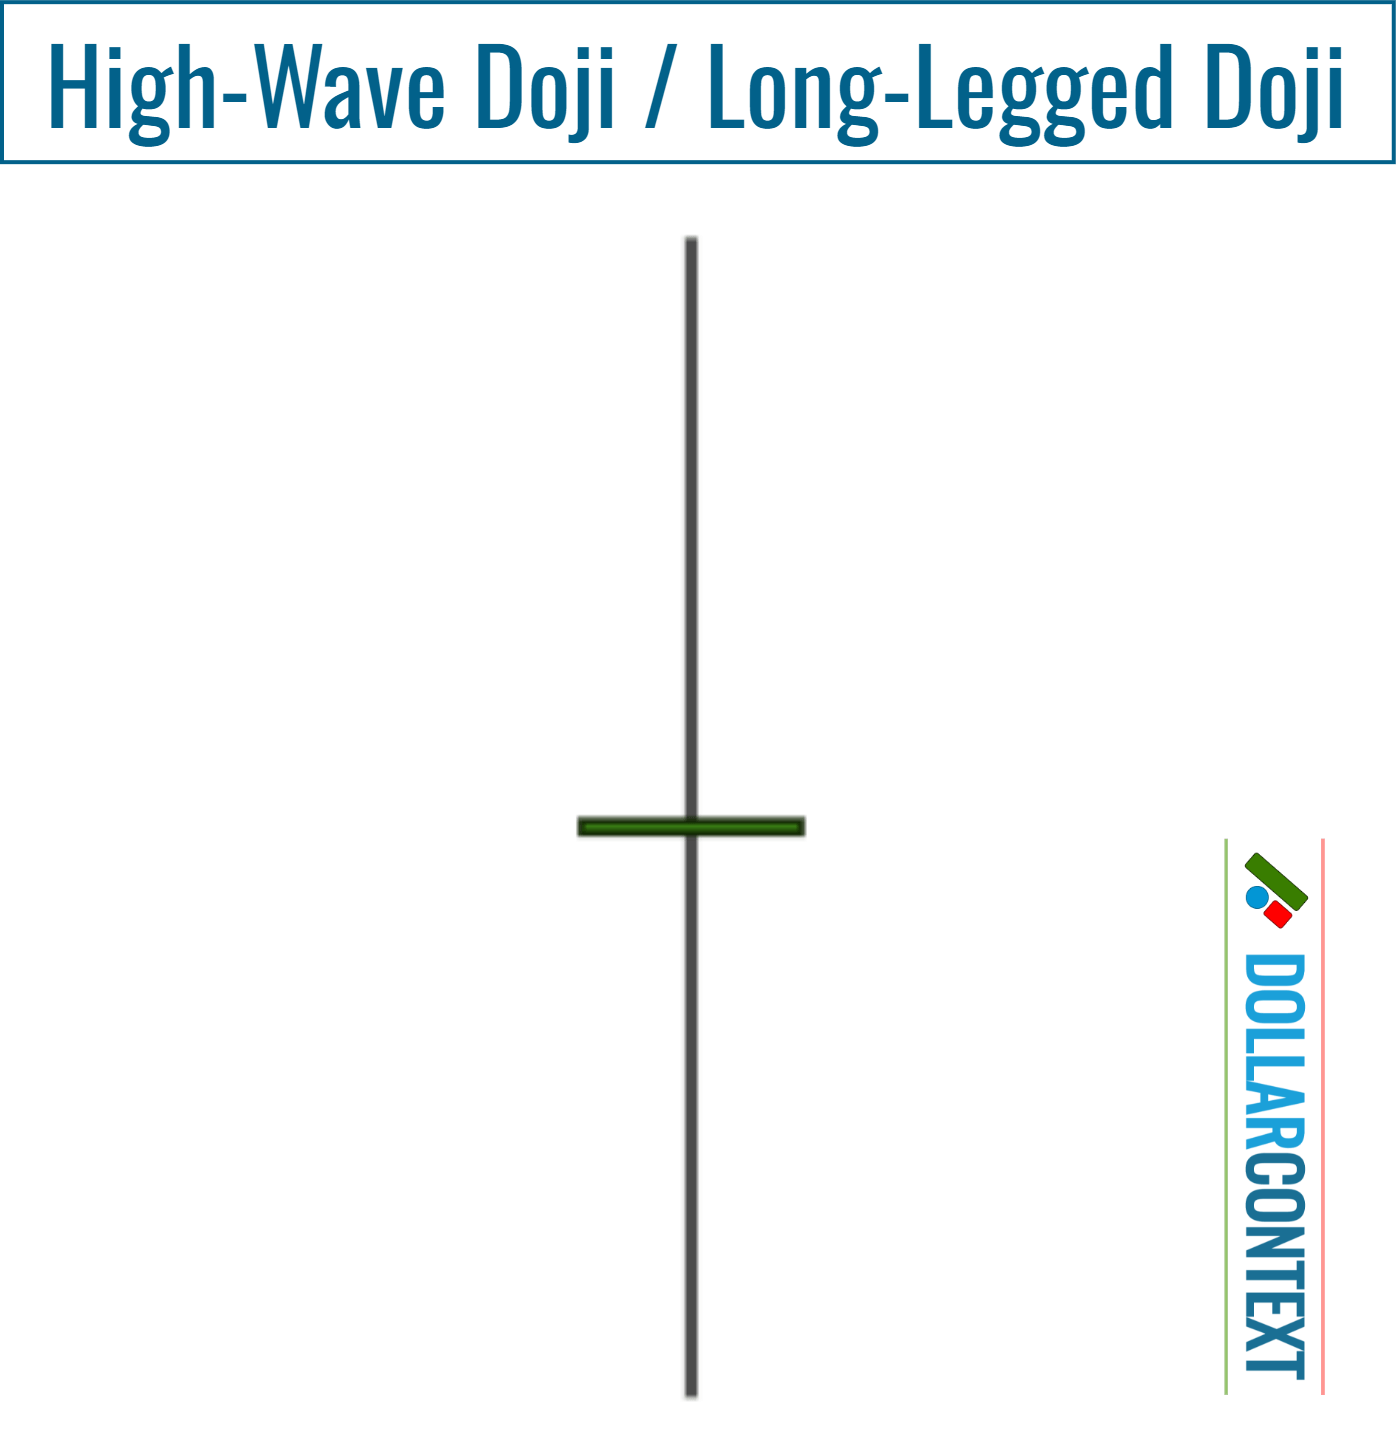
A long-legged doji, also known as high-wave doji, is characterized by a thin line with long shadows above and below the body, indicating significant price swings in both directions, but closing near its opening price. This shape signifies market indecision and high volatility within that period.
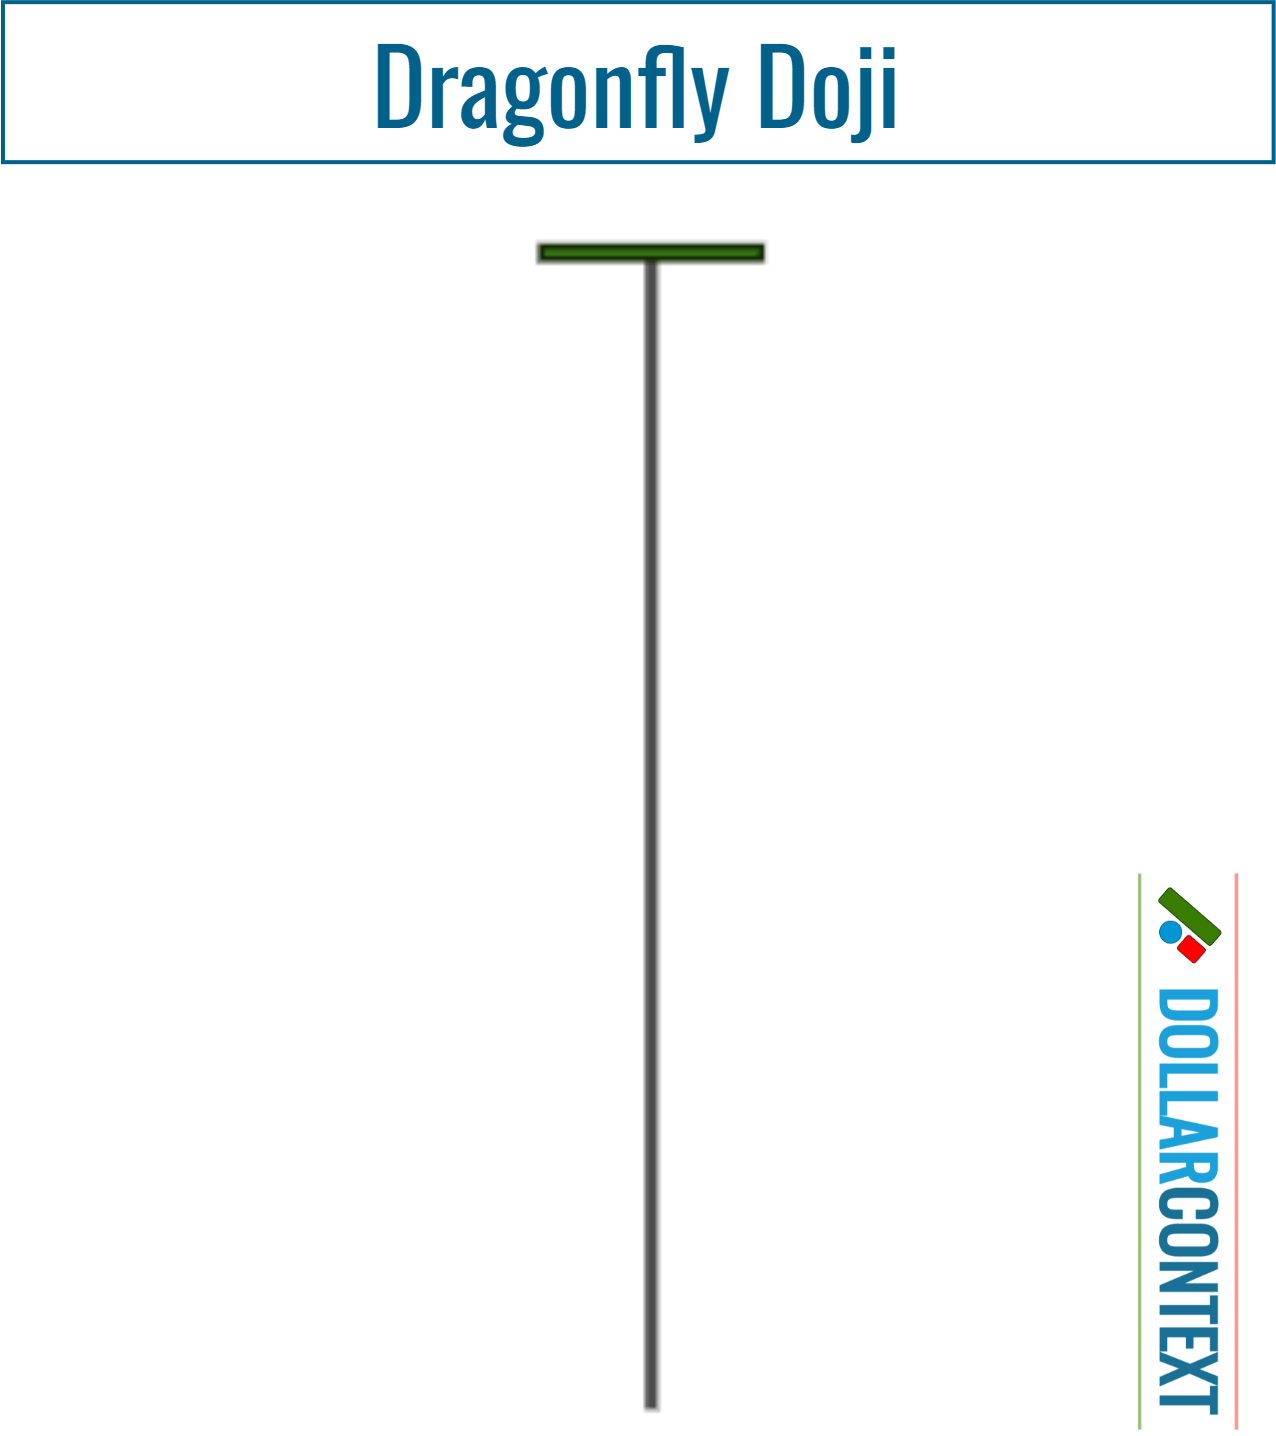
A dragonfly doji has a long lower shadow and no (or a minimal) upper shadow, with its opening and closing prices at or very near the high of the time period. This shape suggests that while sellers initially drove prices lower, buyers pushed them back up to nearly the starting point.
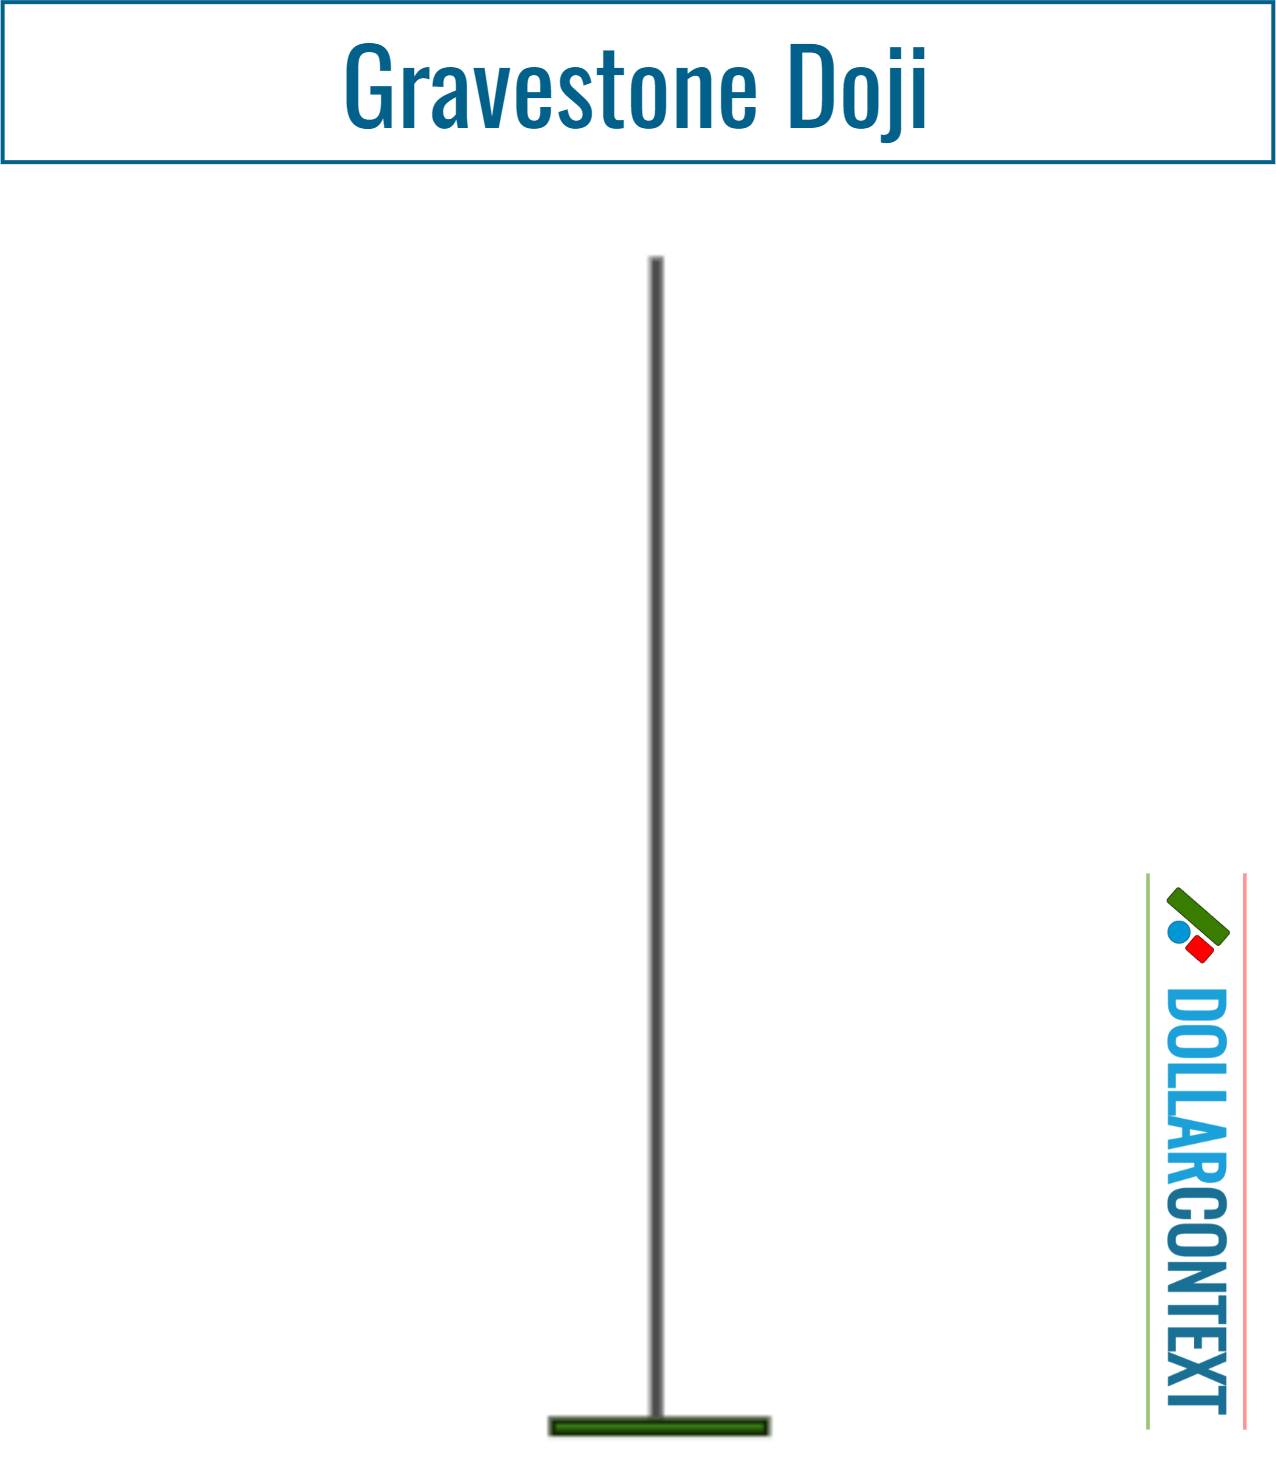
A gravestone doji features a long upper shadow and no (or a minuscule) lower shadow, with its opening and closing prices at or very near the low of the time period.
This shape indicates that buyers initially pushed prices higher, but sellers ultimately drove them back down to nearly the starting point. A gravestone doji is the opposite of the dragonfly.
Example
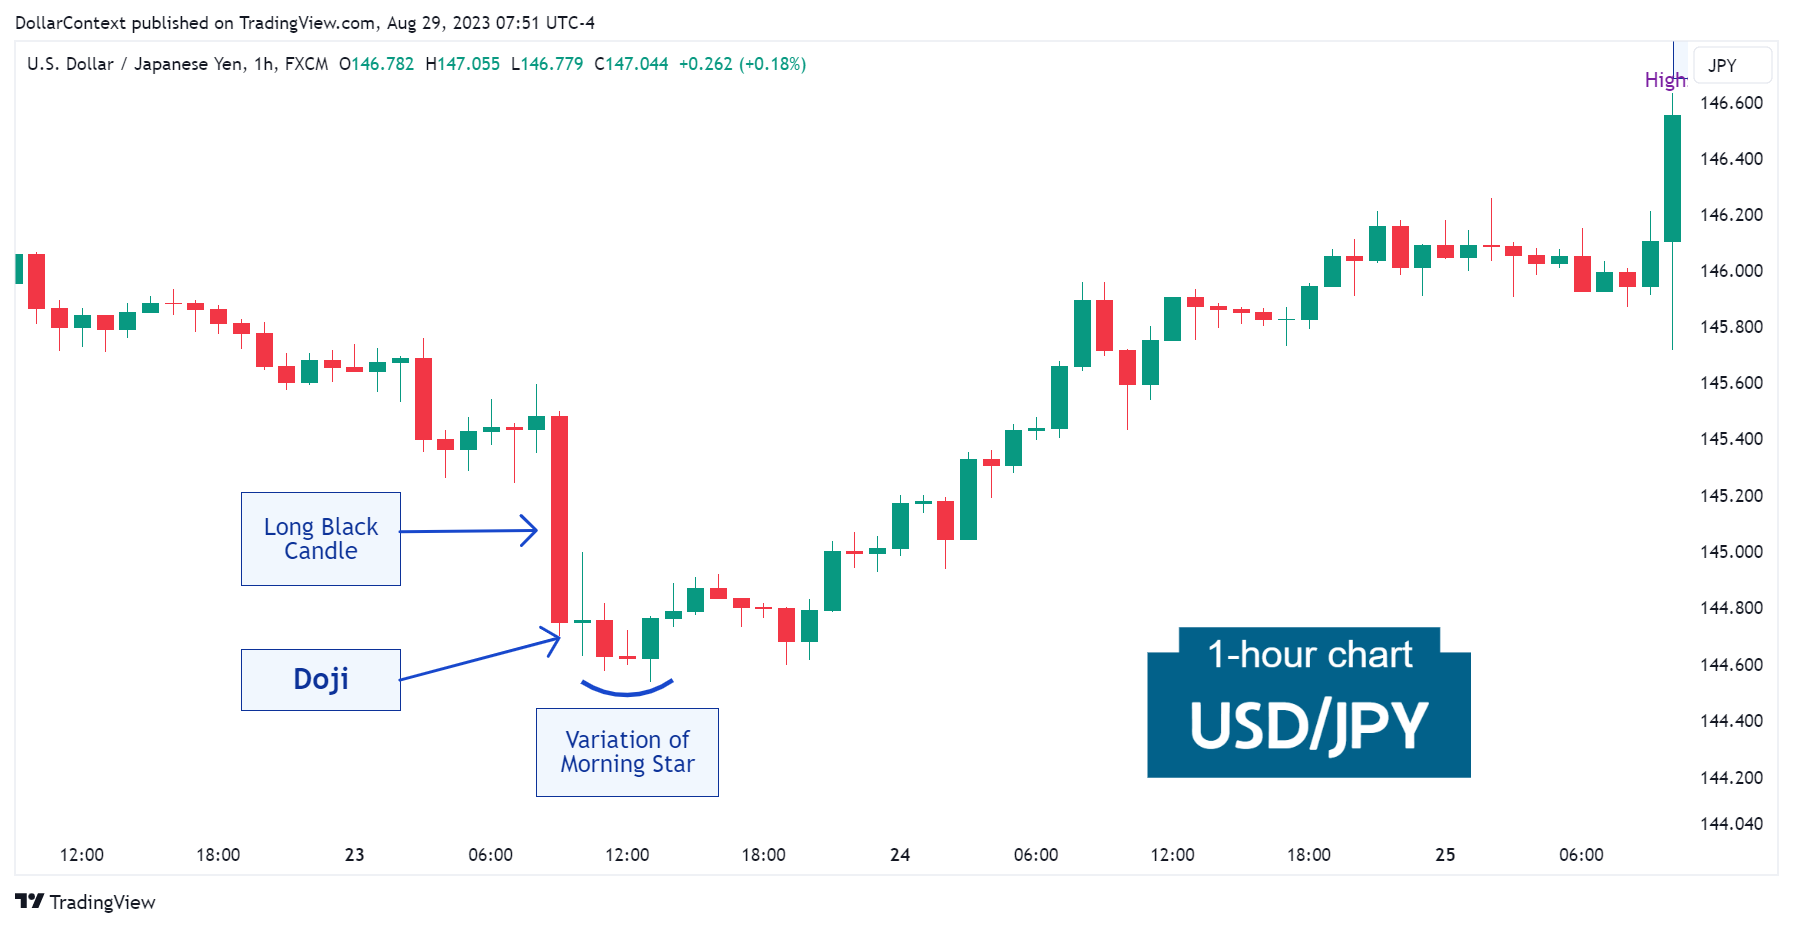
After a prolonged downtrend, the USD/JPY displayed a doji candlestick following a long red body in August 2023. Observe how the doji's lows functioned as a support level, which was effectively tested in subsequent sessions, upon closing, via a variation of the morning star pattern. Subsequently, the market exhibited a significant uptrend.