Doji: Significance in Different Market Scenarios
We discuss the implications of a doji candlestick in different market scenarios, including uptrends, downtrends, and trading ranges.
This article is part of the Doji candlestick tutorial series. For the complete guide, see the Doji Candlestick Pattern — Complete Guide.
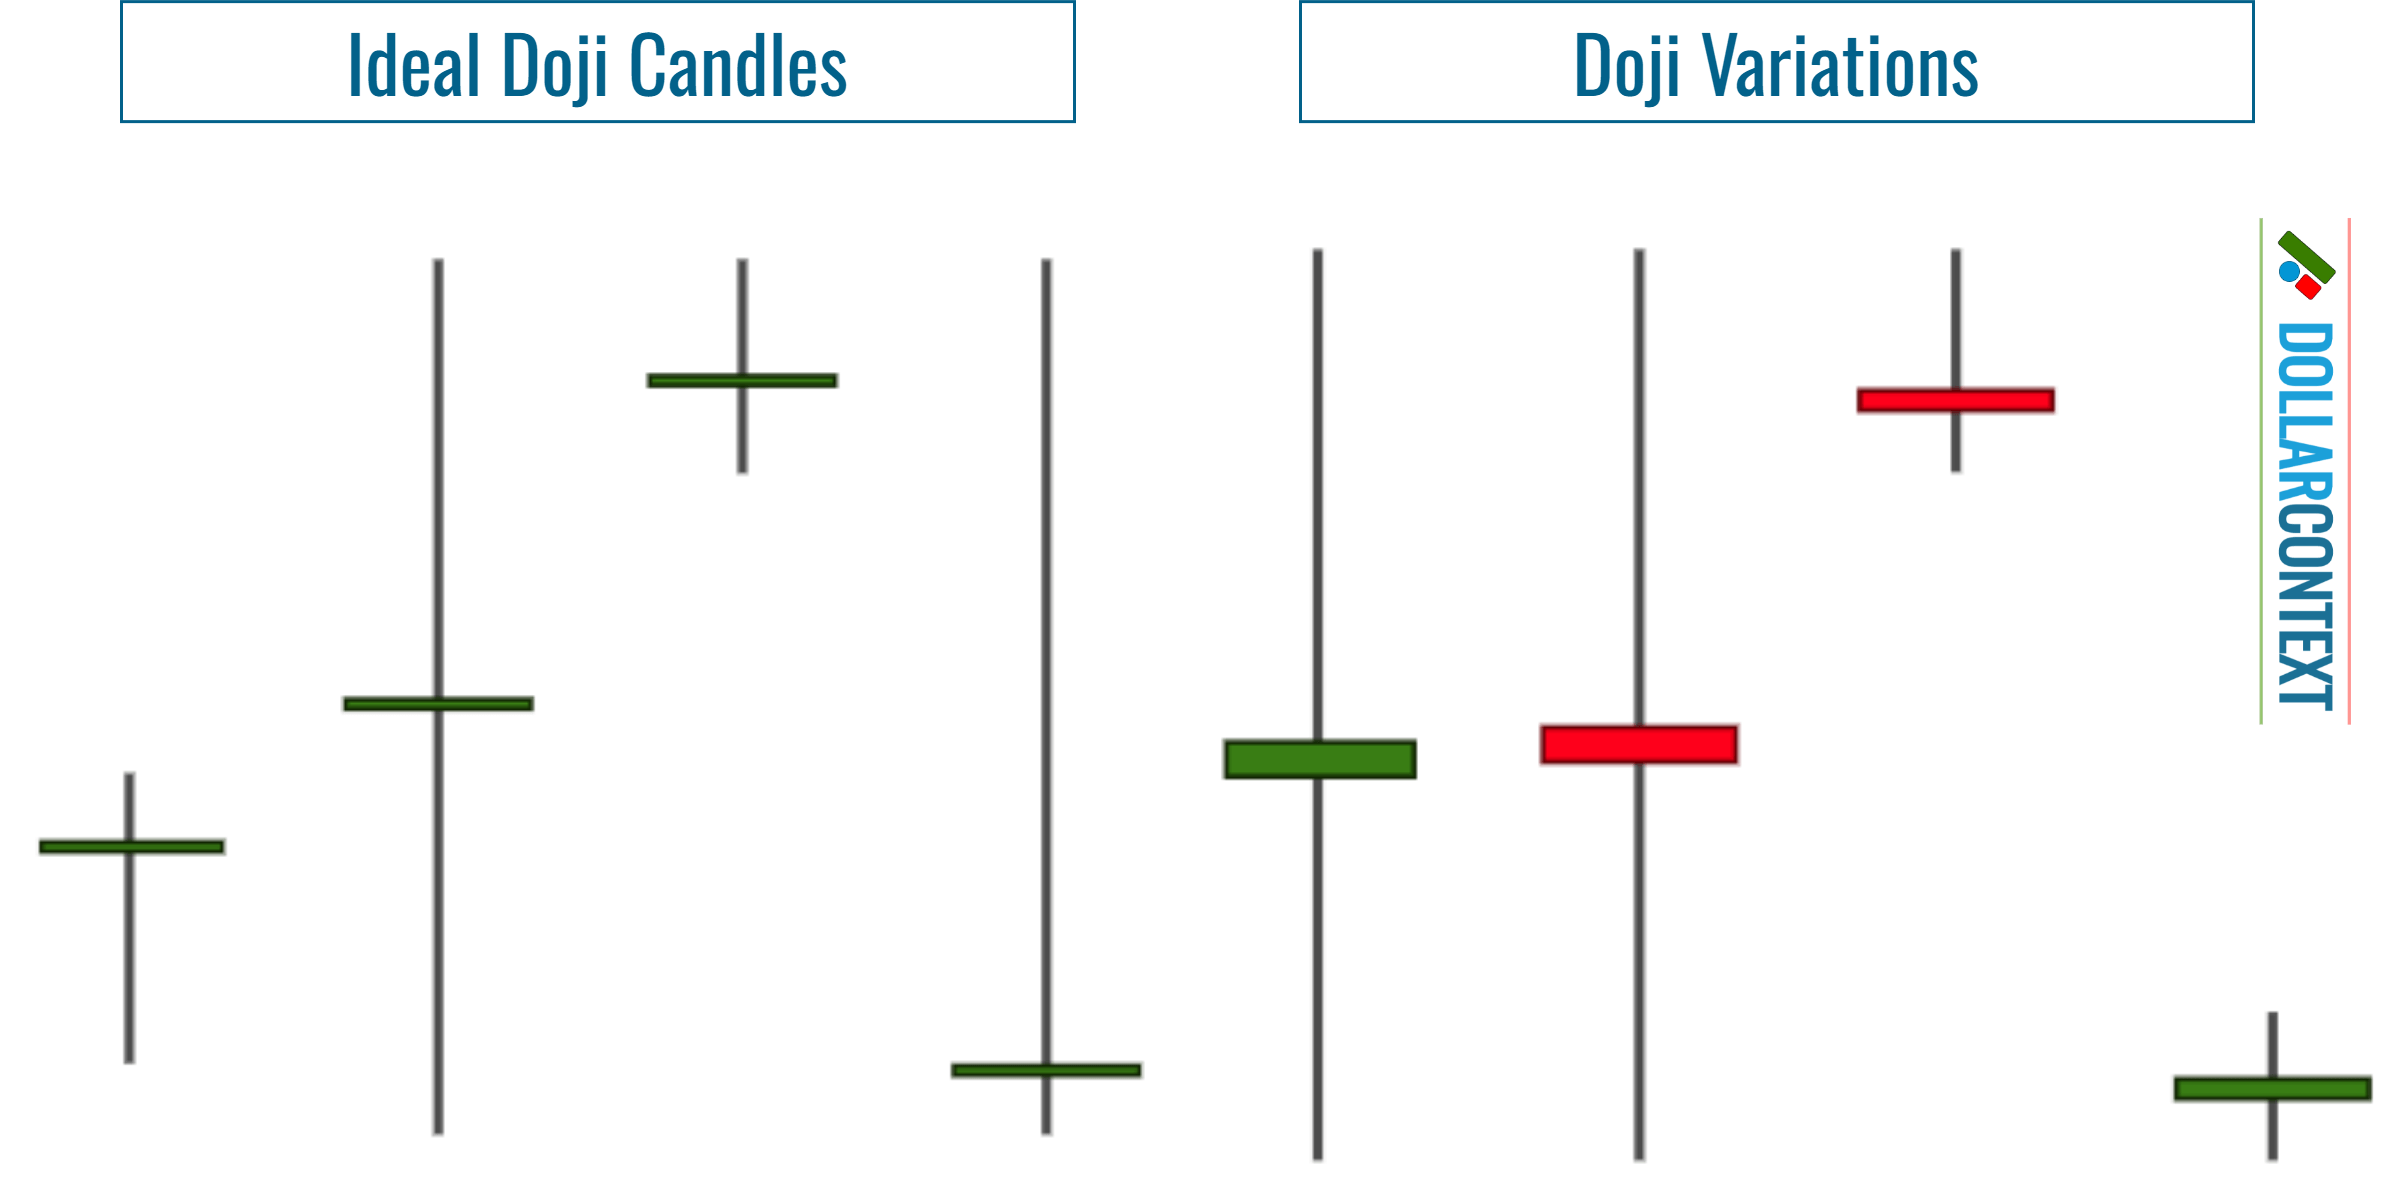
In the realm of candlestick analysis, one of the most crucial candle lines is the doji. As depicted below, a doji session showcases a horizontal line instead of a real body. This occurs when the session's open and close prices are equal or nearly so.
A perfect doji session features the same opening and closing prices. Nonetheless, this definition can be slightly flexible. If the opening and closing prices differ by only a few ticks, it might still qualify as a doji. For distinction, we call the standard type a "doji" and any minor departure from it a "doji variation."
1. Doji Significance: Trend-Driven Market vs. Sideways Action
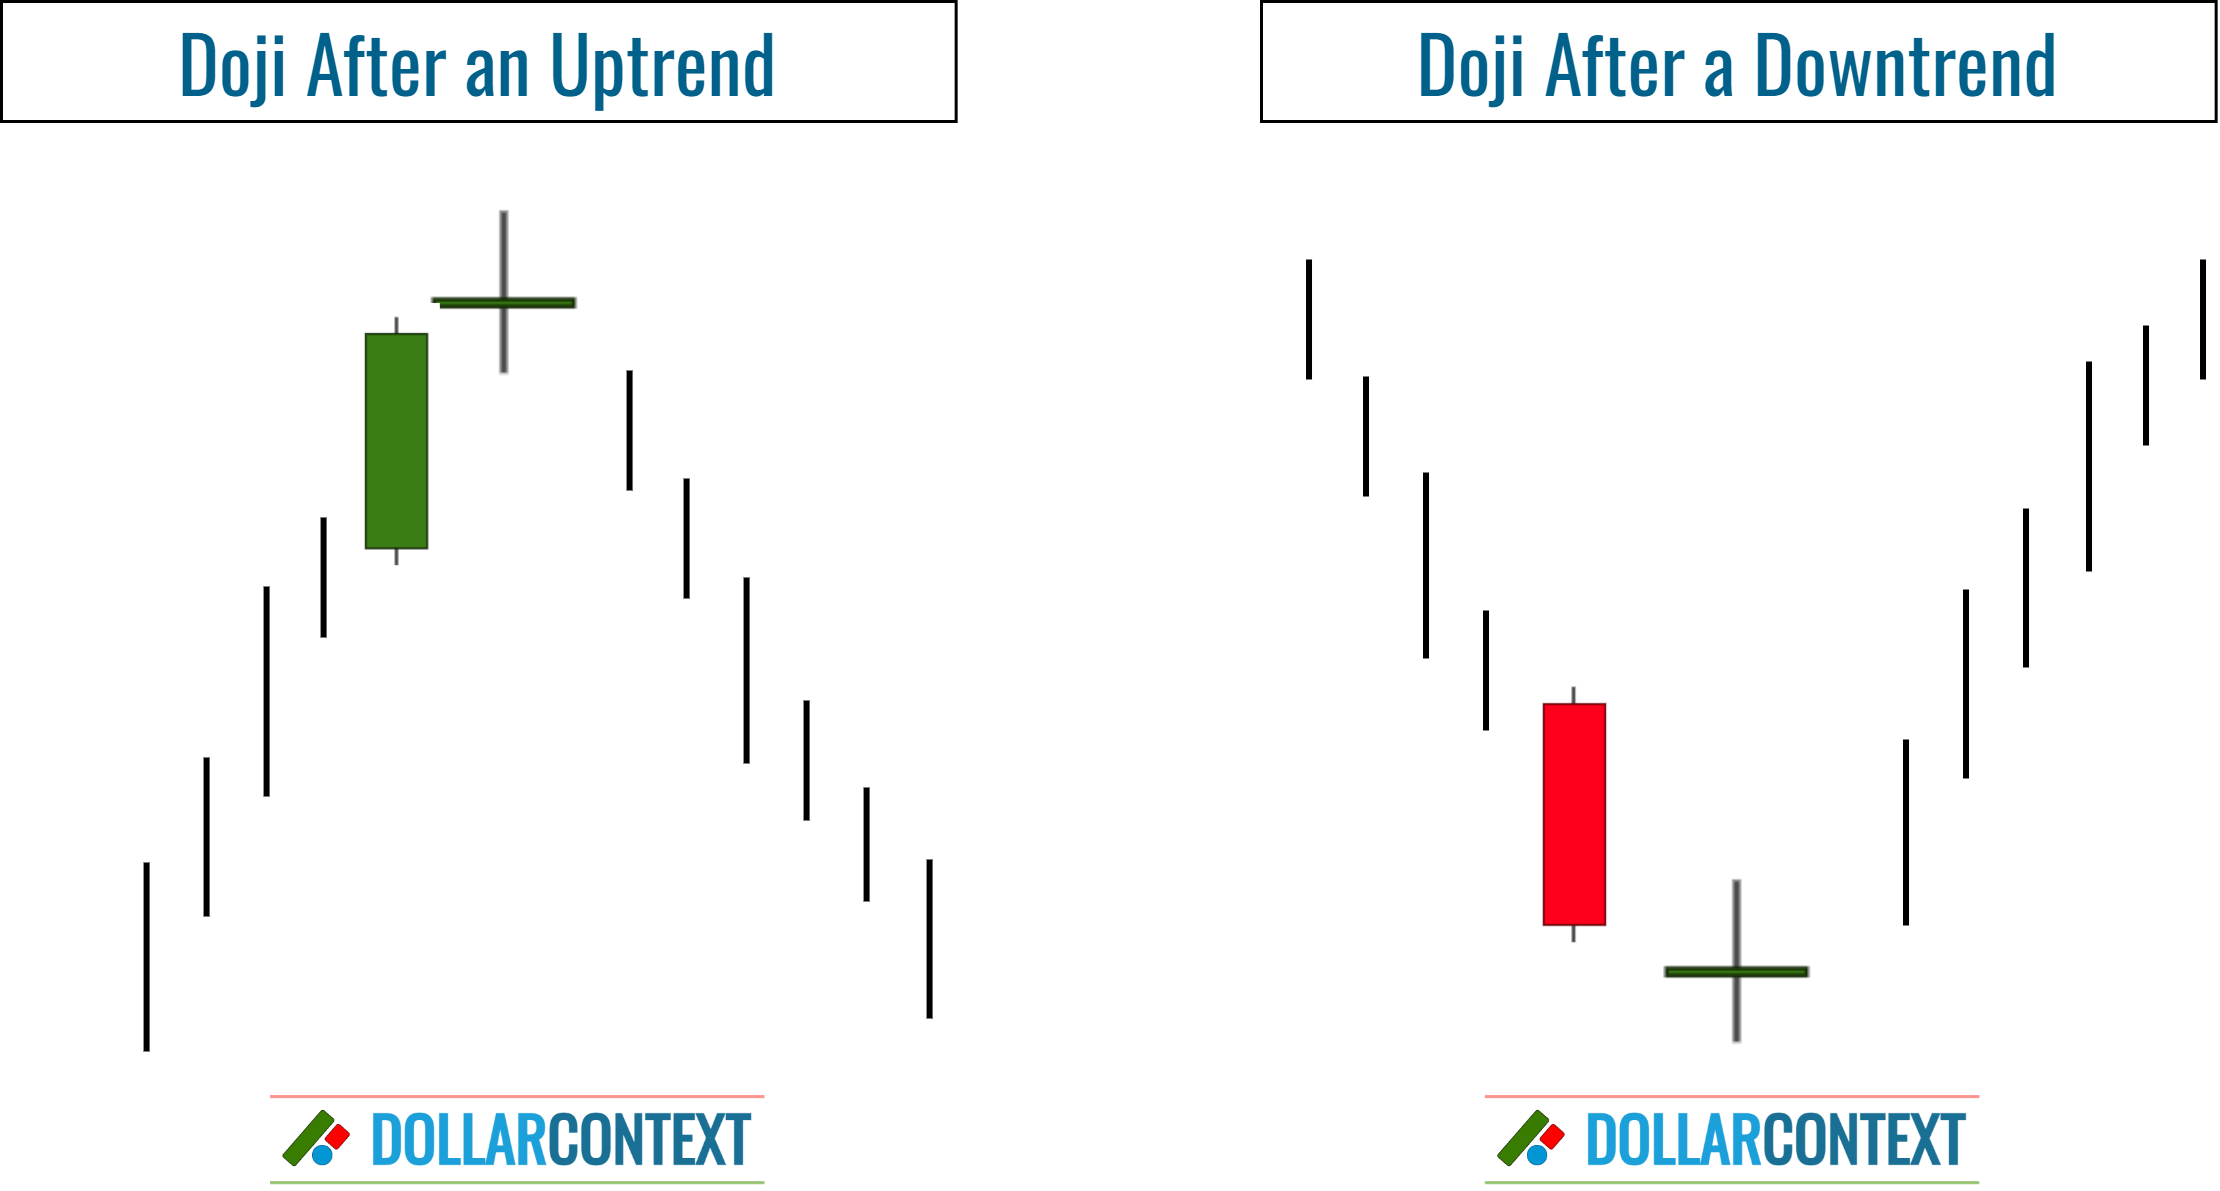
A doji epitomizes perfectly a balanced market, suggesting a potential transition point between the bulls and the bears. A doji appearing after the mature phase of an uptrend or a sell-off is indicative of a potential market turn.
It's erroneous to interpret immediately the doji as a buy or sell signal. While it might hint at a potential trend reversal, it's wiser to view the doji as representing a transitional market rather than a direct reversal pattern. Based on this, traders are advised to wait for the subsequent sessions after a doji to confirm the market direction.
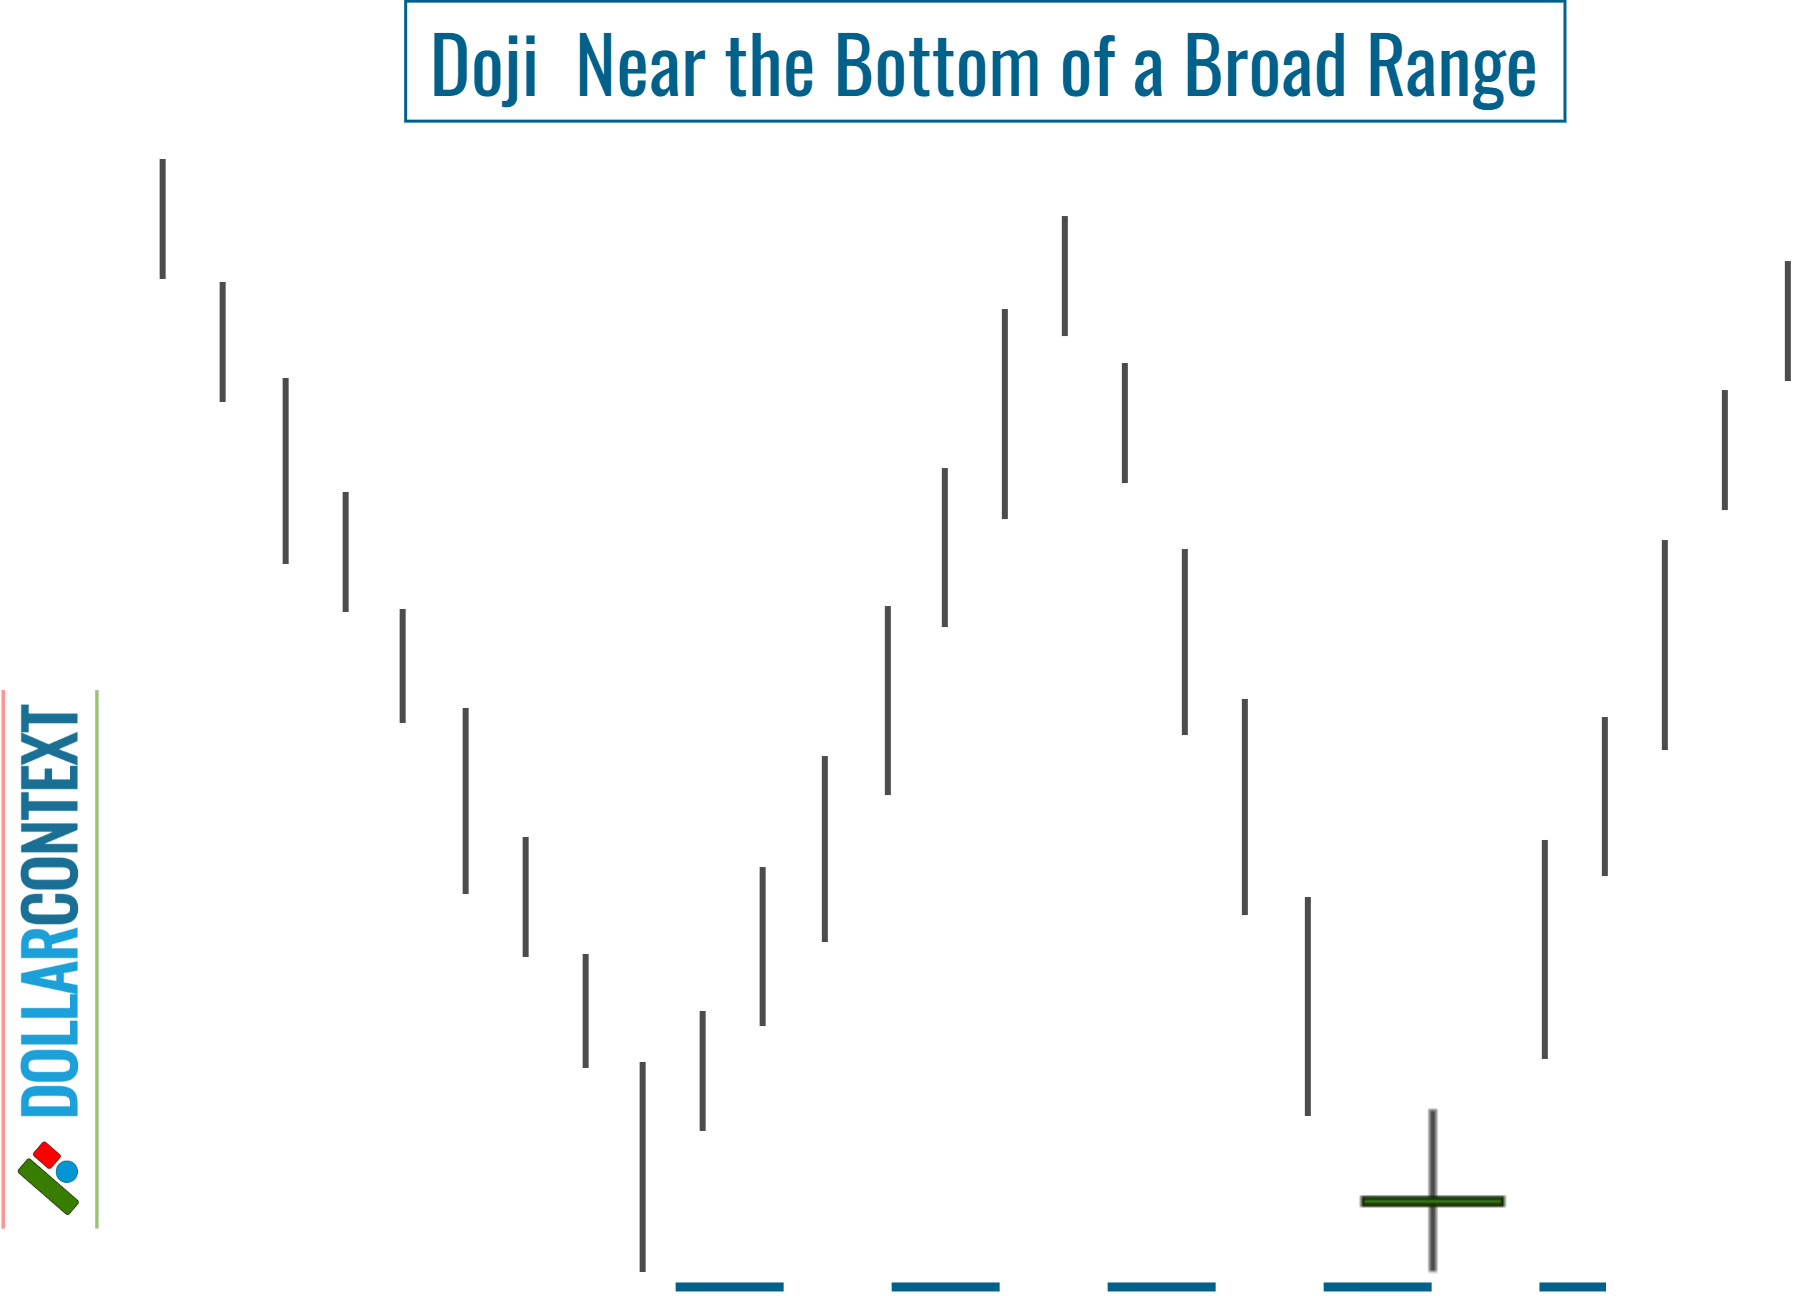
In lateral trading situations, a doji is neutral, representing the market's indecision on a smaller scale. Nevertheless, when a doji appears close to the upper or lower limit of a wide range, it might signal a movement back to the opposite end of that range.
2. Implications of a Doji in an Uptrend
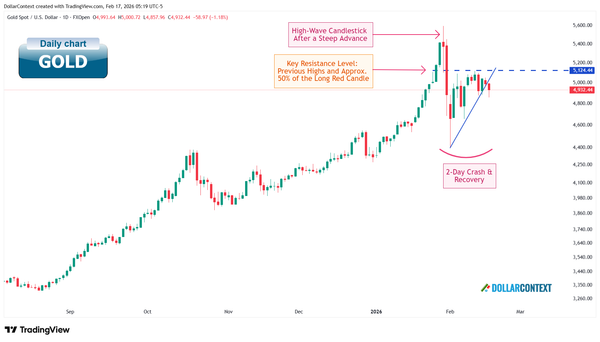
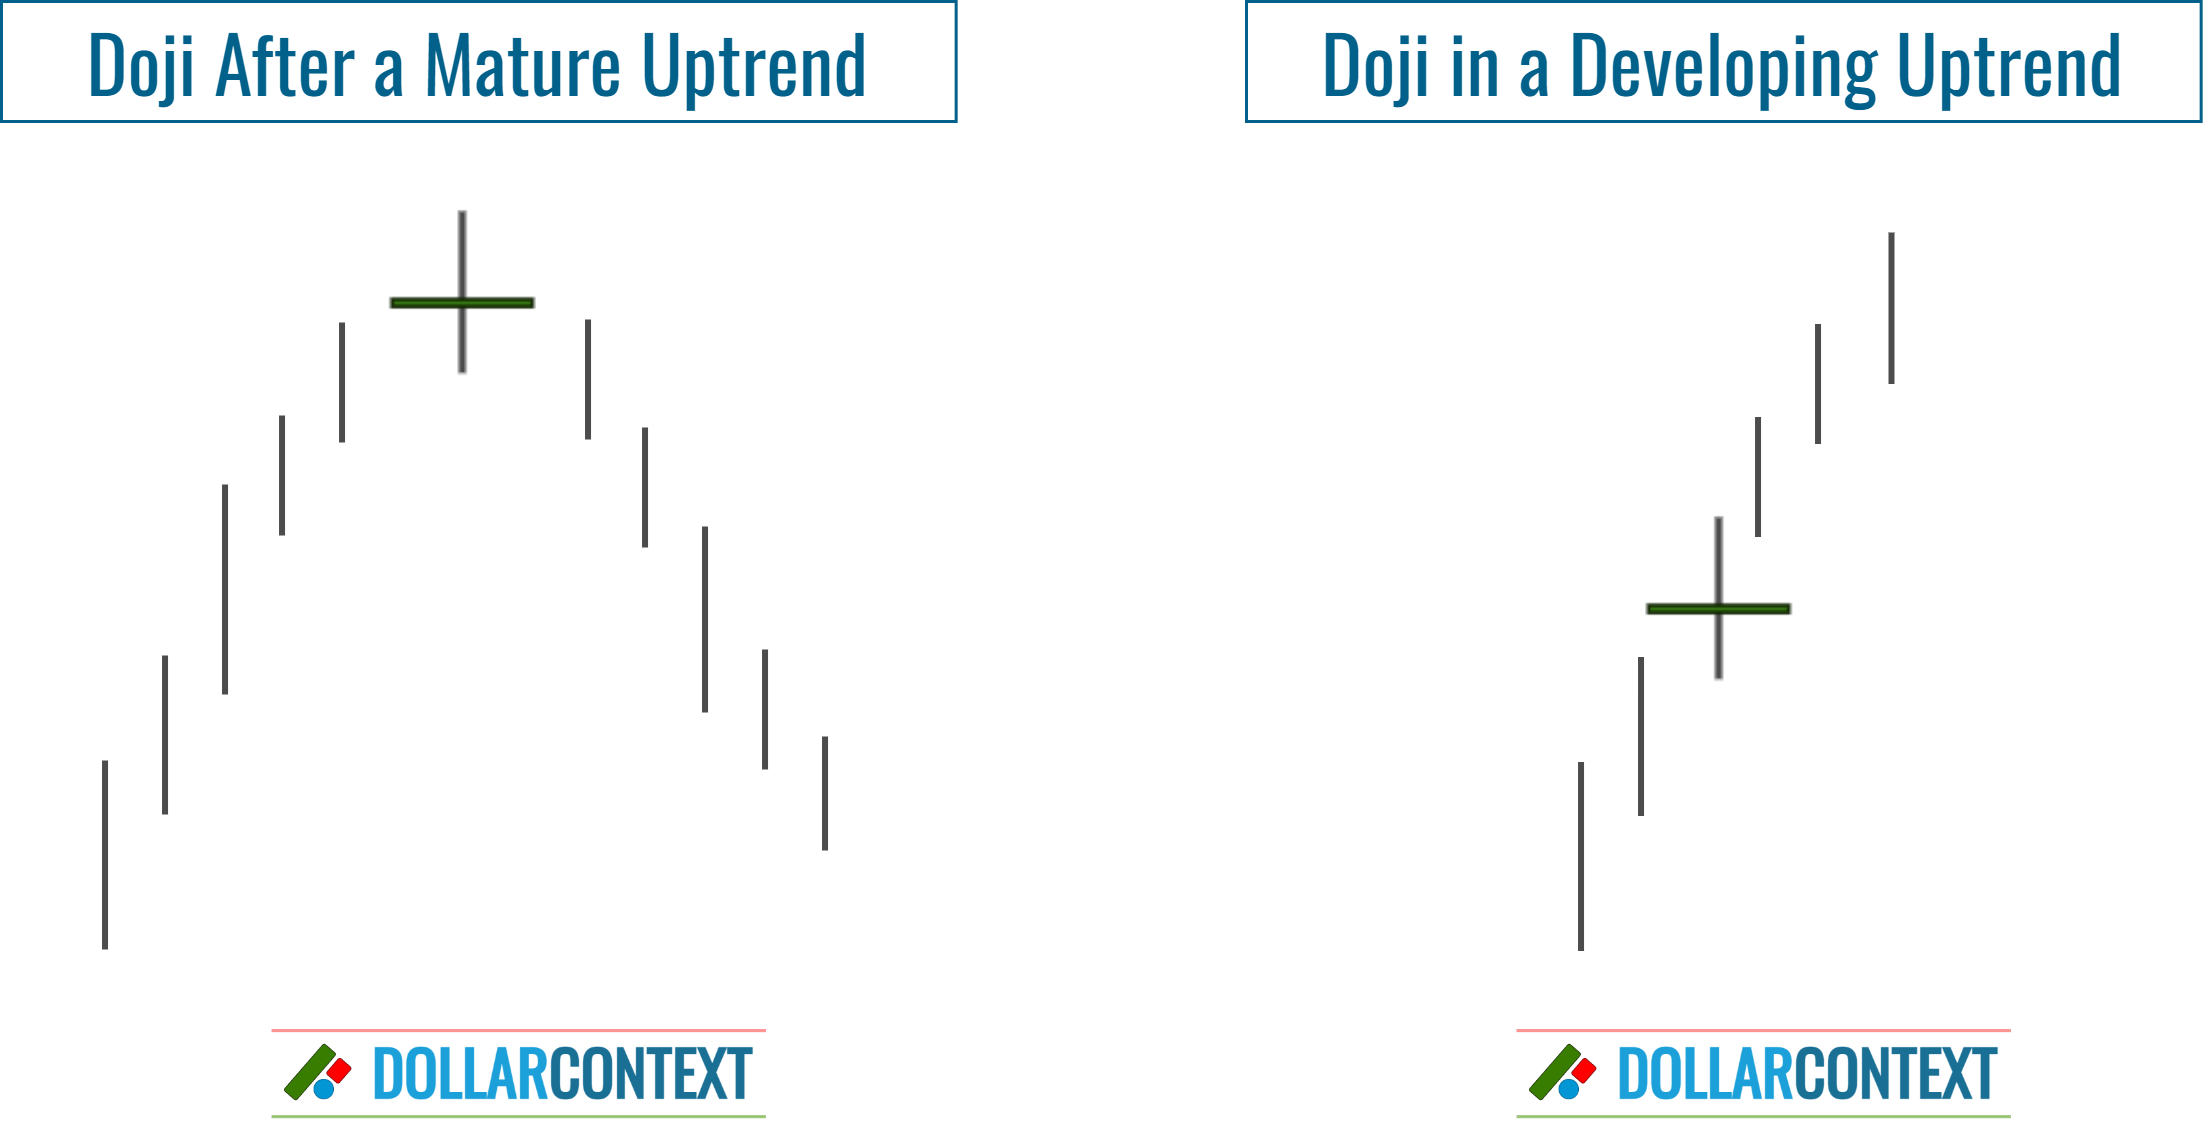
An essential aspect of understanding a doji session is recognizing its placement within a trend. The following image illustrates this, showing how a doji after a rapid rise might indicate a market top. Yet, if the market has just begun its ascent, there's a reduced likelihood of it being at its peak.
2.1 After the Doji: Market Possibilities
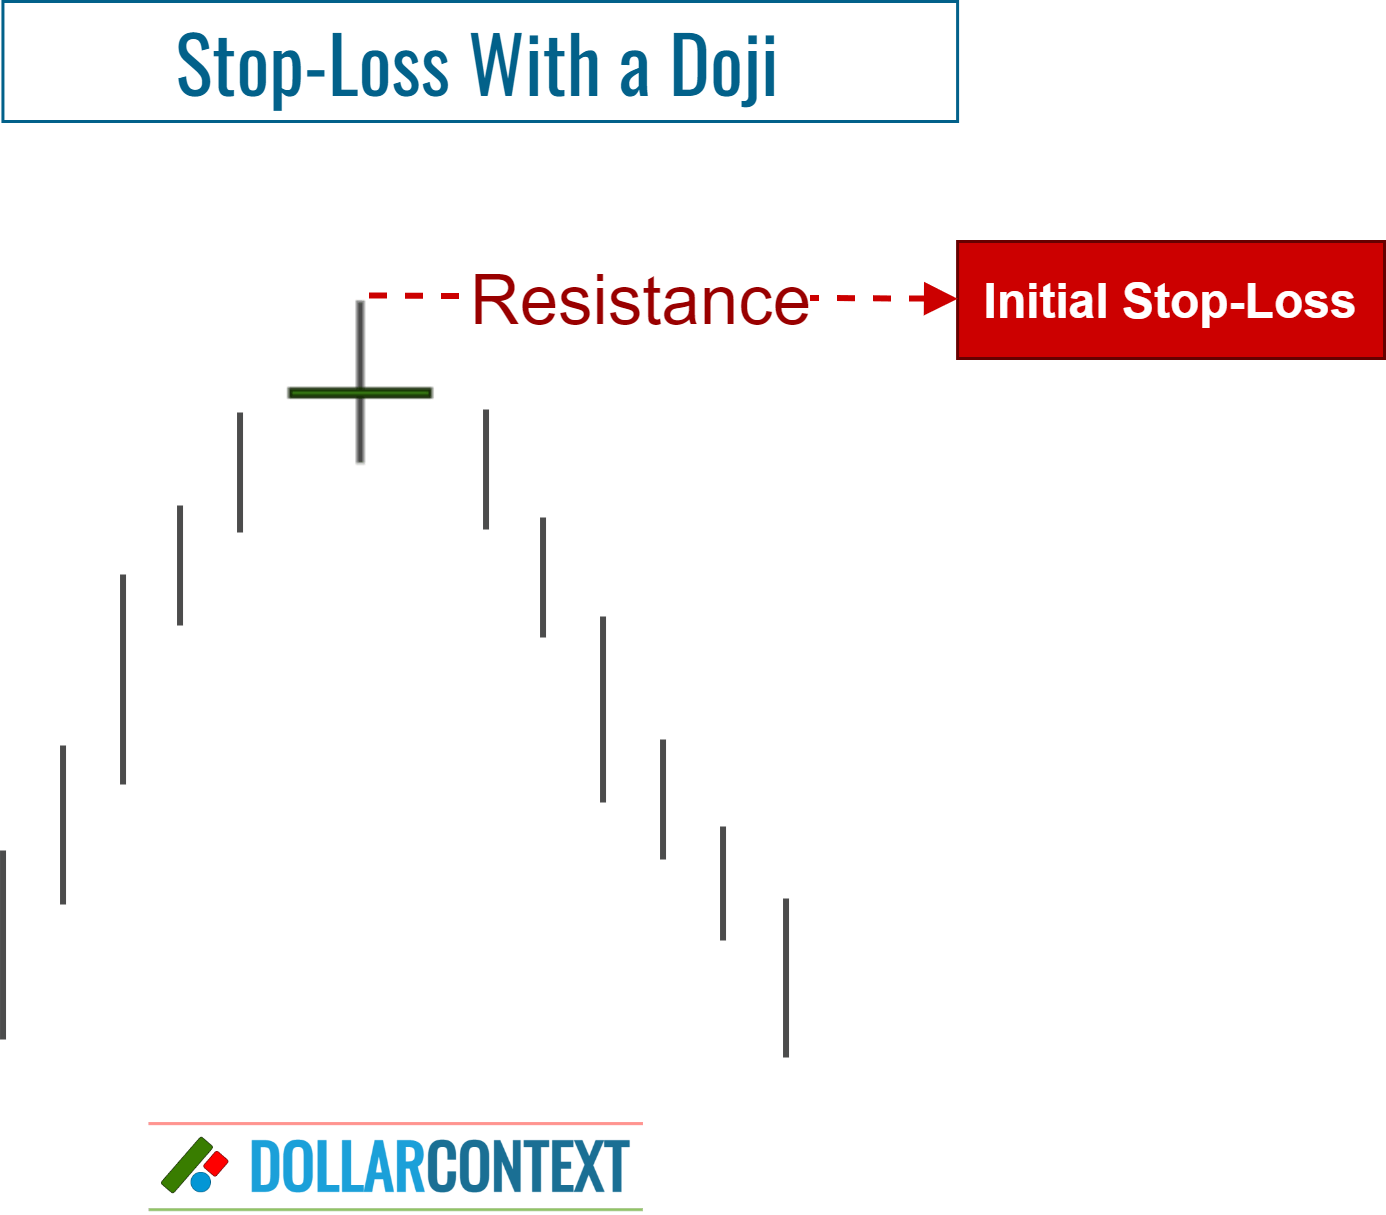
If a doji appears after a mature rally, there's potential for a market reversal. As highlighted below, those who sell based on a doji will find it acting as resistance.
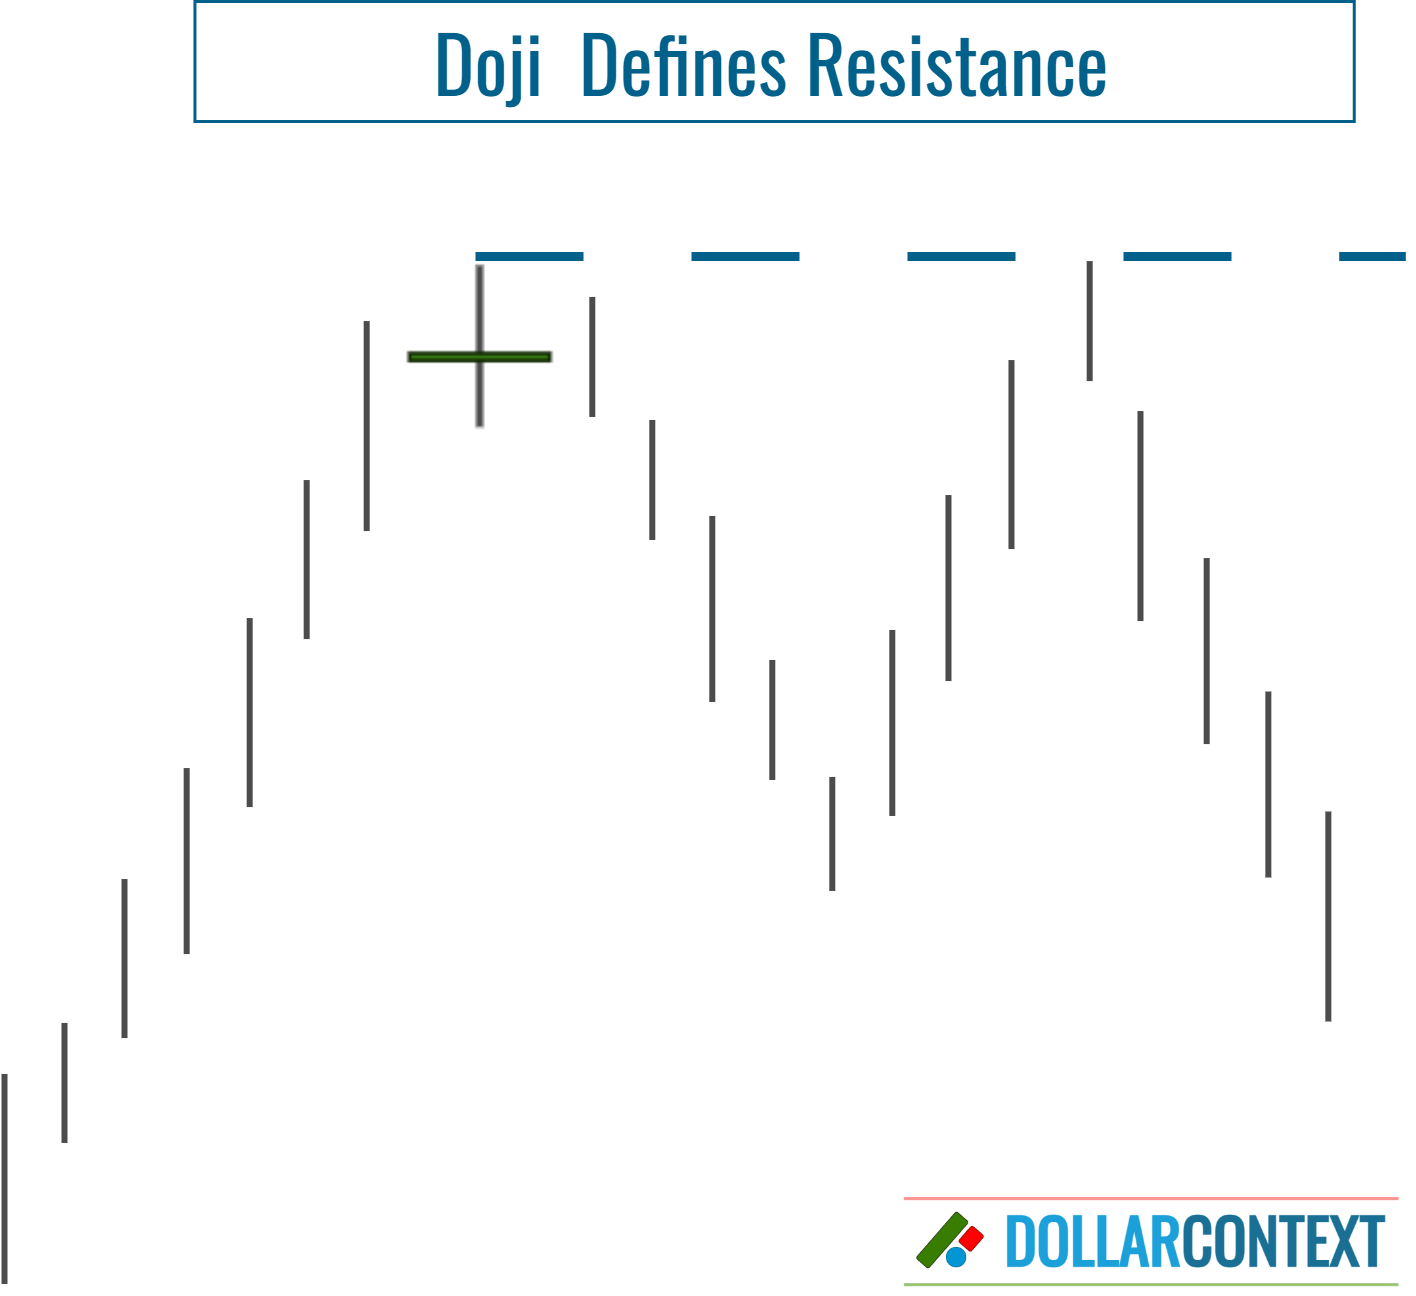
Yet, it's recommended to await bearish confirmation in the following days for a top reversal validation. If the market exceeds the doji's high, it's said to be "refreshed" by the Japanese, and a buy stop should be placed above this high.
If a doji appears amidst an extended or steep upward trend and the market remains strong post-doji, it's a bullish sign. This shows the market has shifted from its transitional state, denoted by the doji, to a rising trend.
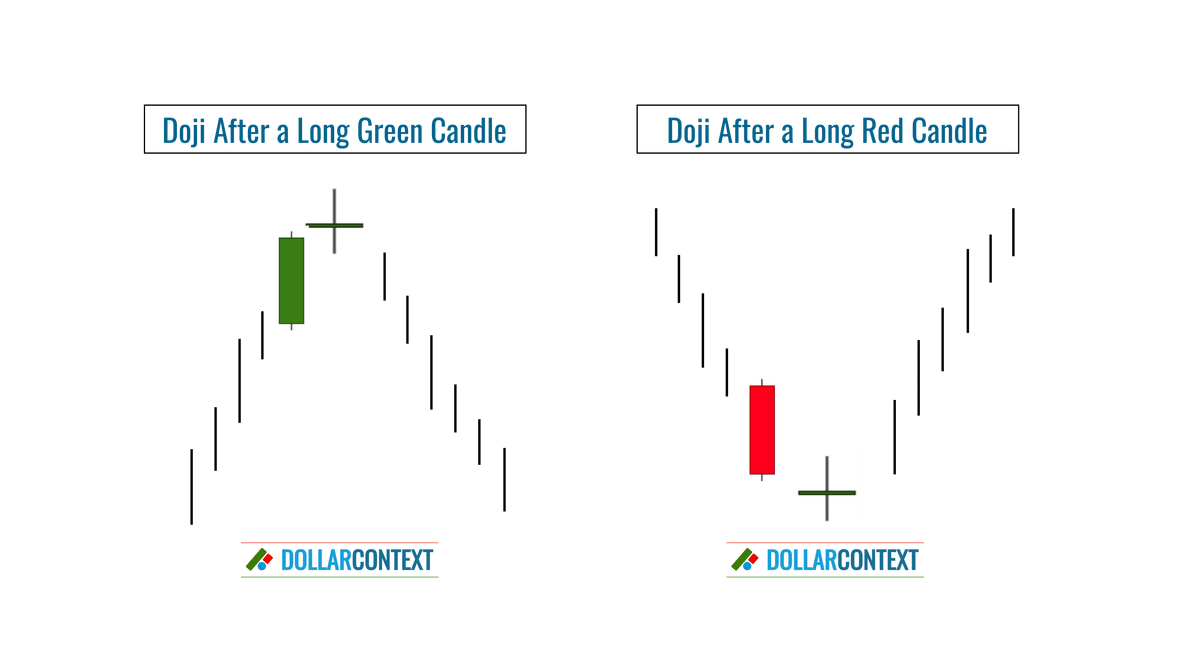
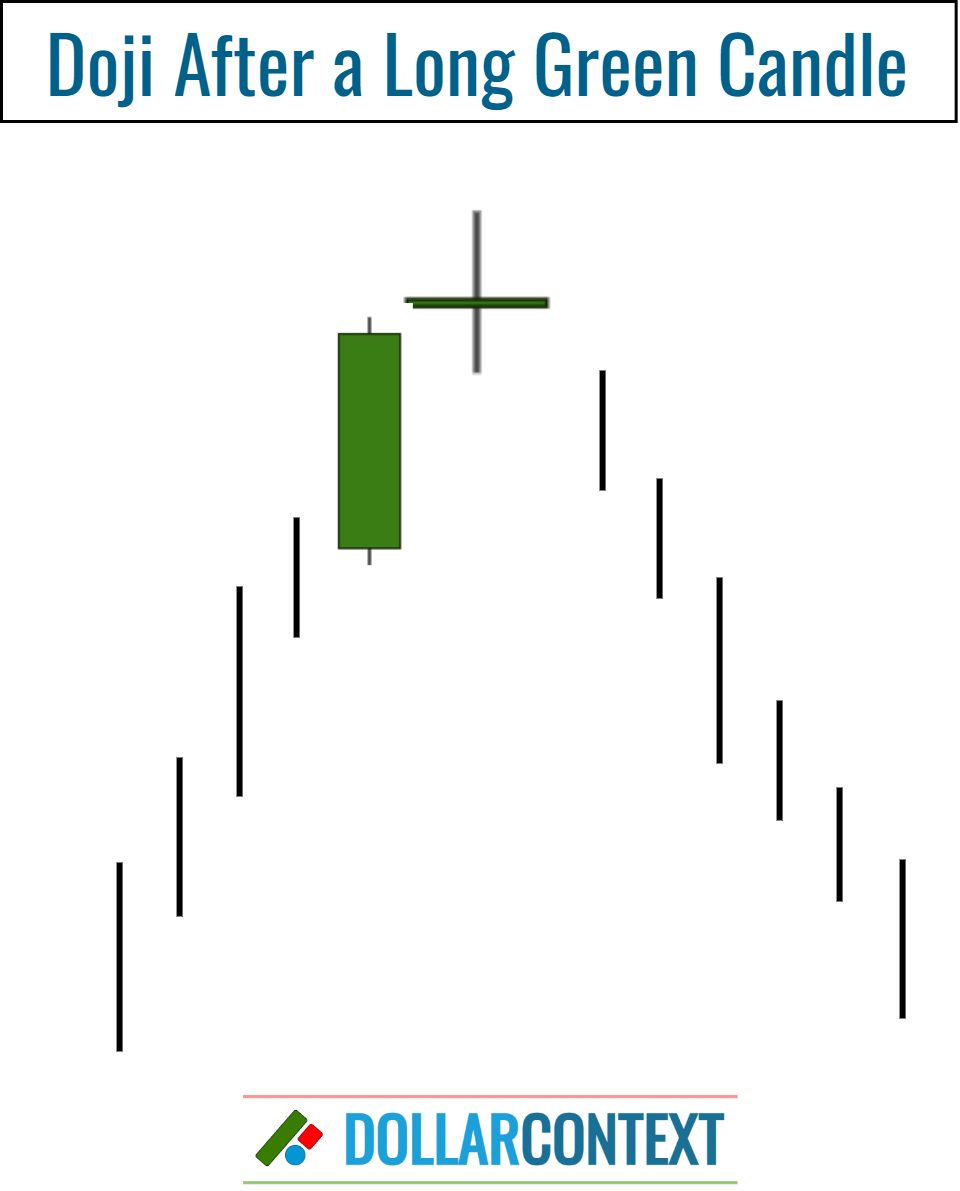
2.2 Doji After a Long White Candle
A doji is notably significant when it arises after a tall white/green candle, which in turn emerges after a prolonged or pronounced uptrend. In such cases, the Japanese consider the market as "tired." However, if this high is surpassed, the market's uptrend may persist.
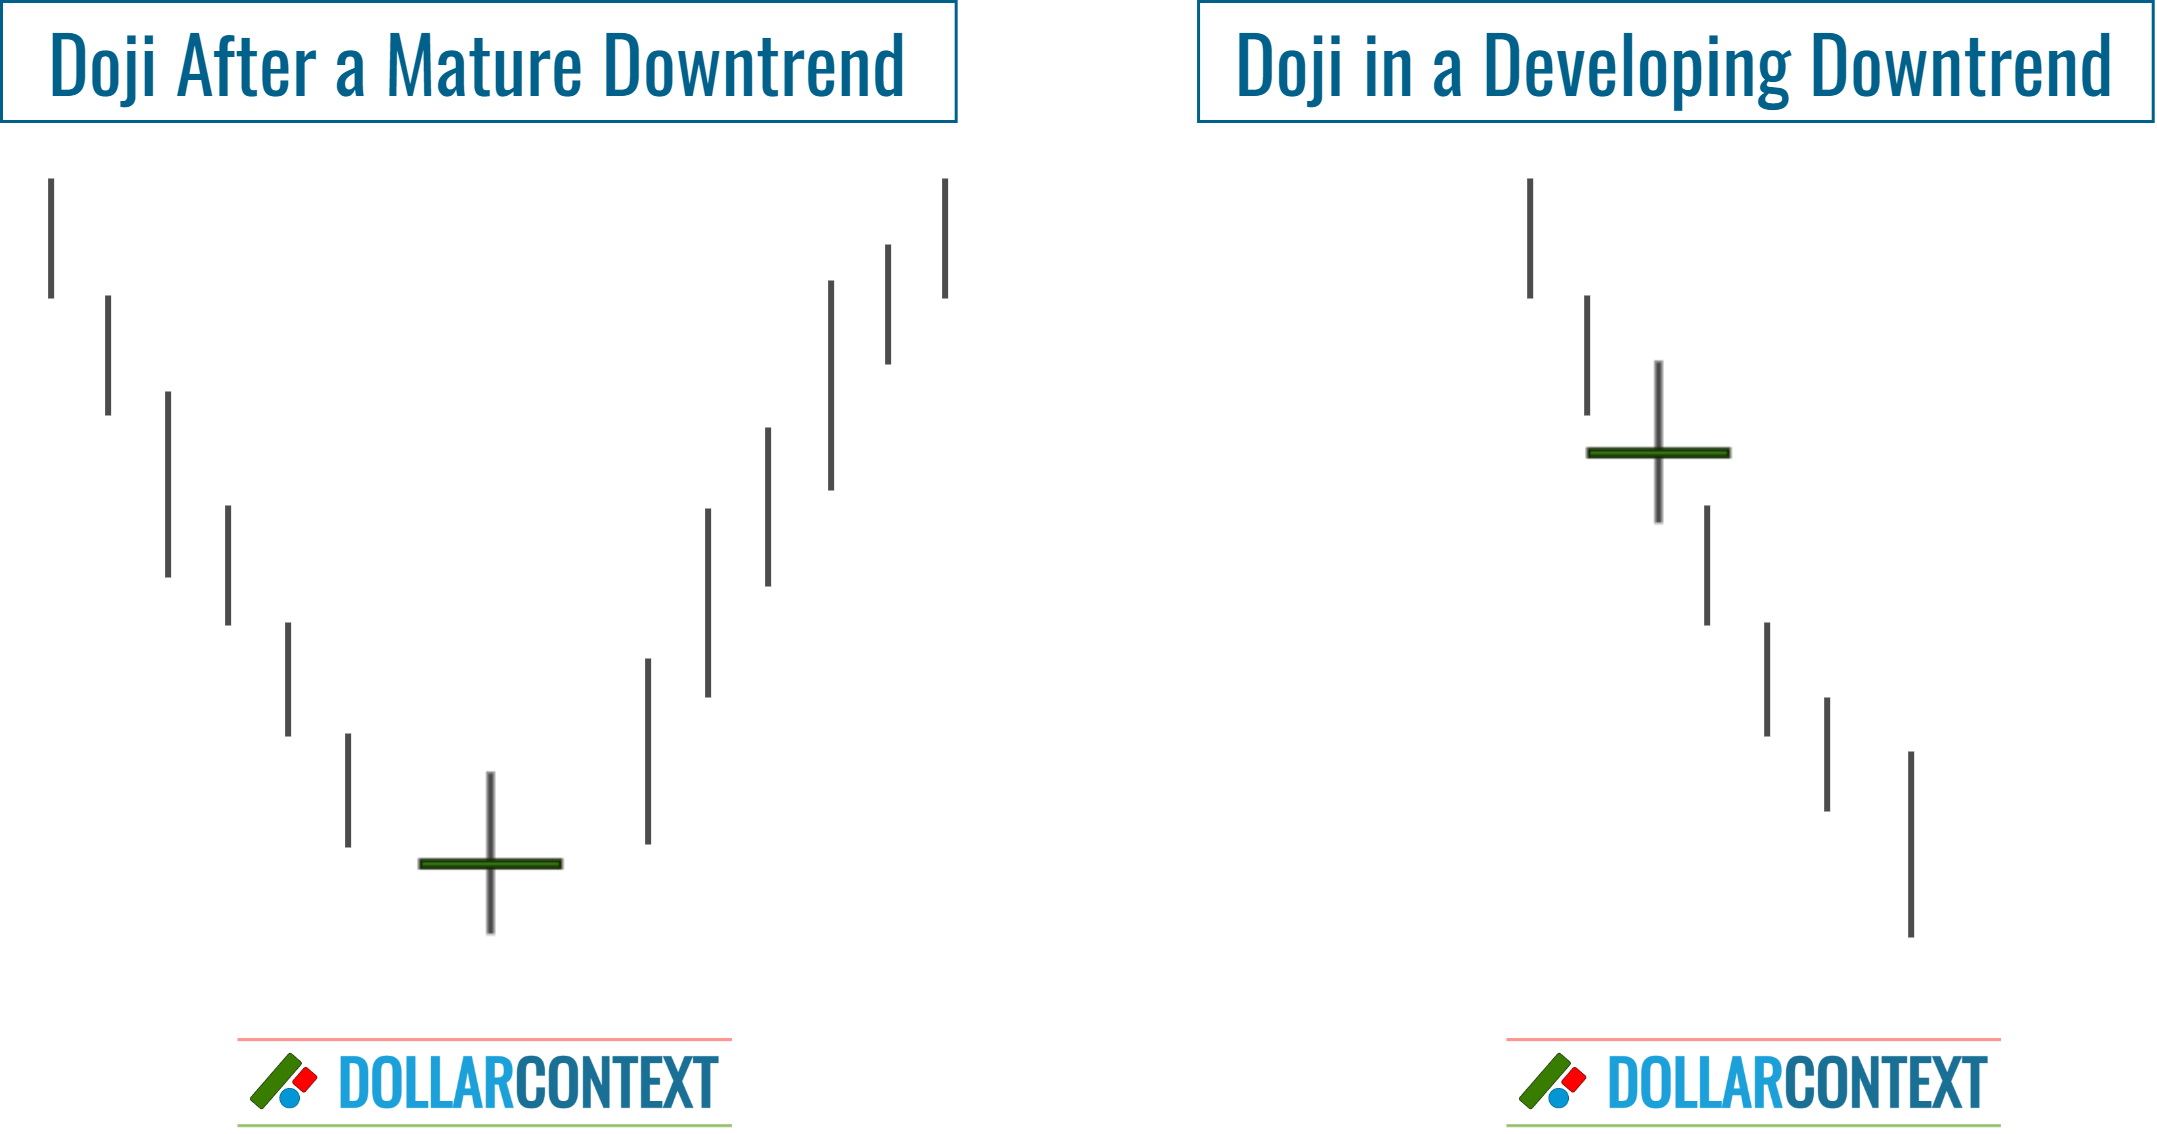
3. Implications of a Doji in a Downtrend
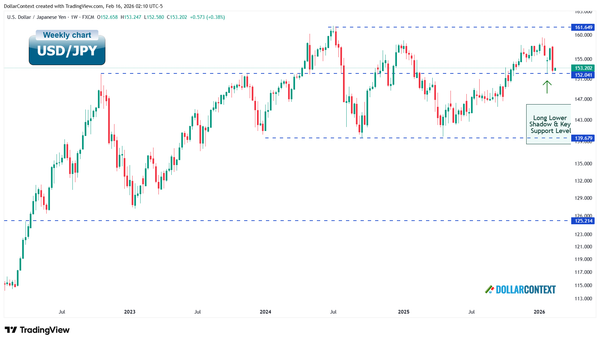
A doji following a steep decline can suggest a market bottom. Still, if the market has only recently started to fall, prices might continue dropping post-doji. The main takeaway from the image below is the increased significance of a doji as a reversal signal, depending on how oversold the market is.
In a declining market, a doji indicates market indecision. A white candle following such a doji signifies a market shift towards bulls. Buying based on a doji in this scenario requires placing a sell stop-loss below the doji's lowest point, which includes the lower shadow, as this context is seen as a bearish continuation signal.
We believe that the guidelines effective for uptrend markets should be inversely applied to downtrends. Some analysts, however, argue that doji candles tend to lose their reversal potential in downtrends and, for this reason, they require additional confirmation. In either case, such verification can be achieved using the methods detailed in the following section to further validate a market reversal.
4. Techniques for Confirming a Near-Doji Candle
How to discern if a near-doji session (where open and close prices are close but not identical) is truly a doji? While the answer to this question is subjective and lacks strict guidelines, there are various methods you can use:
- Previous Bodies: If a series of small real bodies precedes the doji-like session, the importance of the candle-like session could be diminished.
- Doji Occurrence: The doji serves as a distinct marker for potential trend changes. Their significance is heightened in markets where doji candles appear infrequently. If a chart consistently features multiple doji sessions, the appearance of an additional one shouldn't be viewed as a relevant event.
- Market Crossroads: When the market stands at a pivotal point or is deep into a bullish (or bearish) trend, a near-doji candlestick should be taken seriously.
- Subsequent Candlestick Patterns: If other candlestick formations arise either before or after the doji-like session, supporting or strengthening the likelihood of a market shift, then the near-doji session warrants attention as a potential sign of transition.
Learn more about additional methods to validate a near-doji candle.