Using the Doji to Identify Support or Resistance
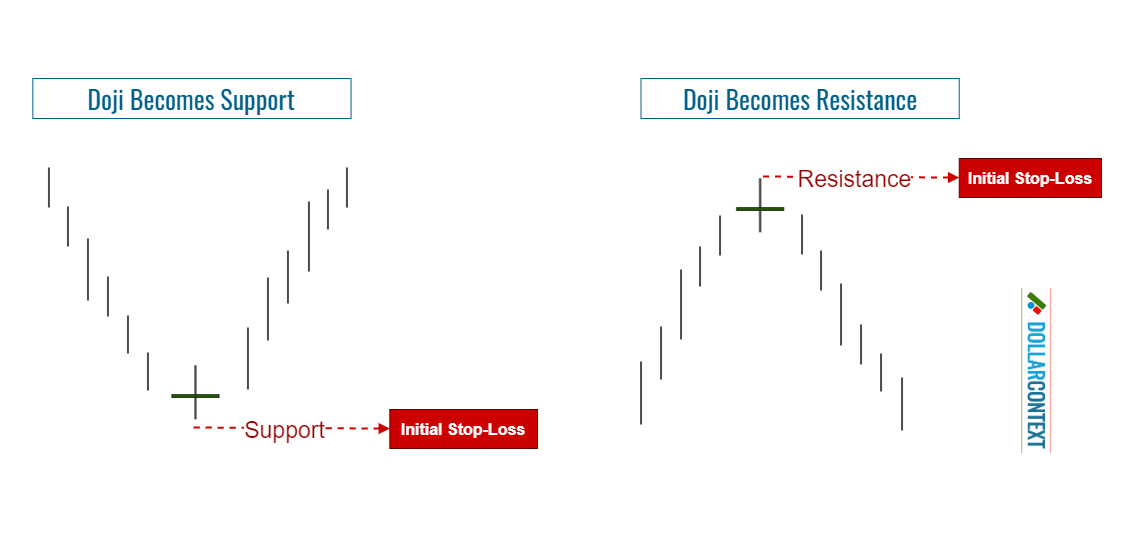
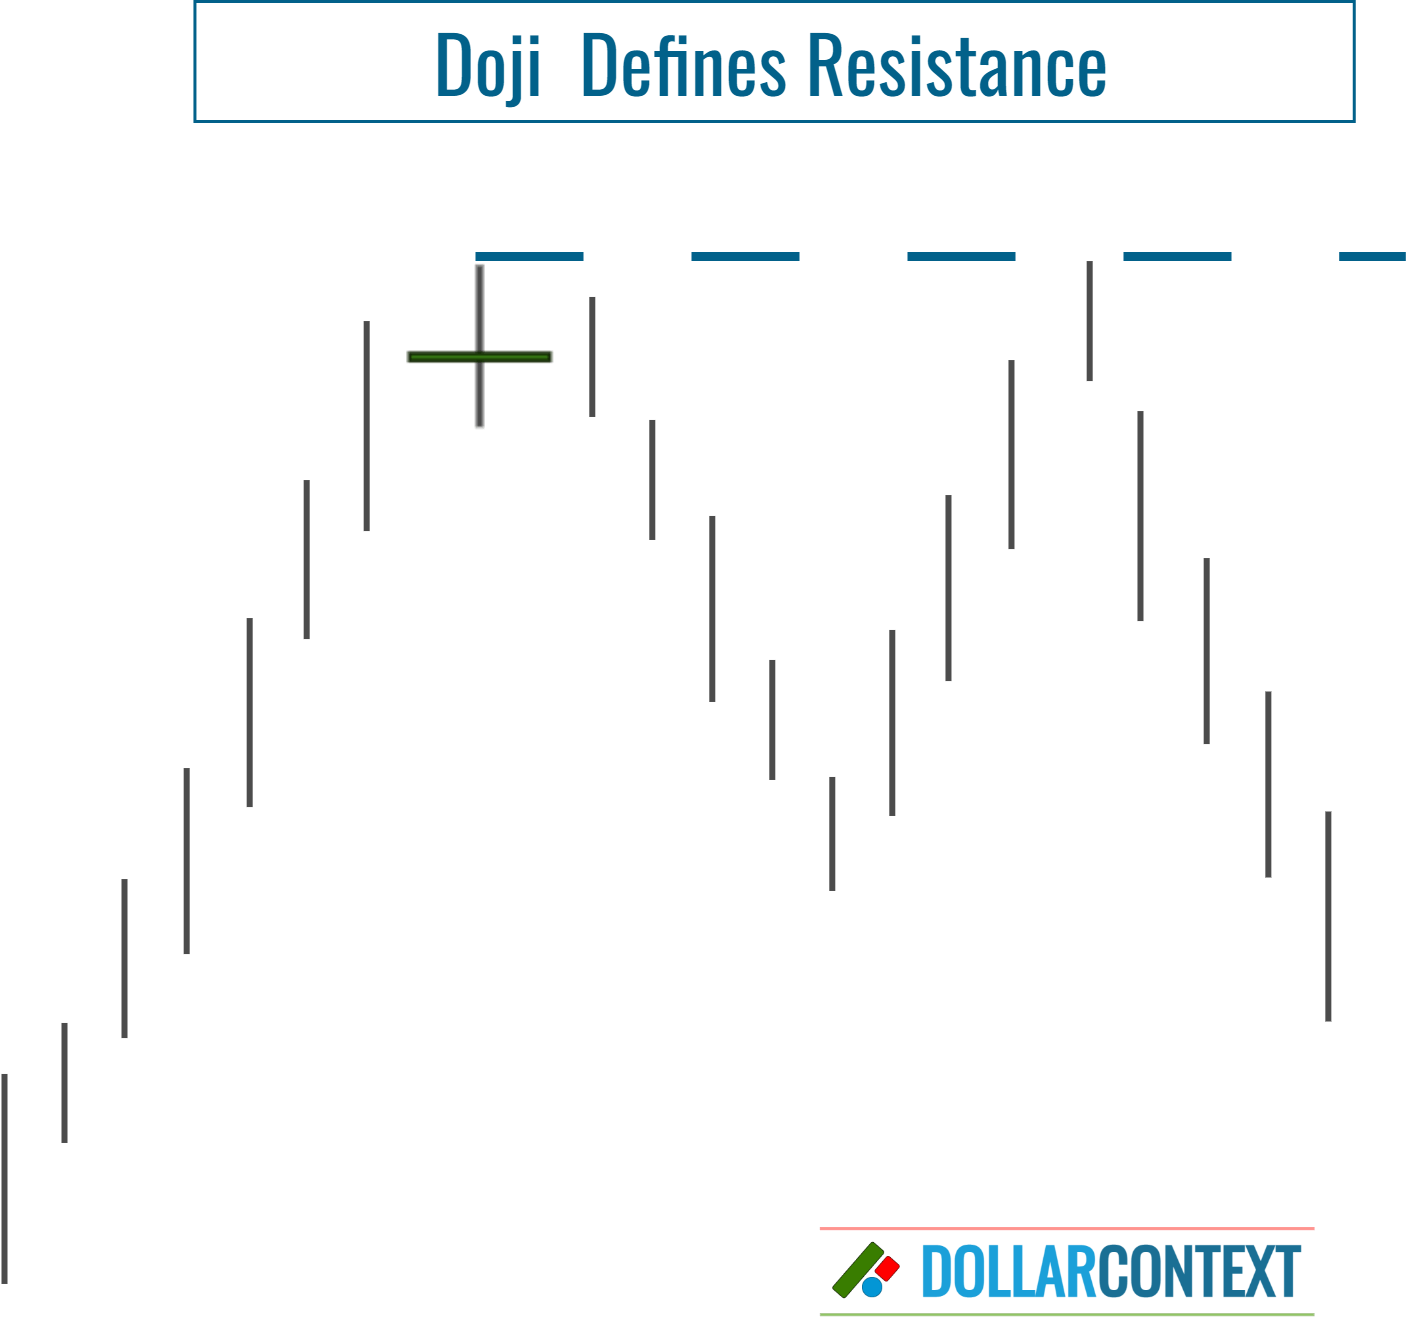
After an uptrend, the price range associated with a doji candle typically evolves into a resistance area. The same works in reverse.
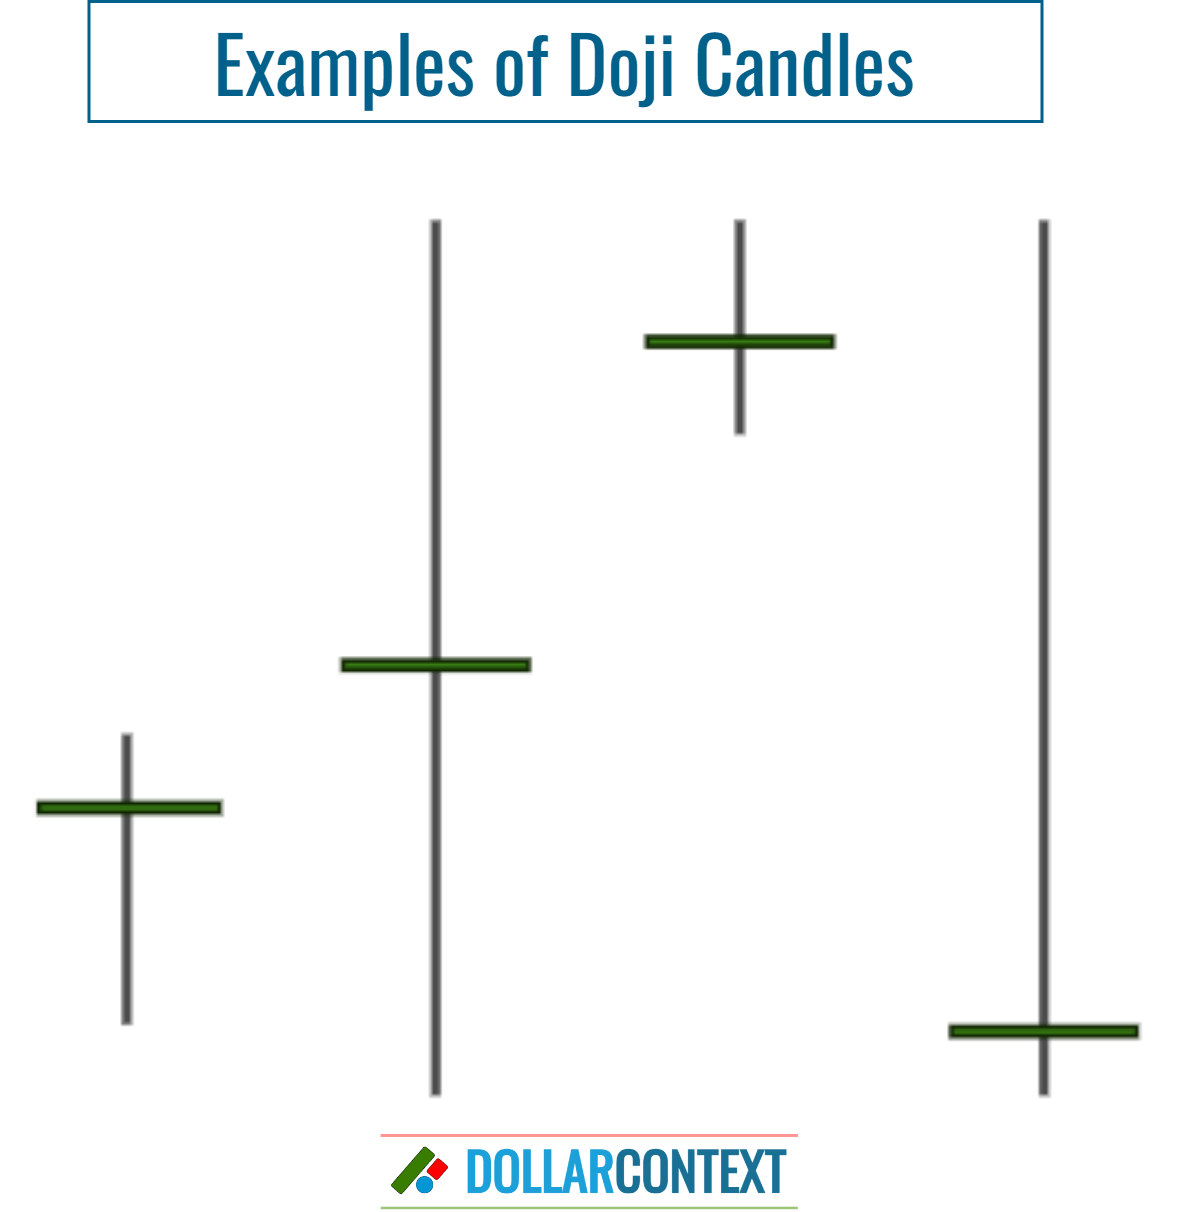
In candlestick analysis, a doji represents market indecision or equilibrium between buyers and sellers. This candle line is characterized by a small body, which means the opening and closing prices are nearly equal. Traders interpret the doji as a signal that the market's sentiment may be shifting, potentially signaling a reversal or a period of consolidation.
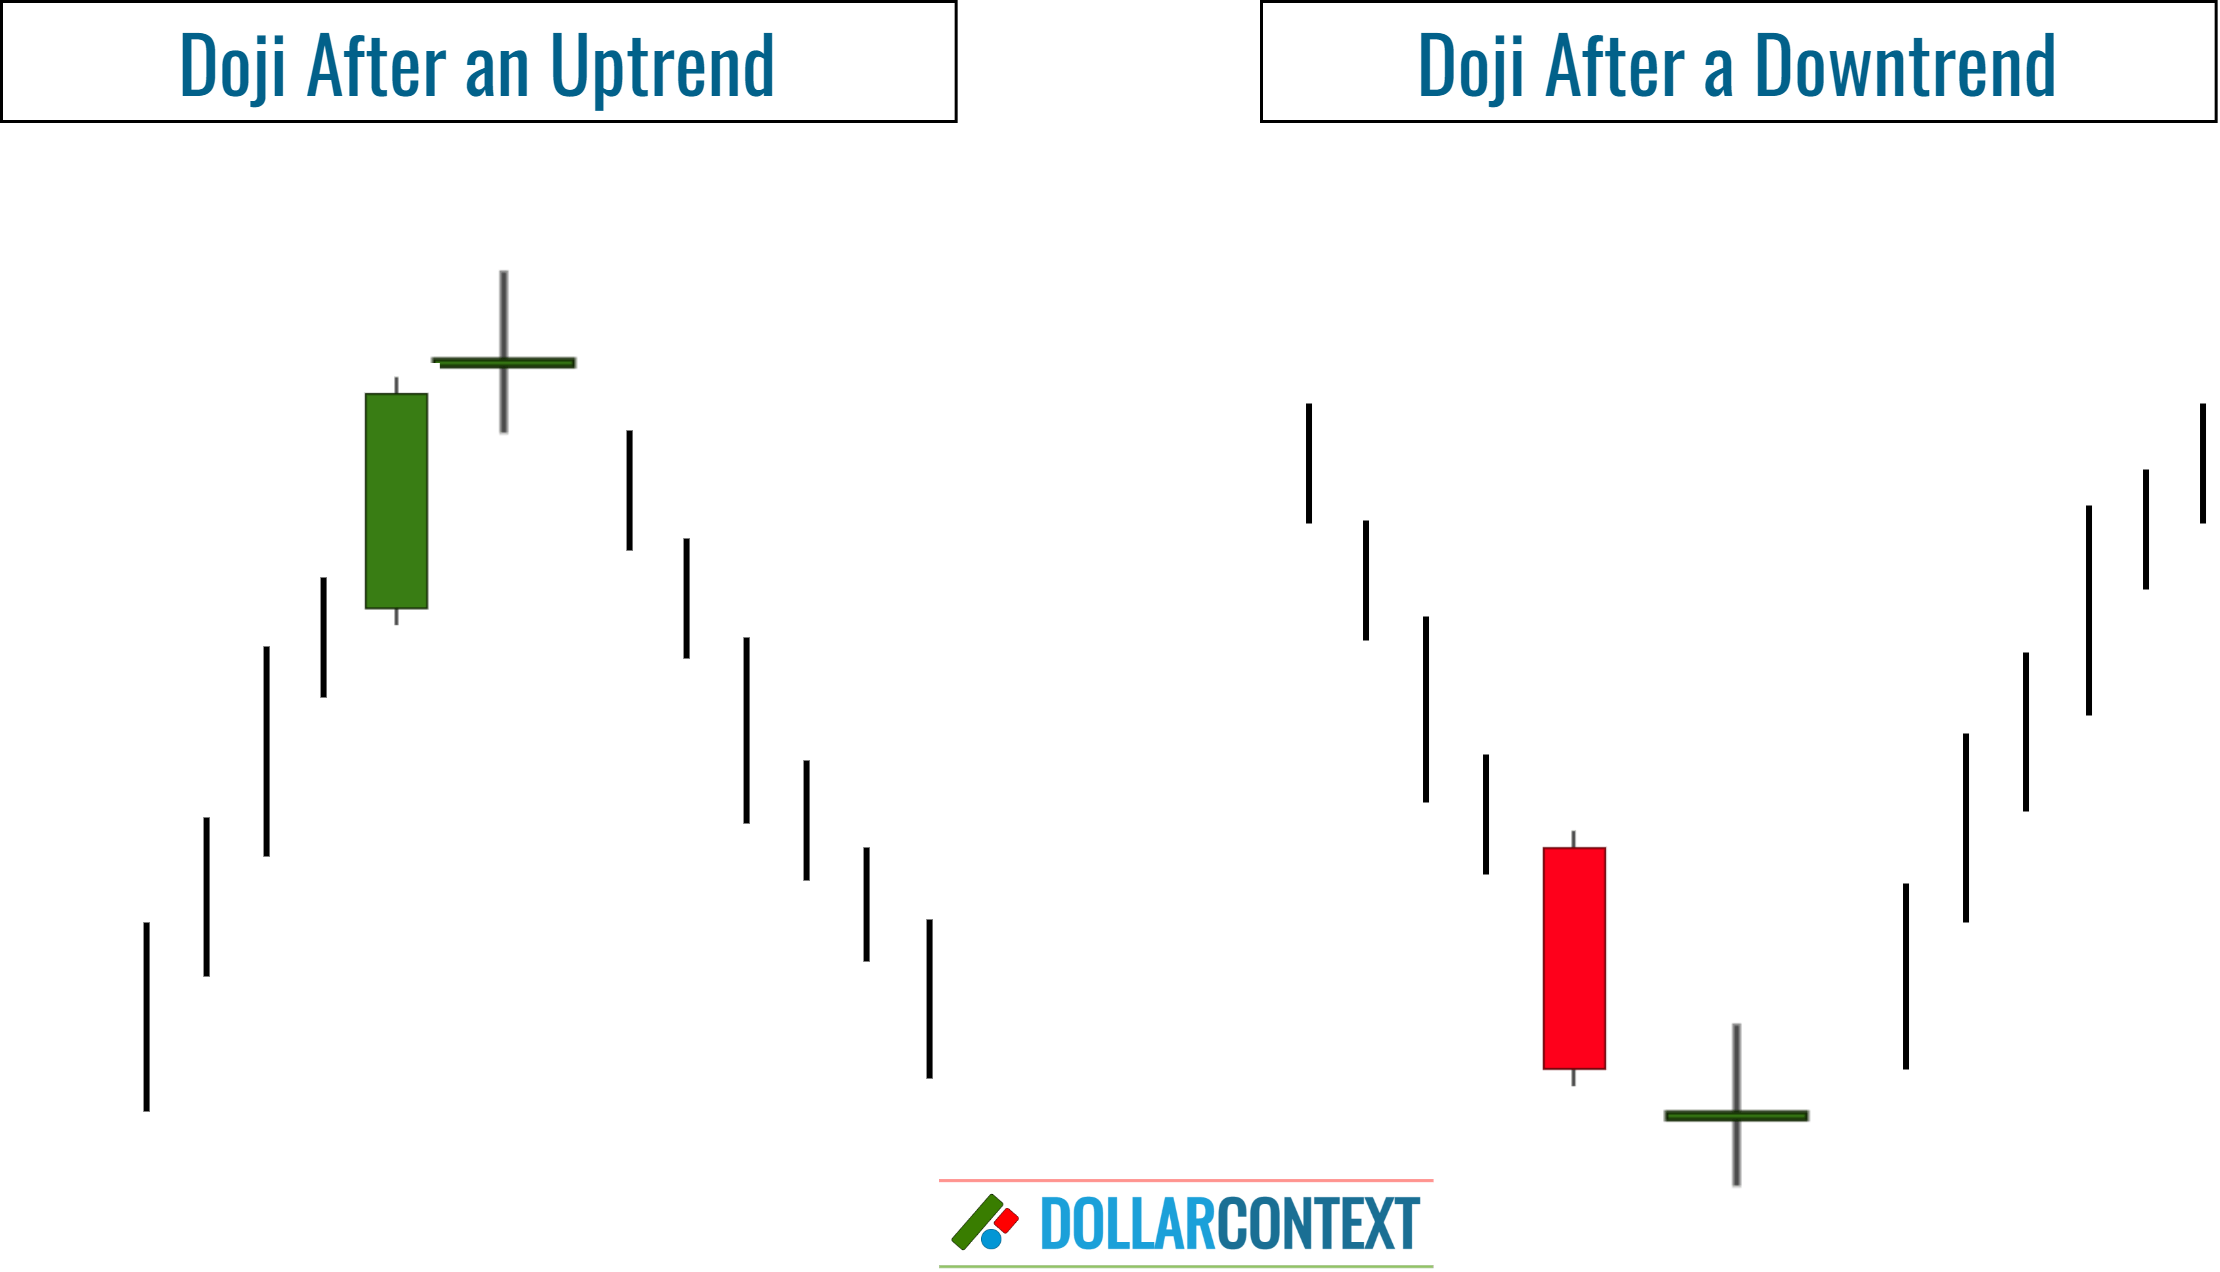
After an uptrend, the price range associated with a doji candle typically evolves into a resistance area. The same thing works in reverse. After a downtrend, the price range linked to a doji candle usually transforms into a support zone.
Within this context, we can identify two different scenarios:
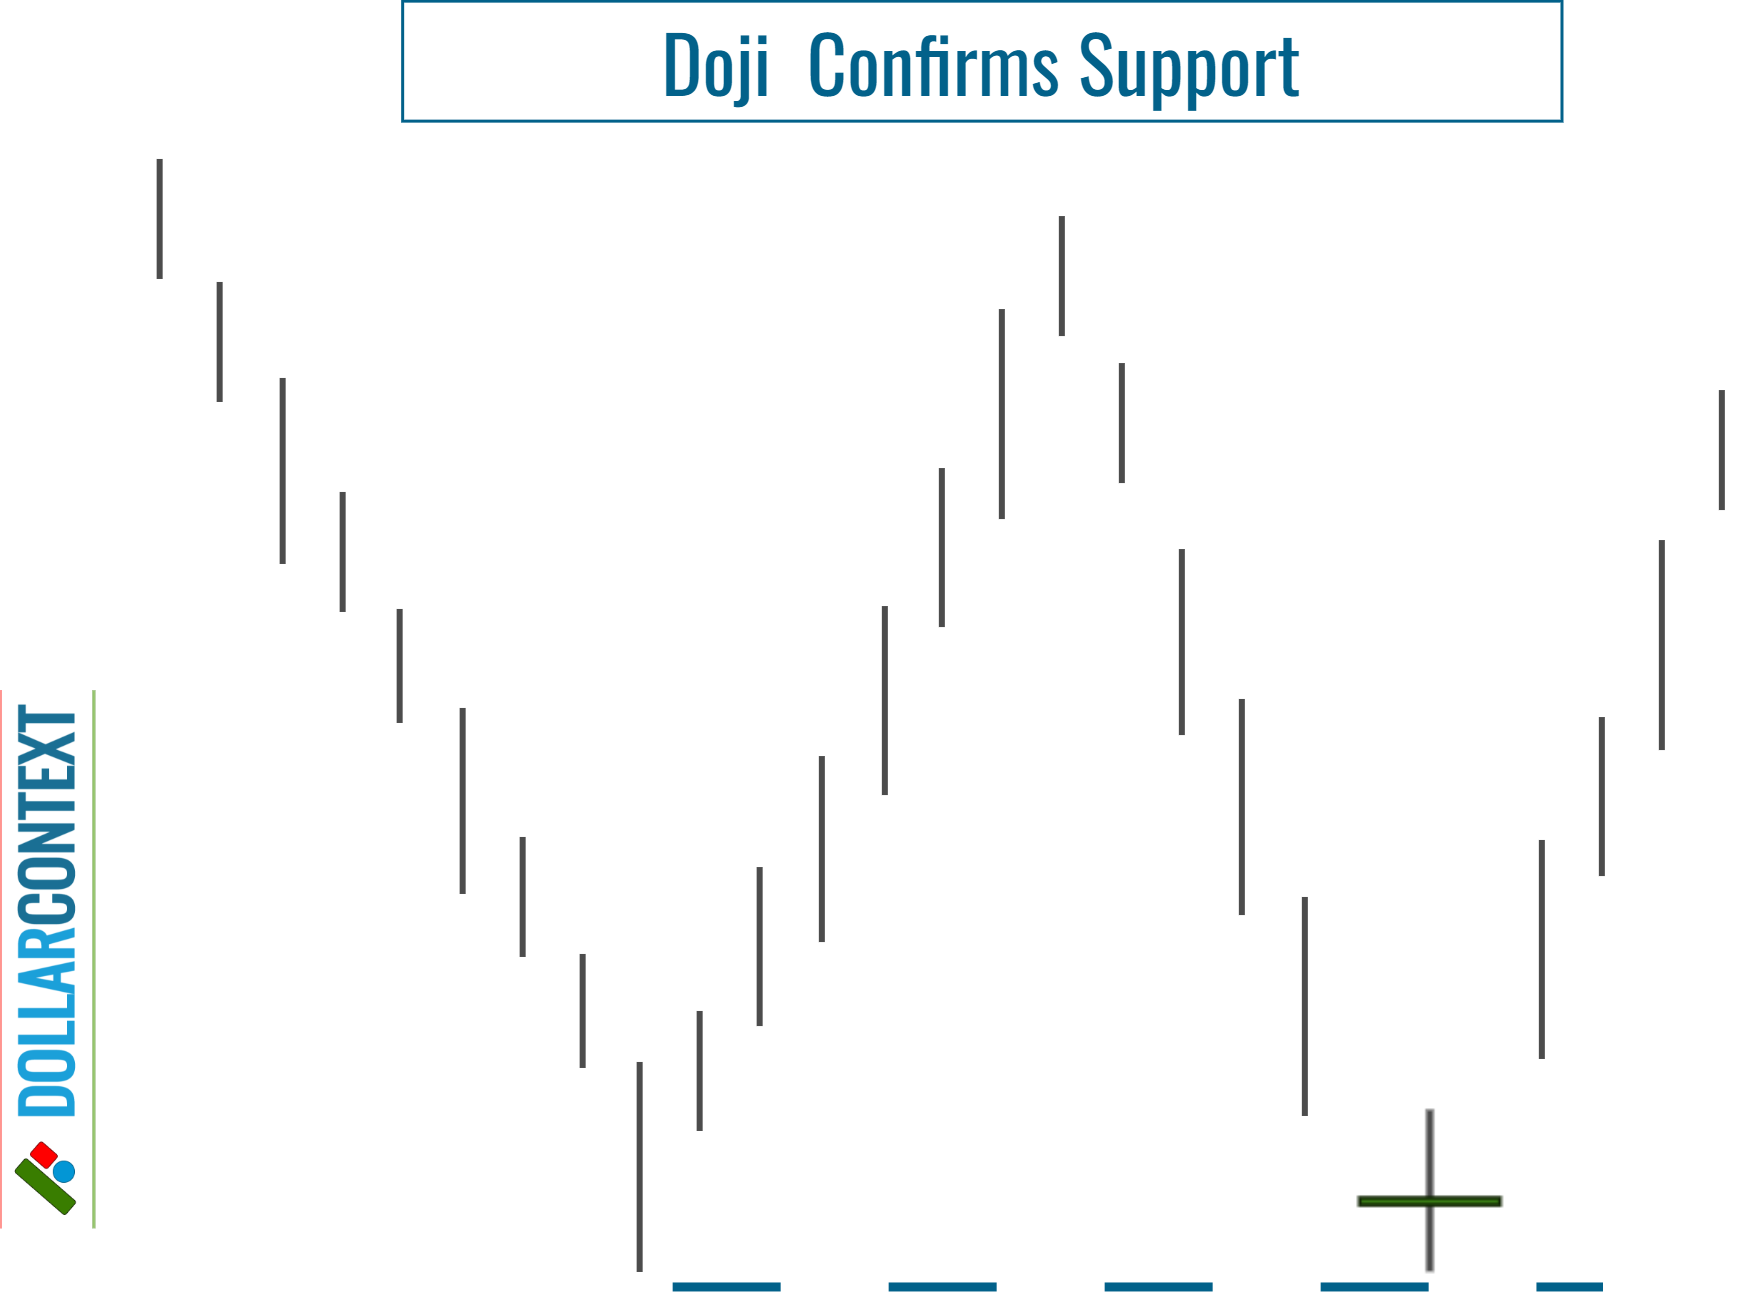
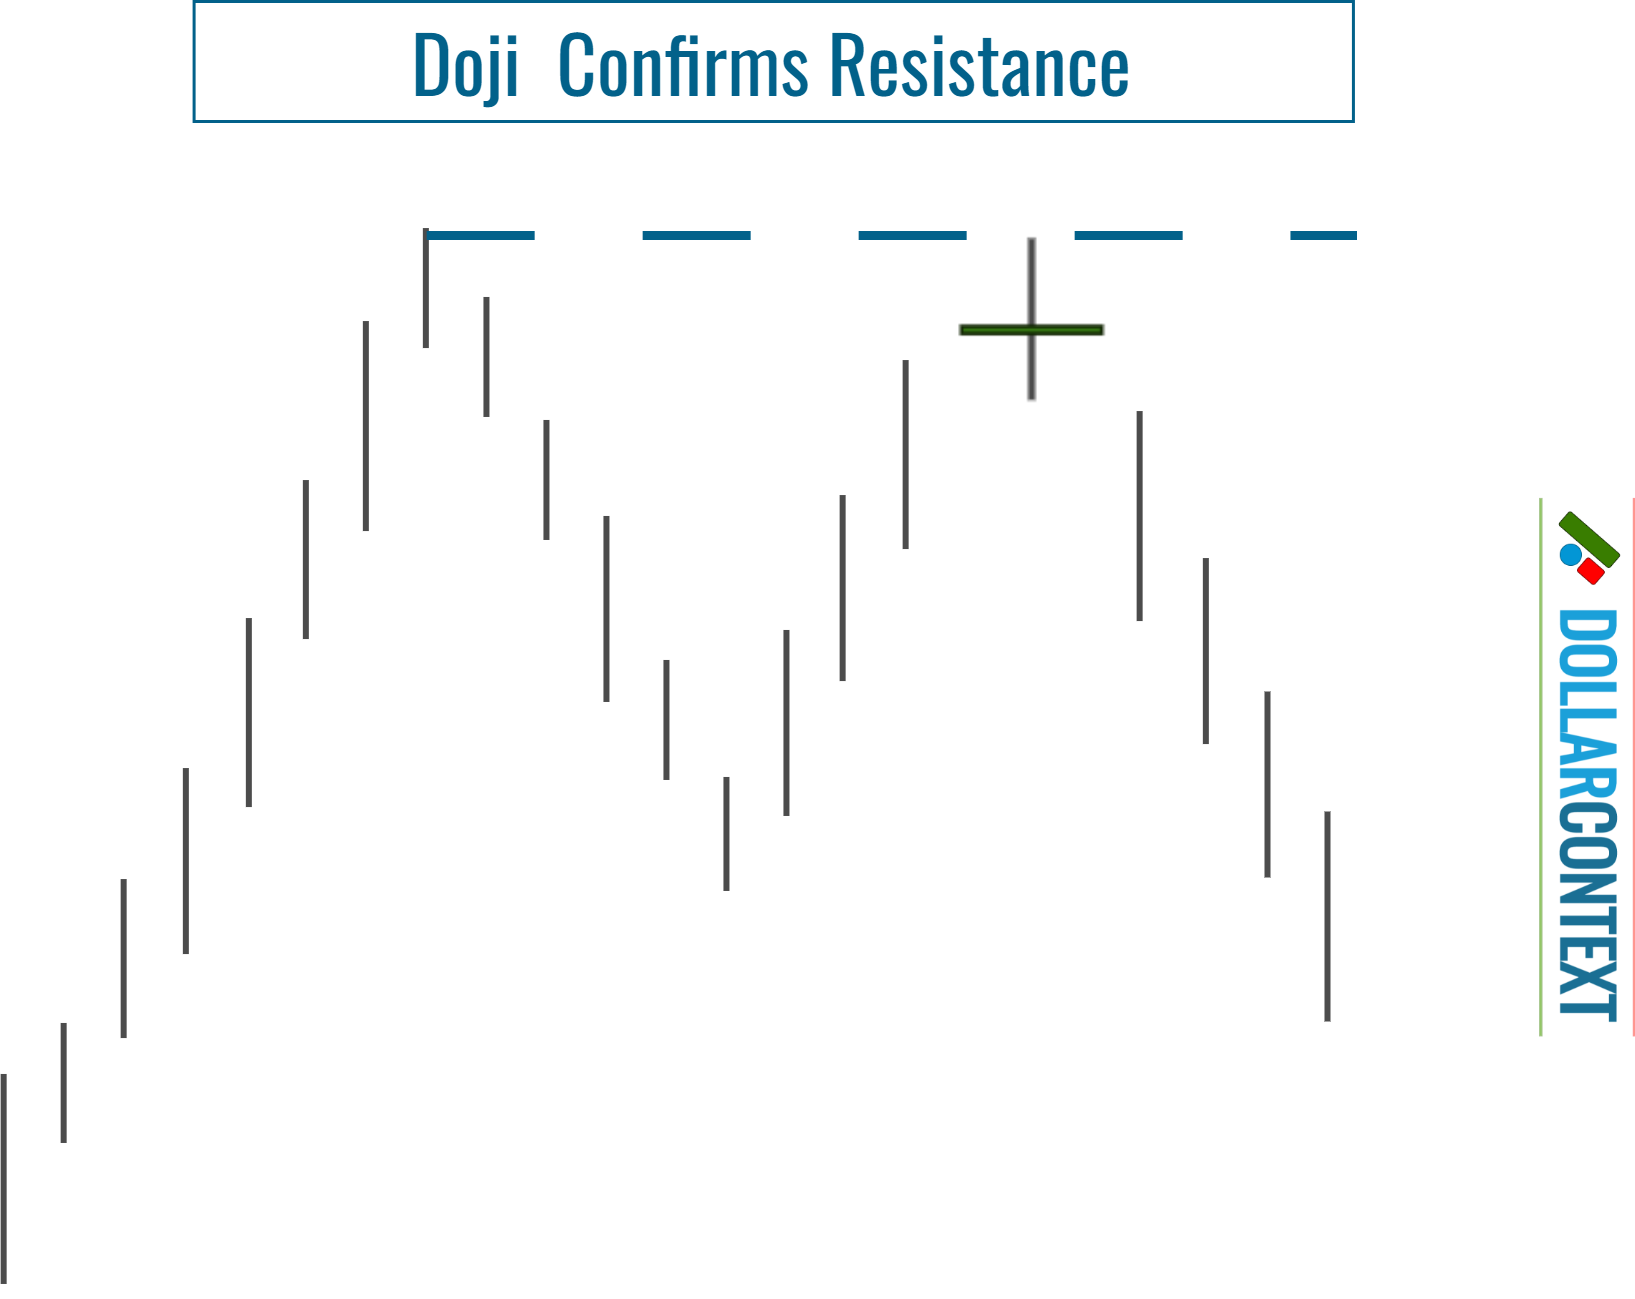
- If a doji arises within a previously established support/resistance area, the doji confirms or validates this support or resistance.
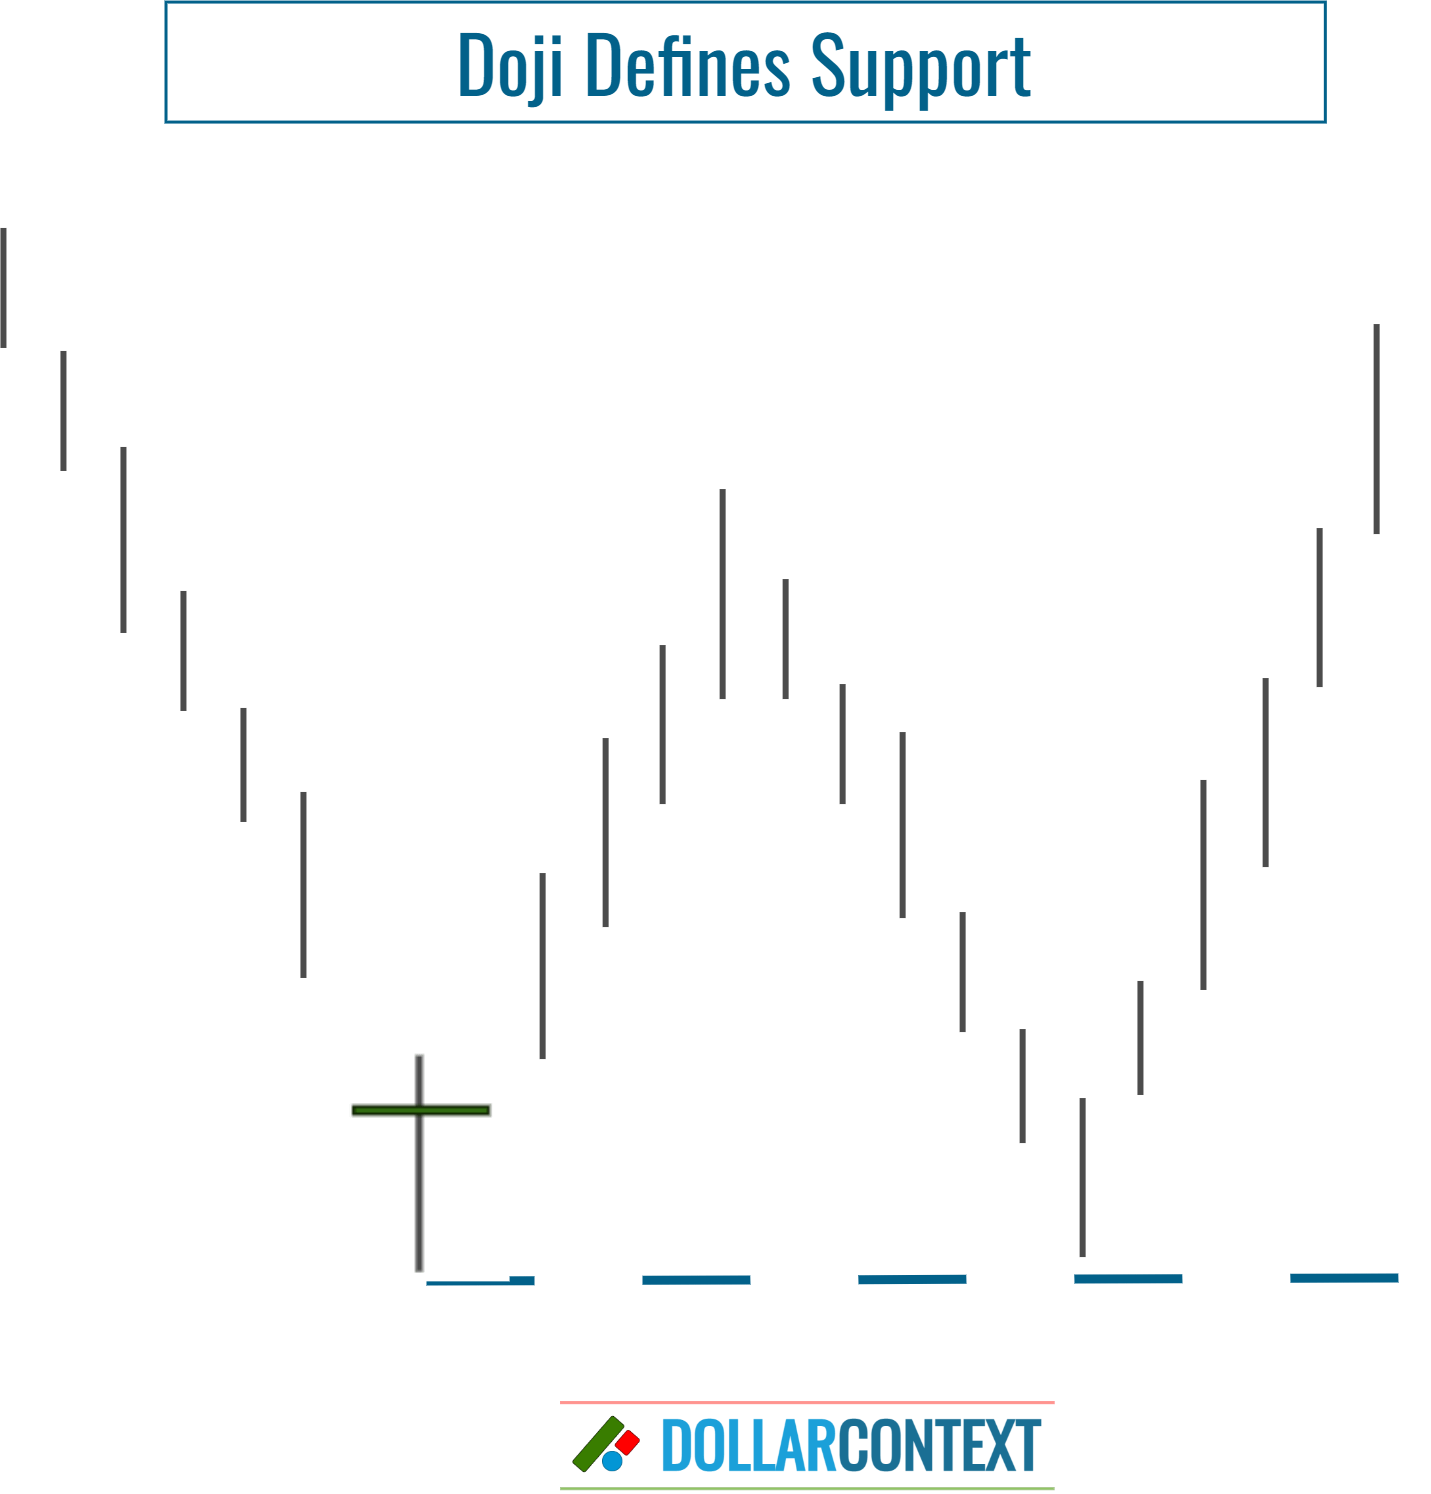
- If a doji emerges at a new low or at a new high, it defines a new support or resistance area.
1. Doji Strengthens Support or Resistance
When a doji candle materializes within a previously established support zone, it bolsters the credibility of that support level, increasing the likelihood of a bullish trend reversal.
Similarly, if the doji surfaces within a pre-established resistance area, it reinforces the resistance zone.
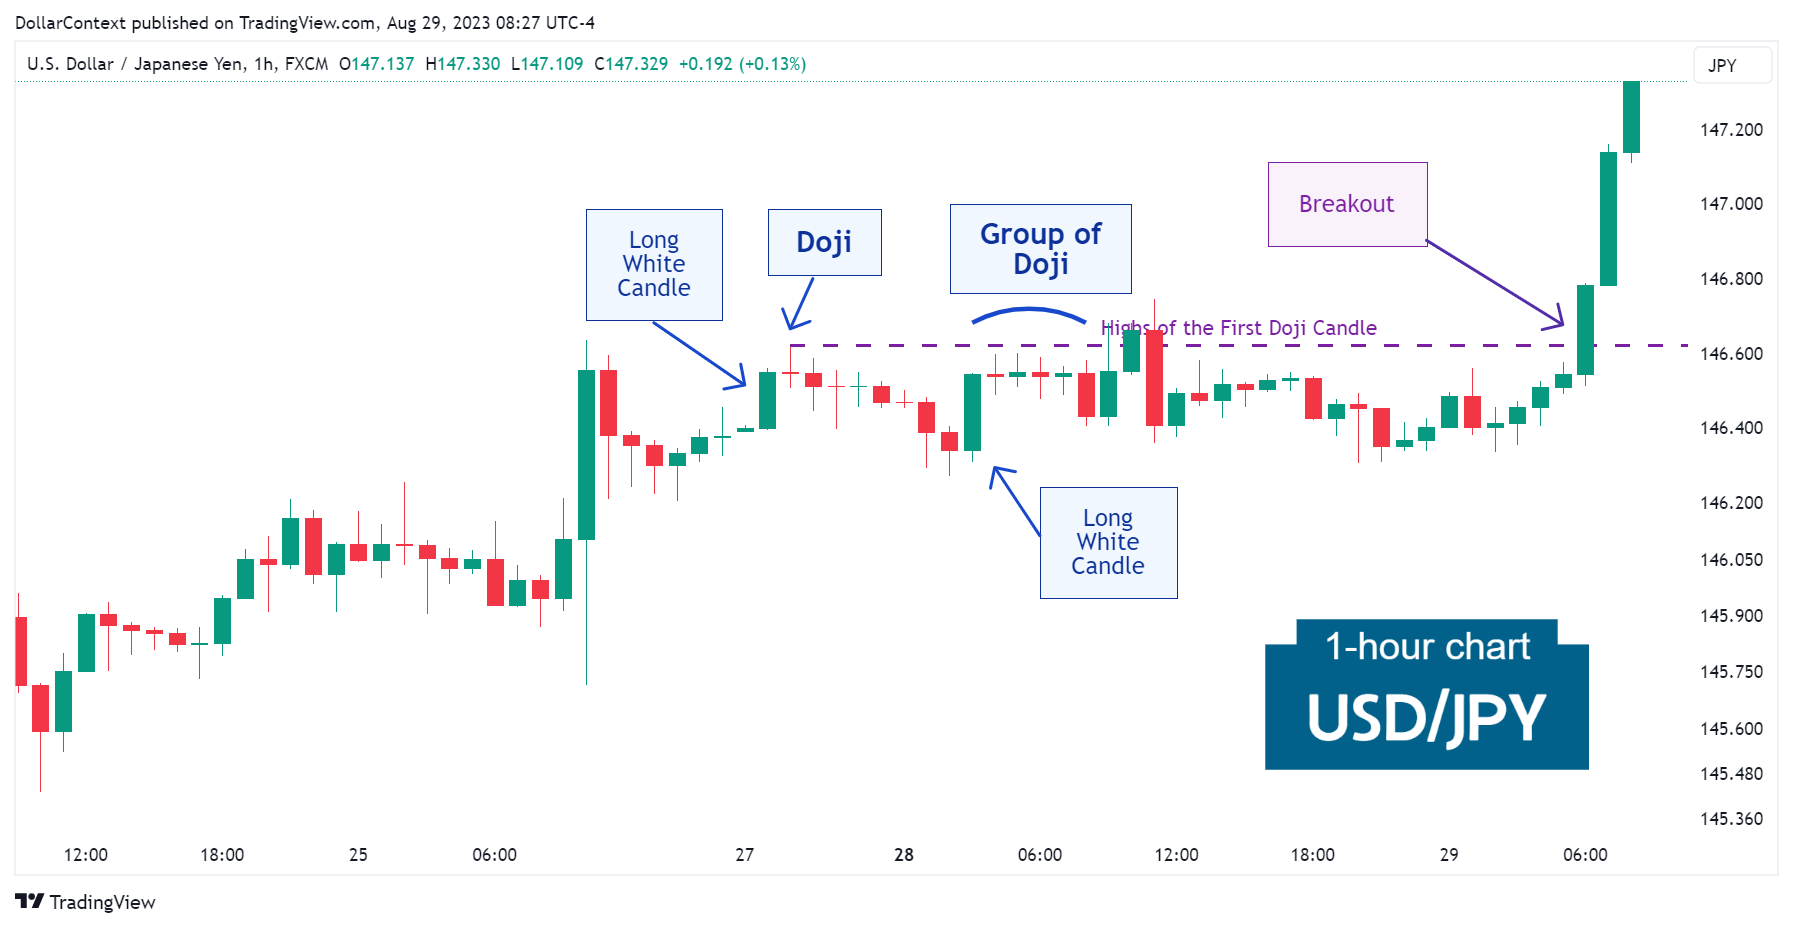
The following example illustrates the validation of a previous resistance level in the USD/JPY market—with the appearance of a doji candlestick near that zone. In this particular case, instead of anticipating an outright reversal, the doji signaled an extended lateral range before confirming a subsequent breakout.
2. Doji Defines New Support or Resistance
When a doji candle creates a new low, it sets a fresh support zone that may undergo future testing.
This principle also holds true in the opposite direction. After creating a new high, the doji defines a new resistance area, which might be tested in the future.
3. Breakout of the Support/Resistance Area
When using a doji to open a position, it's crucial to establish a defined price at which you should reevaluate your initial plan. This level can be used as the initial stop-loss of a doji strategy.
If a session closes clearly below the support or above the resistance level set by the doji, the market will probably continue its previous trend. Nevertheless, as elaborated in the subsequent section, this is not always the case.
4. False Breakouts
When a support level is breached, many traders see it as a possible signal suggesting the price might continue in the direction of the breakout. Yet, markets can occasionally defy these predictions. Instead of maintaining the momentum, they might revert, returning to the previous range. This is often termed as a "false breakout". The same logic holds when a resistance level is surpassed.
To reduce the risk of getting stopped out by a false breakout, consider the following guidelines:
- Base your stop-loss on the session's closing price rather than relying on intra-session price fluctuations.
- Think about adding a cushion to your initial stop-loss level.
- When additional bullish candlestick patterns reinforce the support area set by the doji, the likelihood for a breakout to be successful diminishes significantly. The same principle holds when additional bearish candlestick patterns emerge within the vicinity of the resistance area established by a doji candle.
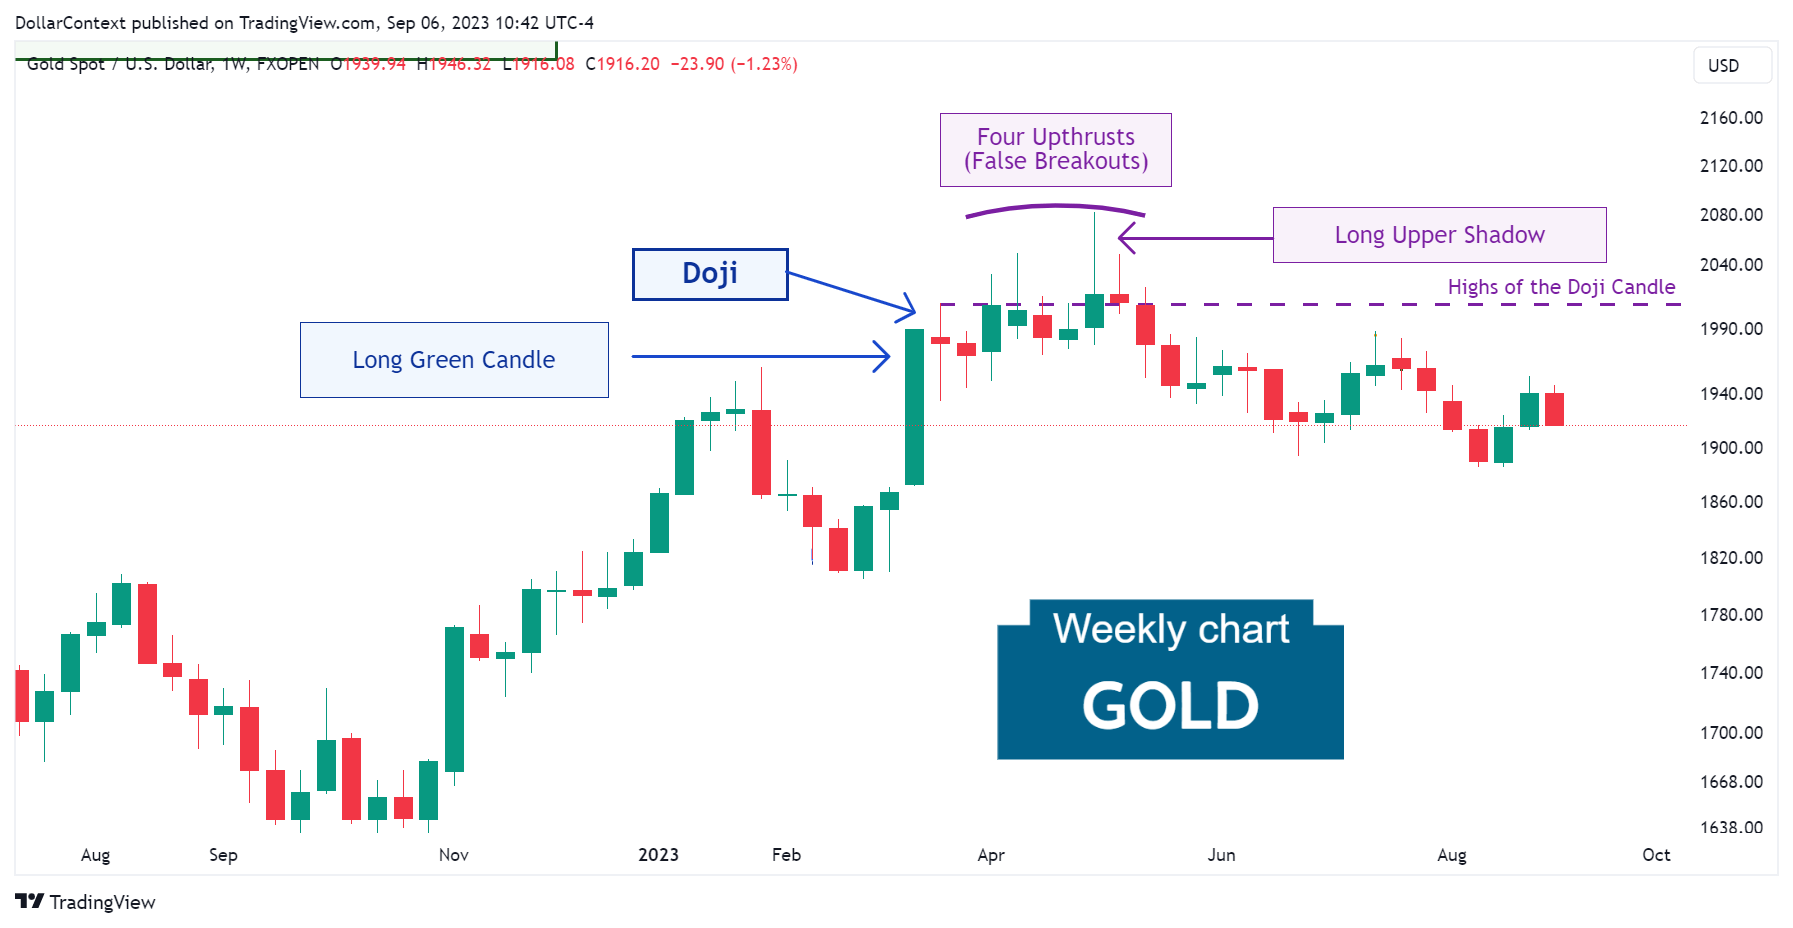
For example, in March 2023, the gold market displayed a doji session after a long bullish candle. Observe how the resistance level set by the doji was challenged on multiple occasions with false breakouts to the upside, also known as upthrusts.
