
Engulfing Pattern: Similarities and Differences With Other Candlestick Patterns
The configuration of an engulfing pattern has resemblances to other candlestick patterns, including the hammer, shooting star, and harami.

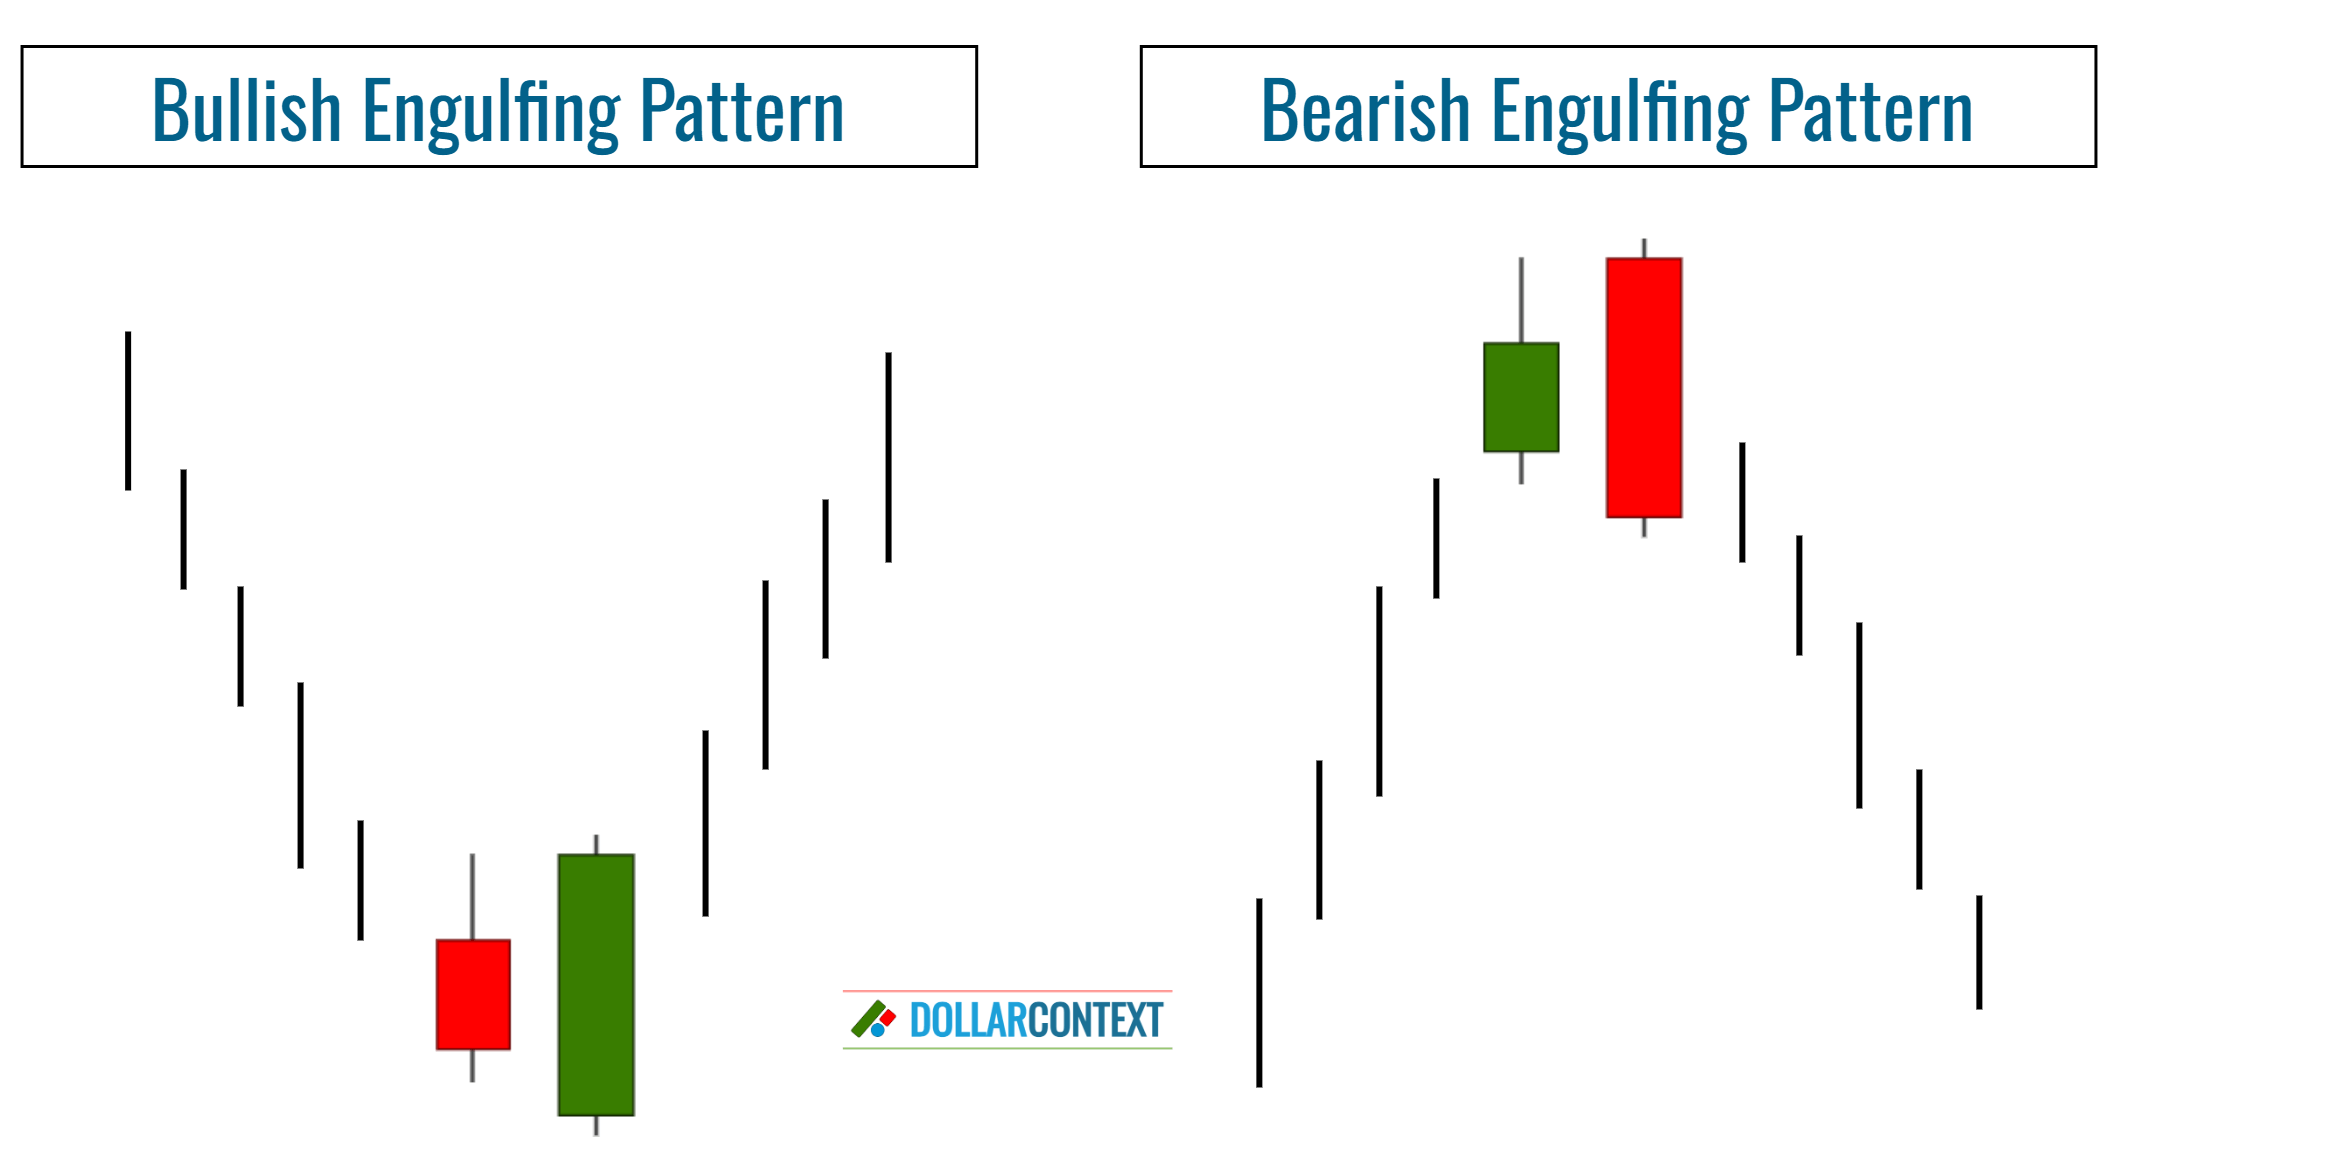
In the world of candlestick analysis, the engulfing pattern is one of the most recognizable and frequently utilized formations. The engulfing pattern consists of a pair of candles that hint at an impending market reversal. There are two main types of this pattern:
- Bullish Engulfing Pattern: Initiated by a short red (or black) candle, it is succeeded by a long green (or white) candle that entirely "swallows" the preceding red candle, suggesting a likely upward movement in price.
- Bearish Engulfing Pattern: Commences with a short green (or white) candle. This is followed by a long red (or black) candle that engulfs the prior green candle, pointing to a potential downward shift in price.
Differences and Similarities with Other Patterns
The structure of an engulfing pattern shares similarities with several other candlestick formations, namely:
- Hammer
- Shooting Star
- Harami
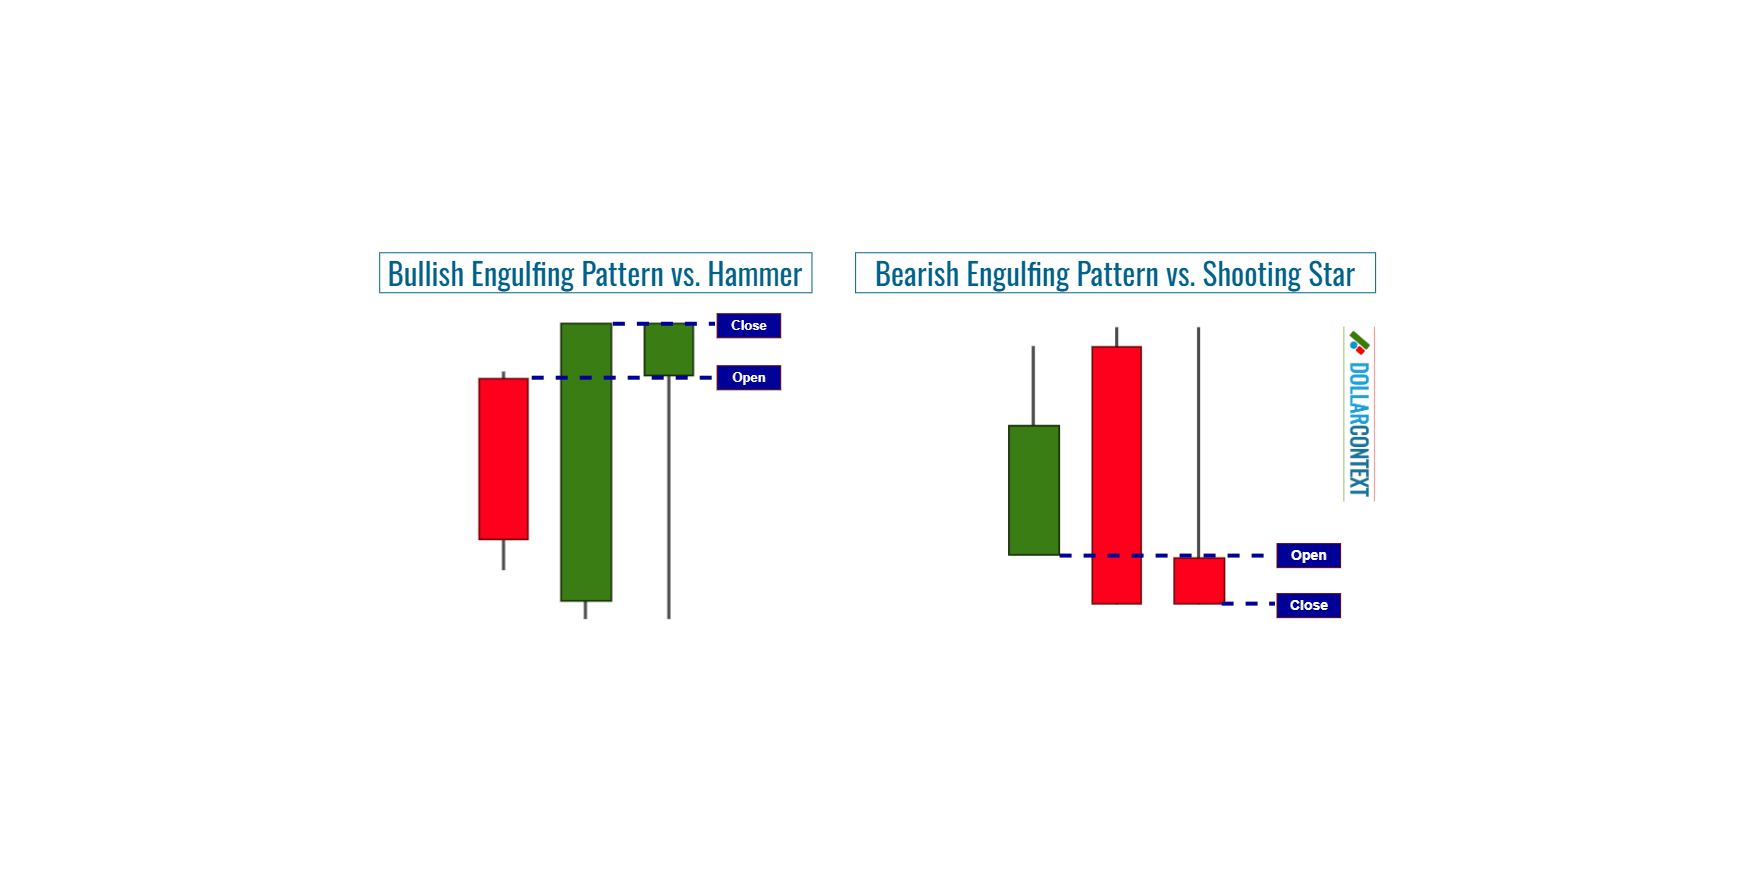
1. Bullish Engulfing Pattern vs. Hammer
When the two candles that constitute a bullish engulfing pattern are combined, they usually, but not always, form a shape resembling a hammer pattern.
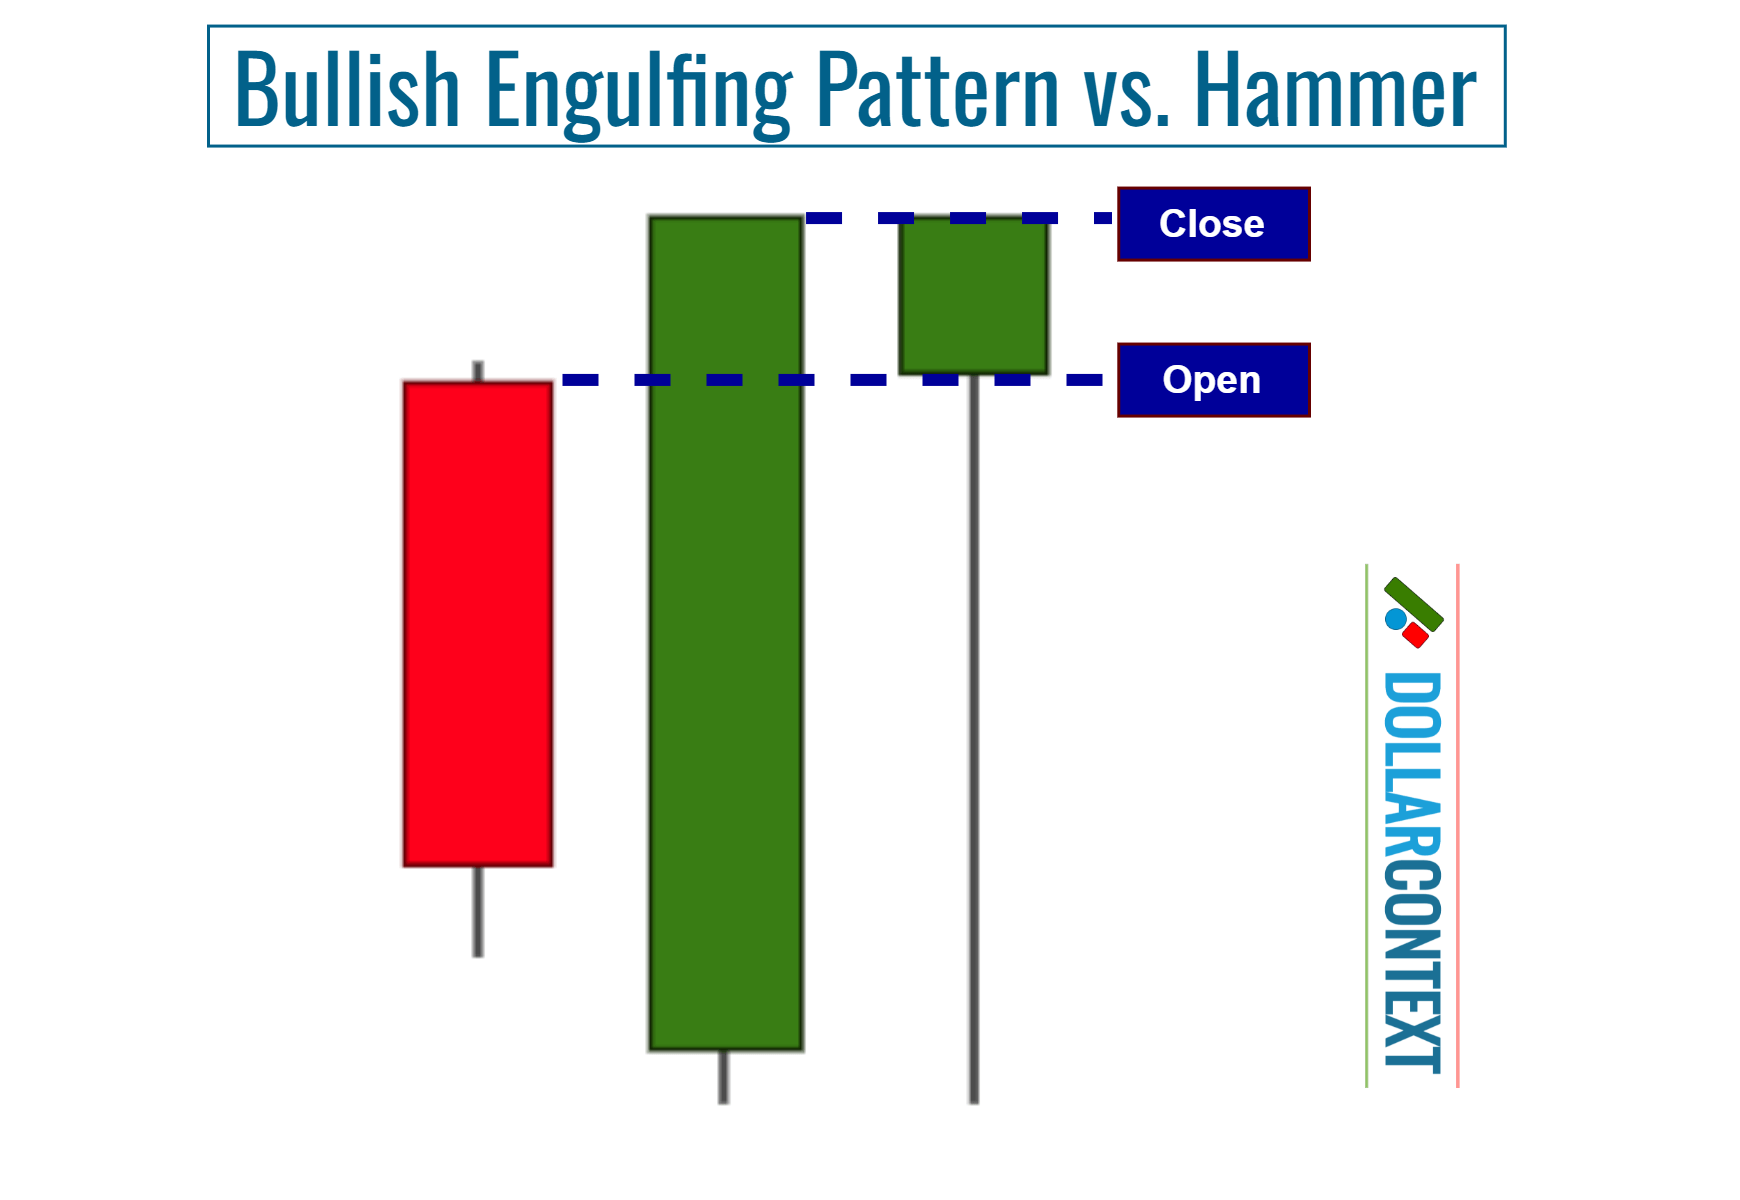
Similarities: Both patterns denote rising buying pressure at low levels and a potential change in market sentiment from bearish to bullish.
Differences: A bullish engulfing pattern can take a wide range of configurations according to the relative sizes of the real bodies, but not all of them can be merged into a hammer pattern.
2. Bearish Engulfing Pattern vs. Shooting Star
Combining the two candles that make up a bearish engulfing pattern frequently results in a formation similar to a shooting star pattern.
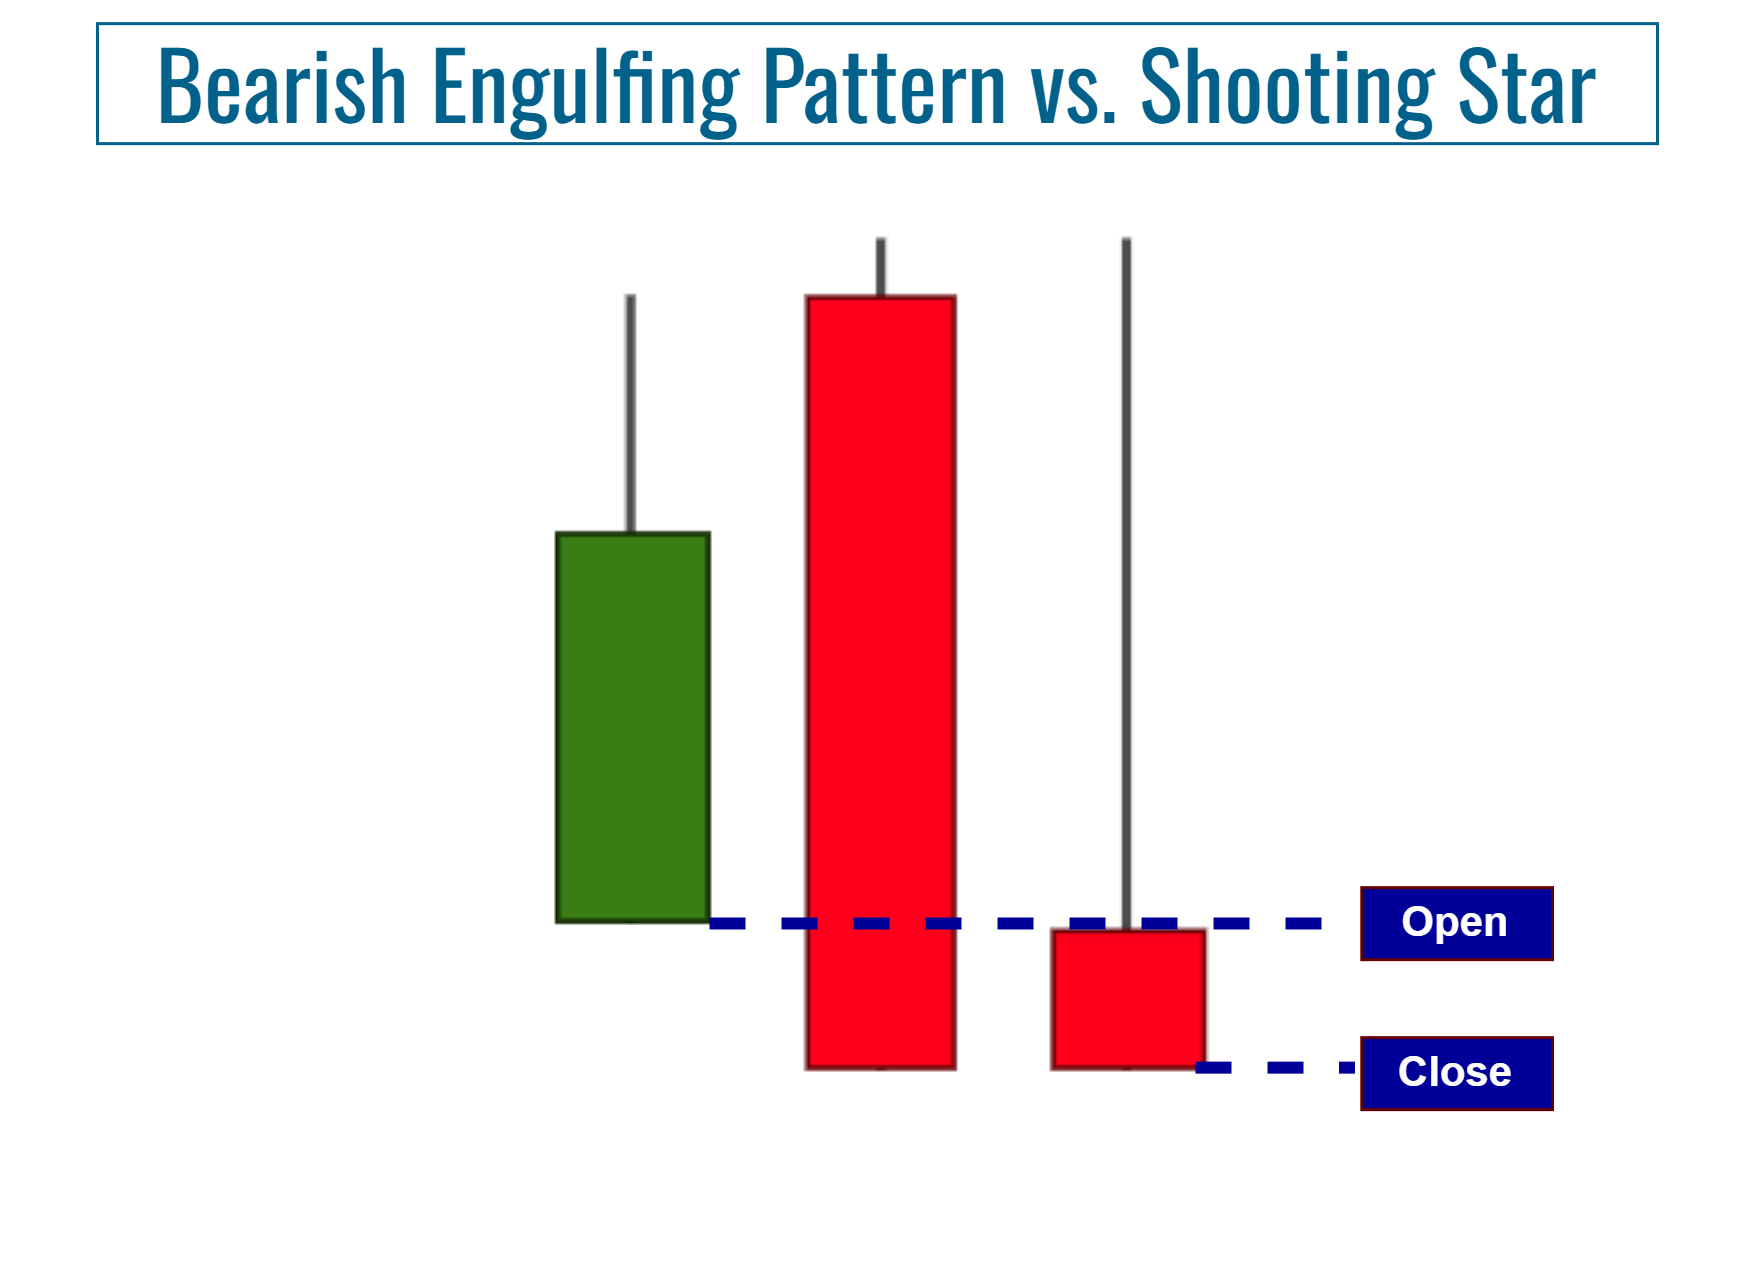
Similarities: Both patterns denote increasing selling pressure at high levels and a potential shift in market sentiment from bullish to bearish.
Differences: A bearish engulfing pattern can take a wide range of configurations, depending on the relative sizes of the real bodies. Not all of them, however, can be combined to constitute a hammer pattern.
3. Engulfing Pattern vs. Harami
The harami pattern bears a resemblance to the engulfing pattern, but in a reversed way. In a harami pattern, the first candle is long, and the second one is short and is encompassed by the first. Think of it as the engulfing pattern flipped inside out.
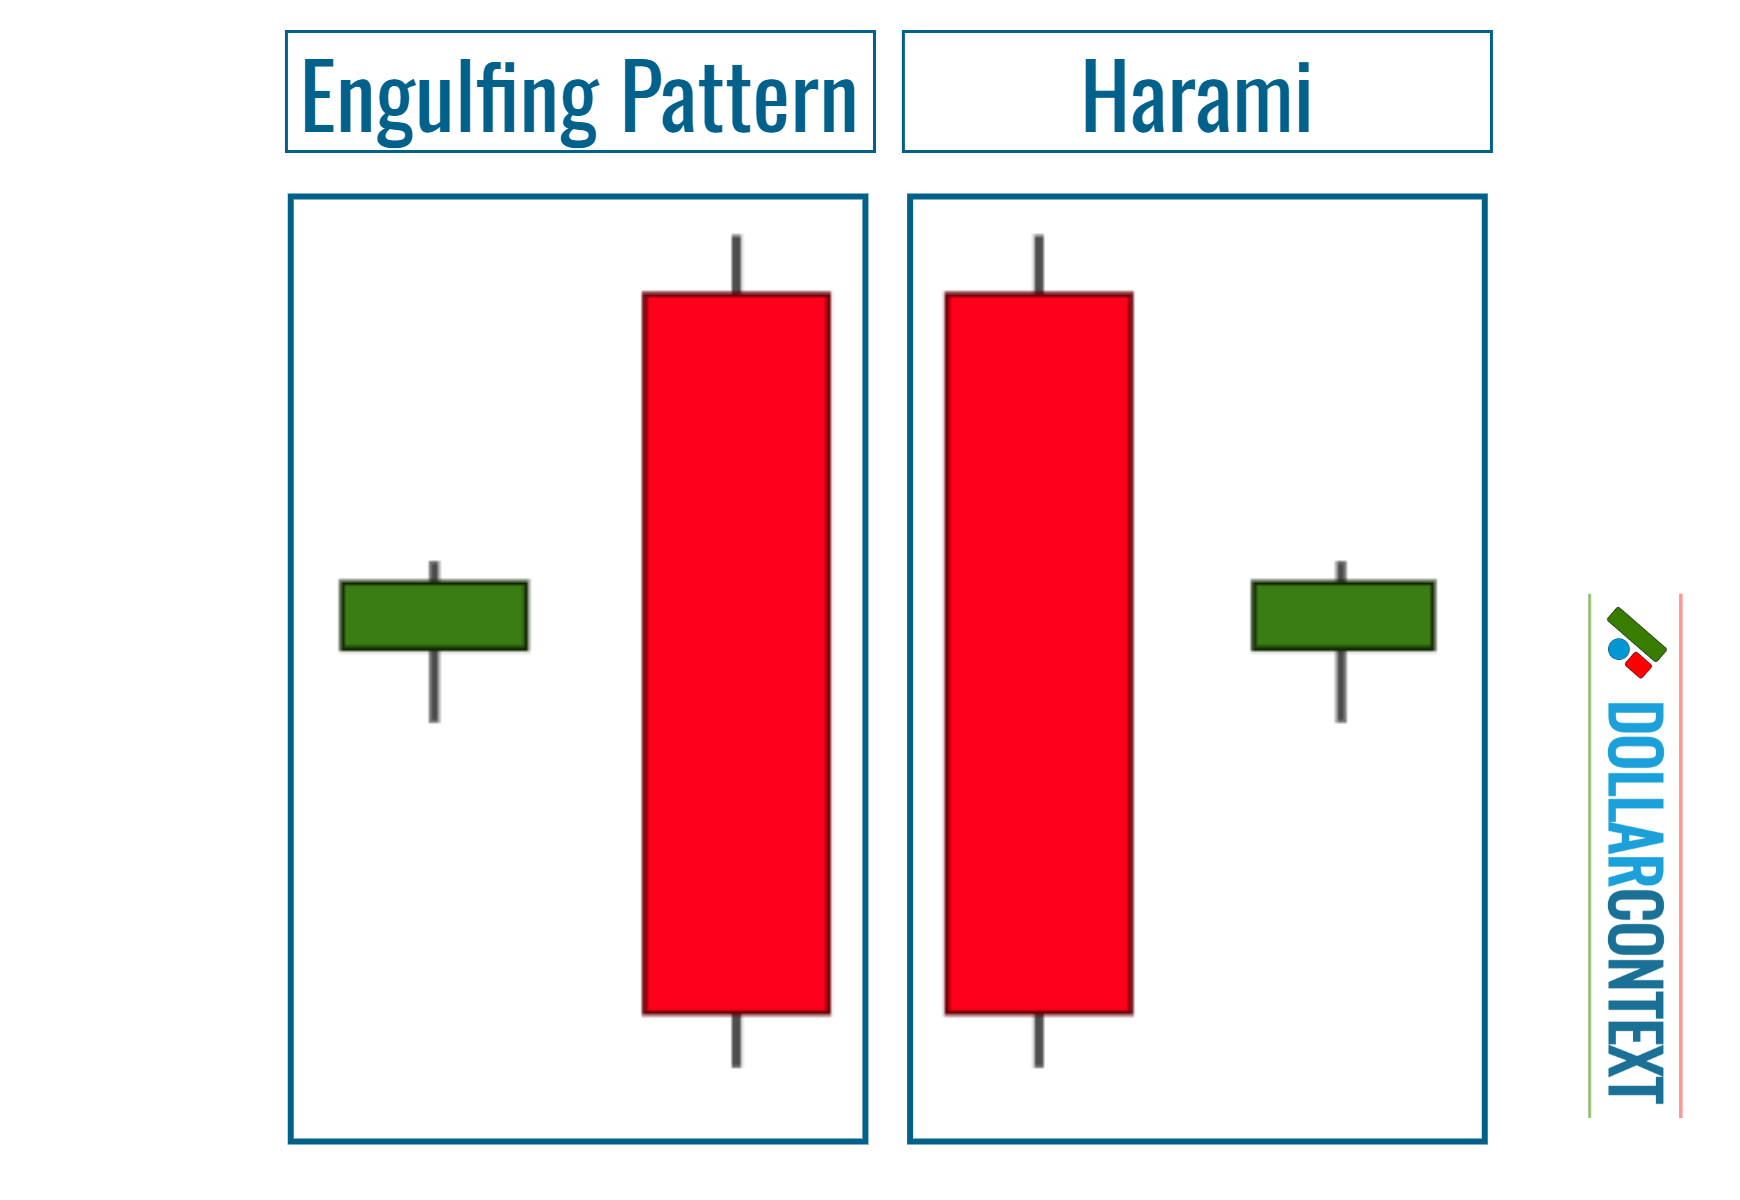
Similarities: Both patterns are constituted by two bodies, where one engulfs the other.
Differences: While the engulfing pattern typically indicates a strong reversal, a harami often suggests a transition period, a less strong reversal, or even a continuation signal in some contexts.
Last Engulfing Pattern
There are two main types of engulfing patterns:
- Standard Engulfing Pattern
- Last Engulfing Pattern
With regard to last engulfing patterns, we can differentiate two subtypes:
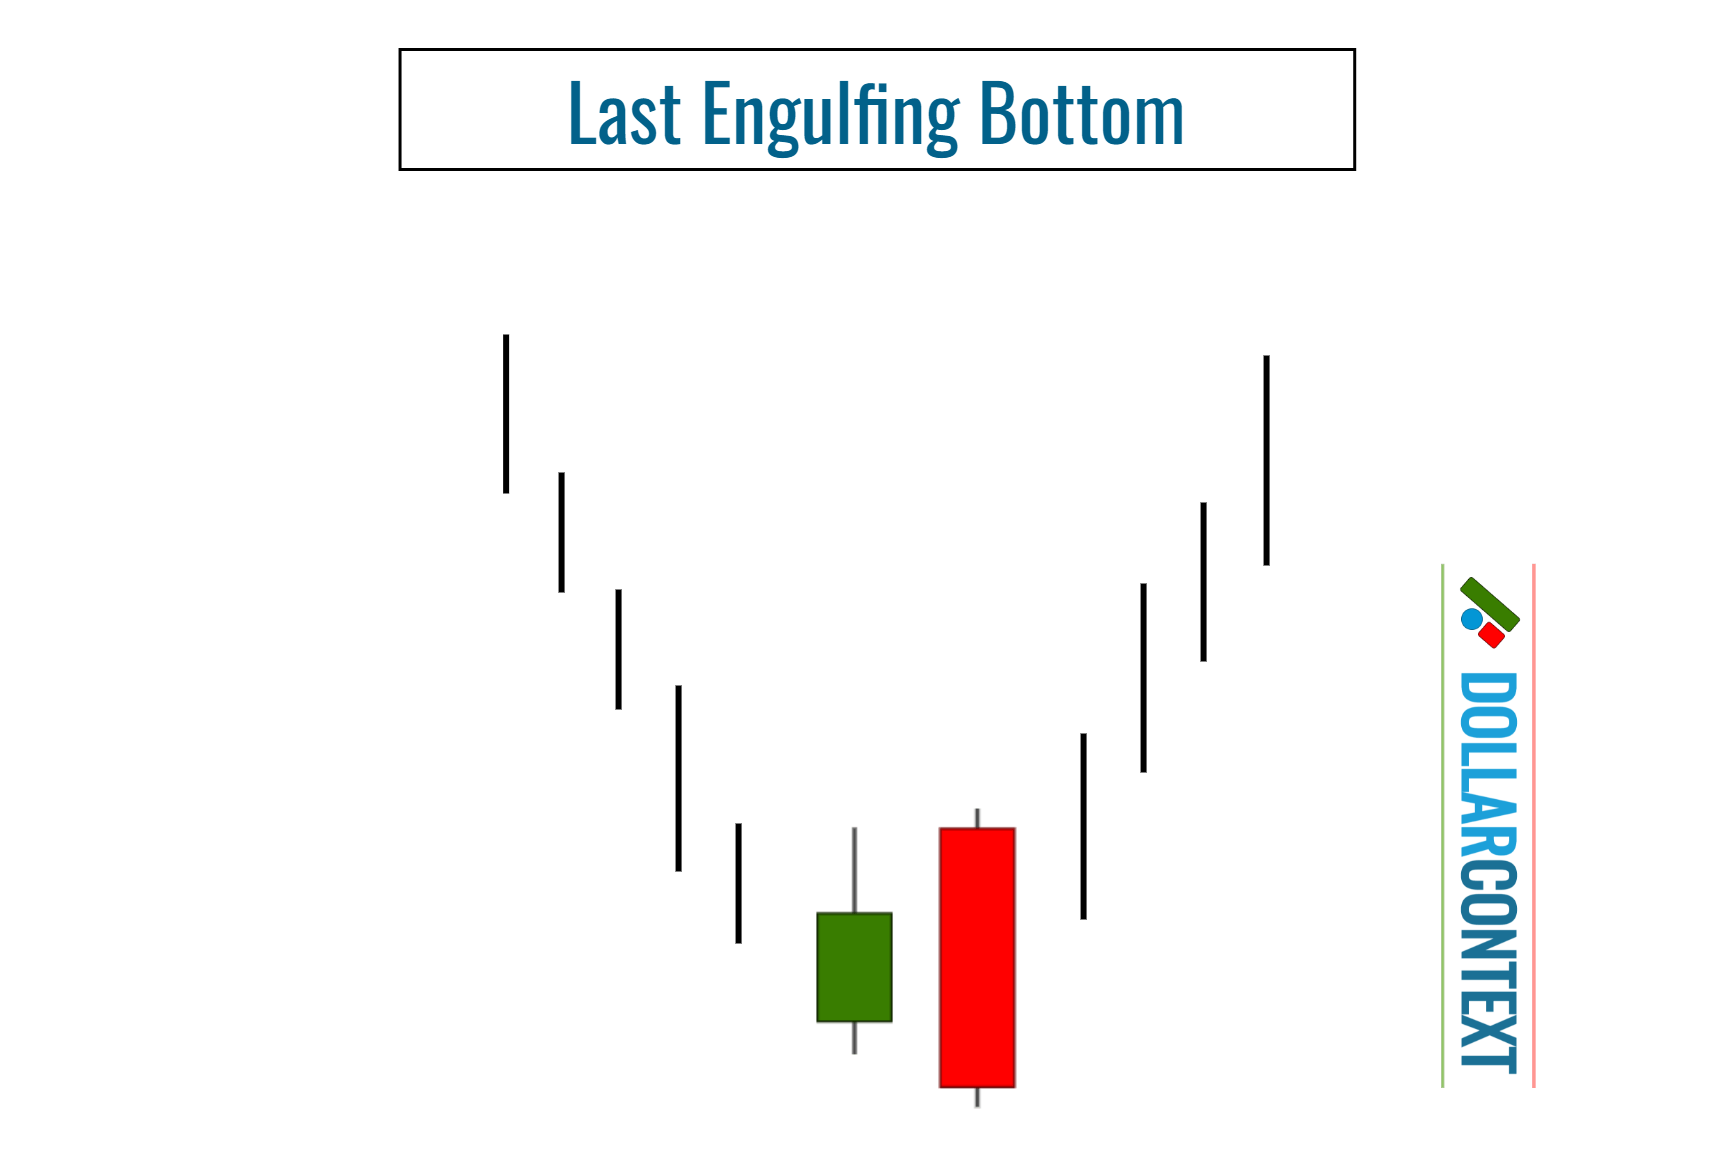
- Last Engulfing Bottom
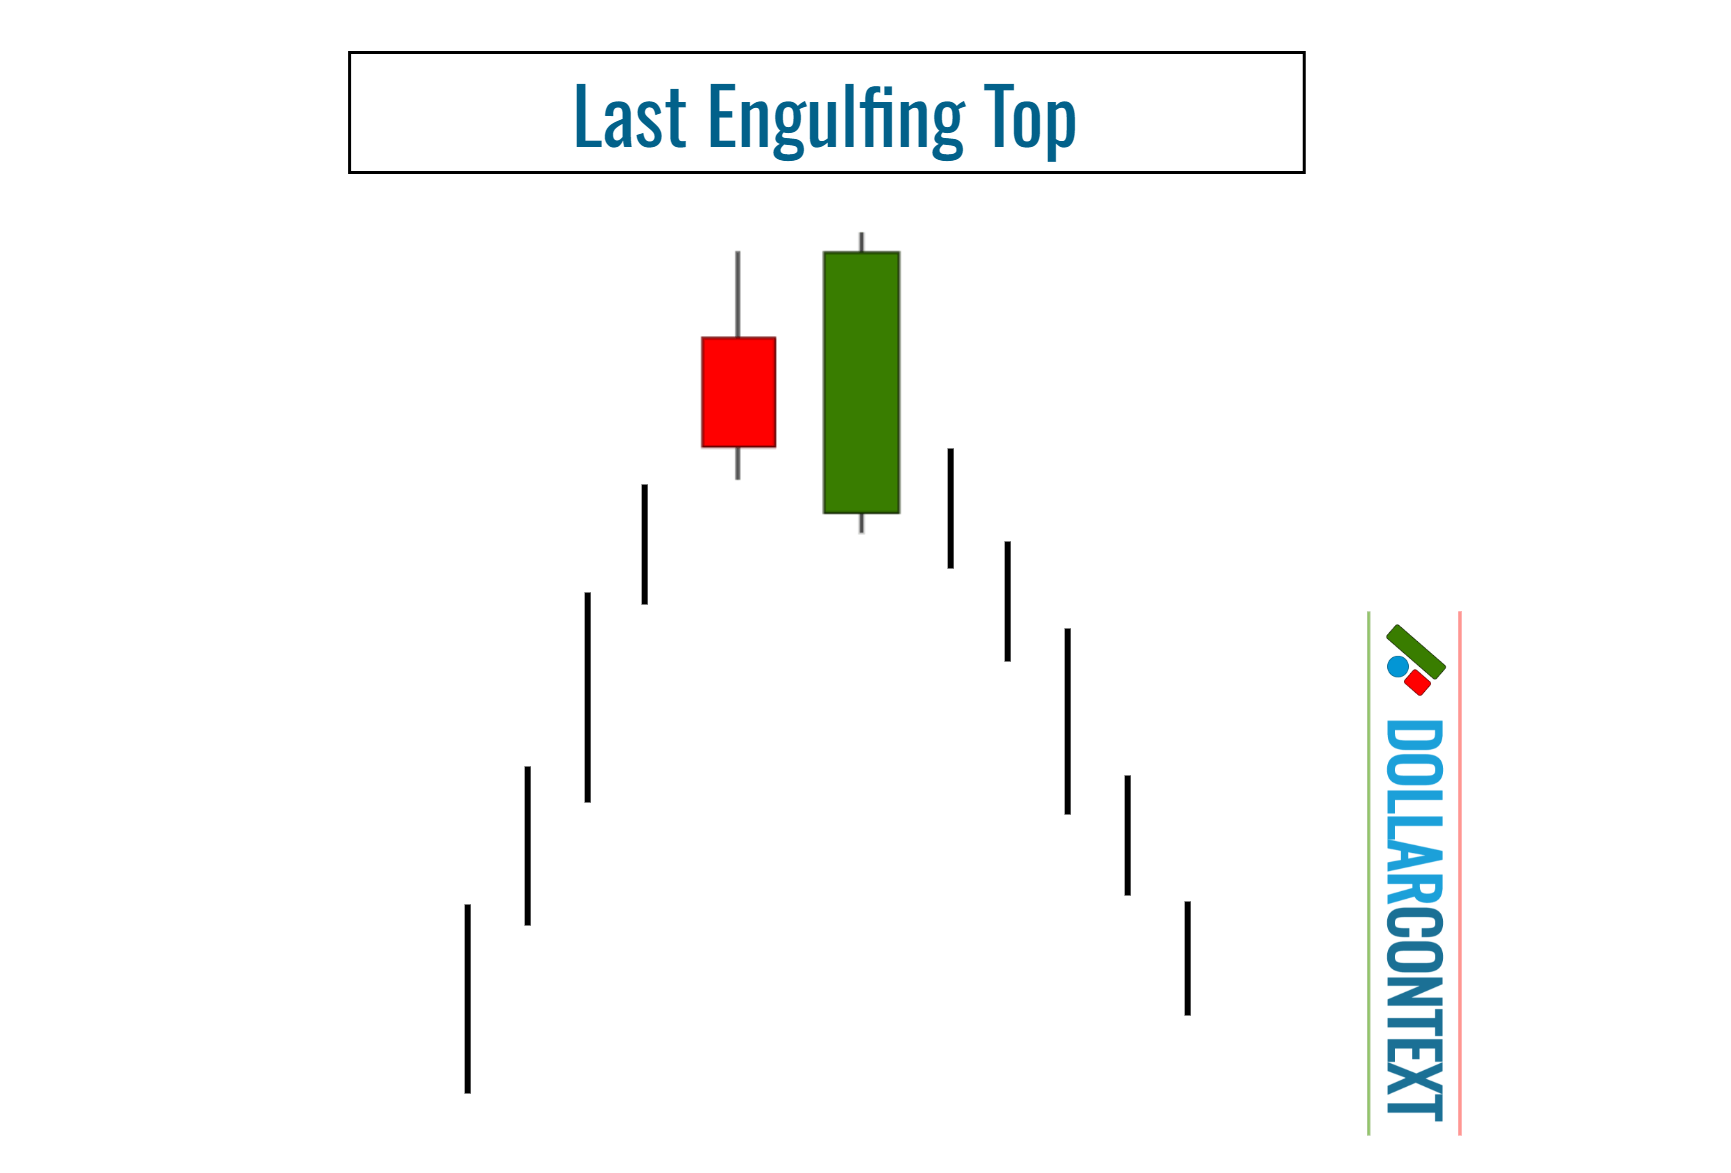
- Last Engulfing Top
Last Engulfing Bottom: A standard bearish engulfing pattern features a sizable black candle that completely covers a smaller white real body, typically following an uptrend. However, when this pattern emerges amid a price drop, it could potentially signal a bullish reversal at the bottom. Known as the "last engulfing bottom," this pattern is seen as a pivot point for bullish momentum if subsequent prices manage to close above the black candle's closing price
Last Engulfing Top: In a standard bullish engulfing pattern, a large white candle envelops a smaller preceding black real body during a downtrend. However, when this pattern occurs in an uptrending market, where a large white candle engulfs the previous day's black candle, it is considered a potentially bearish signal known as a "last engulfing top." According to candlestick theory, the bearish nature of this pattern is confirmed if the market closes below the large white candle's closing price on the following day.
Similarities: Both patterns share the same configuration and indicate a potential market reversal.
Differences: In terms of market direction, the context in which those formations should emerge is entirely different.


