
Evening Star Strategy: A Comprehensive Tutorial
In this tutorial, we explore the evening star, a three-candle formation found in the rich tapestry of Japanese candlestick charting techniques.

In this tutorial, we'll explore the evening star, a three-candle formation found in the rich tapestry of Japanese candlestick charting techniques.
Let’s begin by outlining three pivotal attributes shared by numerous candlestick configurations, including the evening star:
- Indication of Trend Reversal: Most candlestick patterns signal that the prevailing trend may be exhausting its run, with a reversal on the horizon. The evening star typically makes its appearance following a sustained uptrend.
- Timeframe Versatility: Candlestick patterns display a remarkable flexibility, making them relevant across a spectrum of timeframes for liquid markets. Whether one is examining the market on a minute-by-minute basis or over a span of months, these patterns maintain their significance.
- Universal Applicability: The utility of candlestick patterns is not confined to a single market — they are equally potent whether applied to stocks, forex, commodities, or indices. This universal relevance is attributed to their foundation in price action, which reflects the mass psychology of market participants.
Contents
1. Shape of the Evening Star
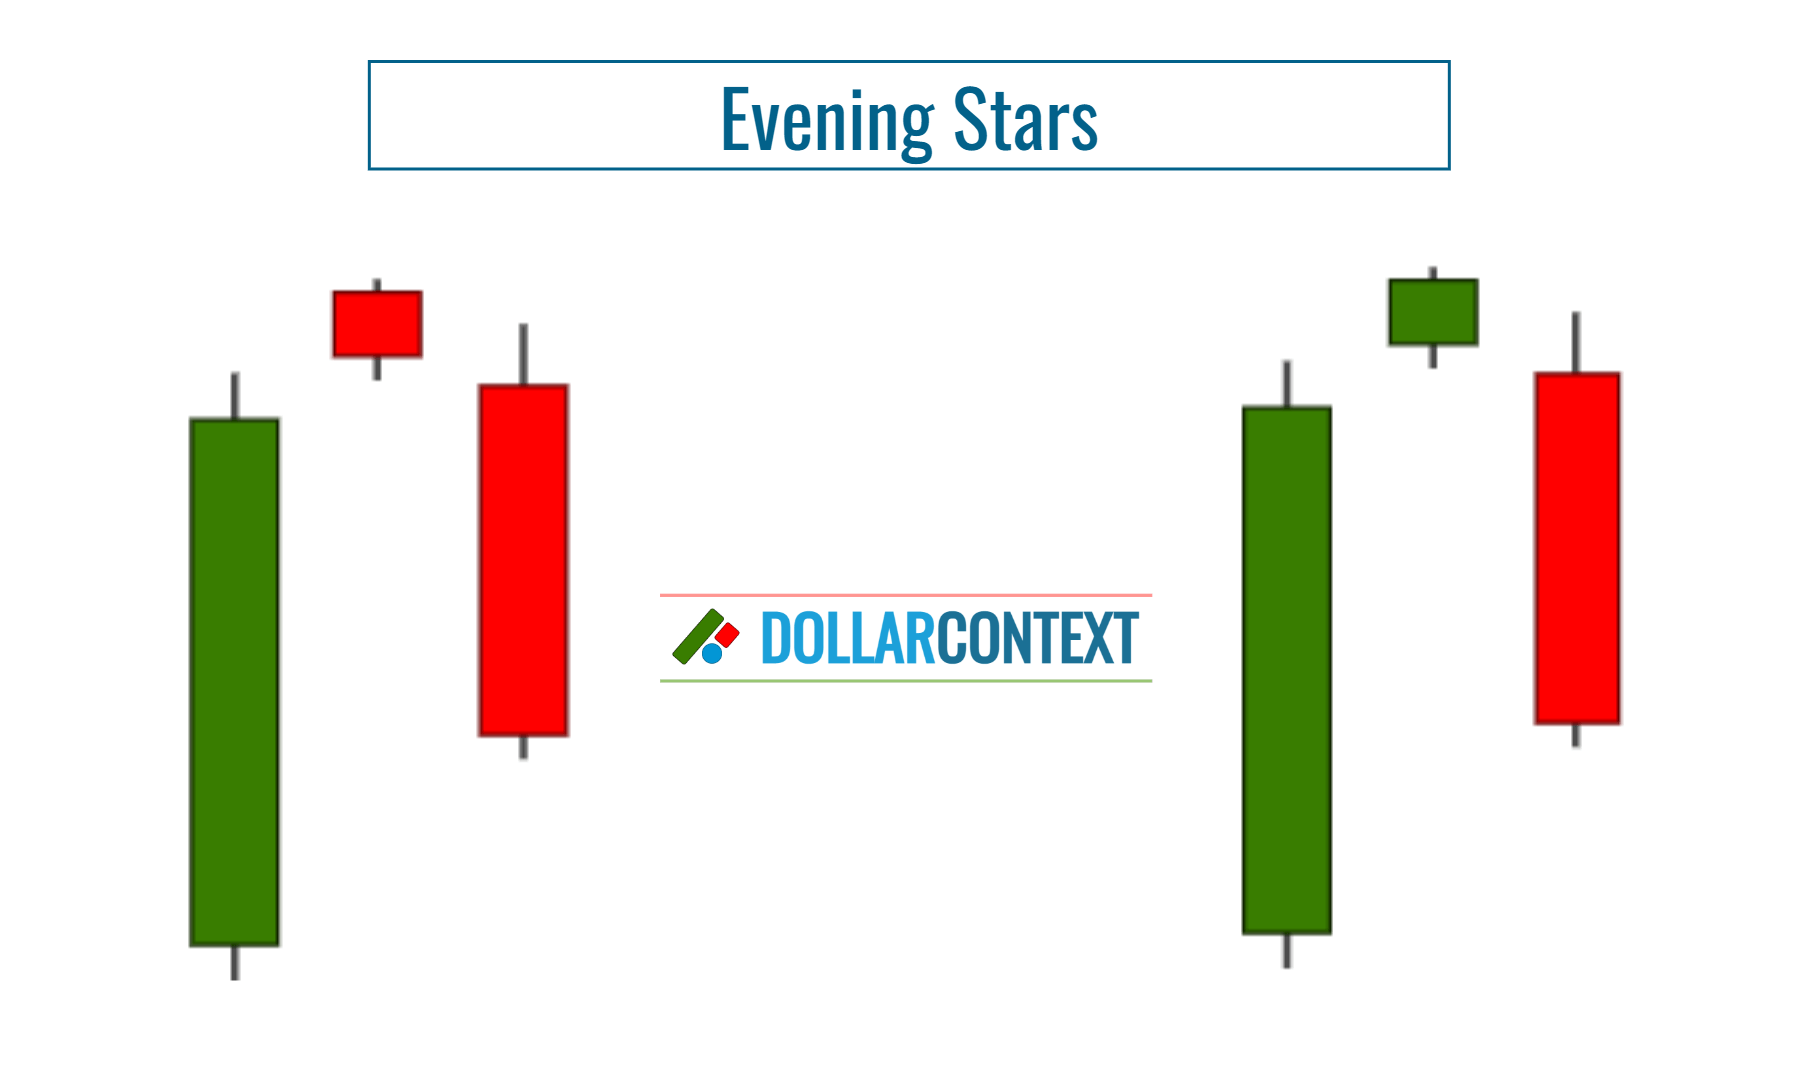
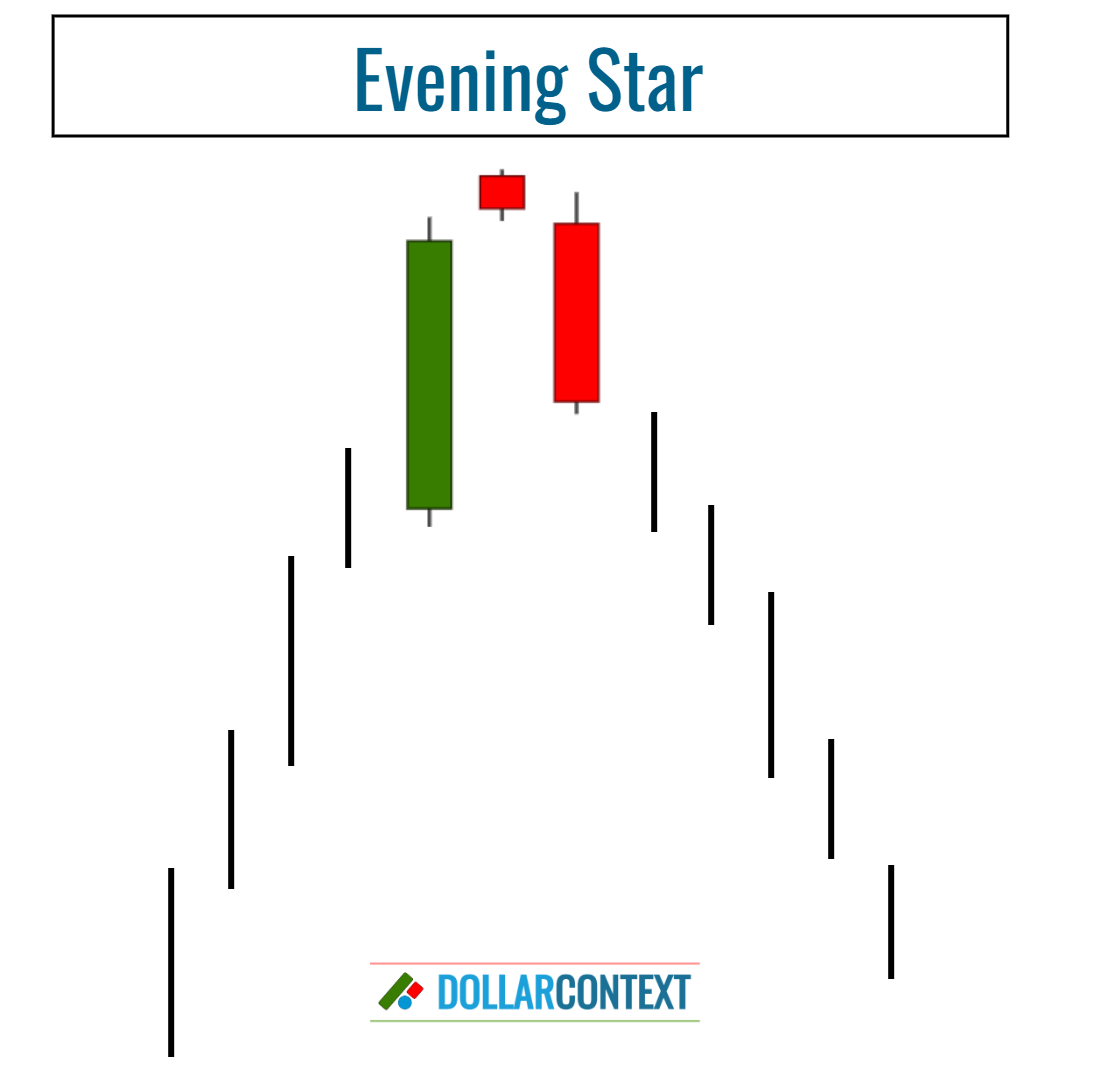
The shape of an evening star is characterized by three specific candles:
- The first candle is a large bullish candle (green or white) that continues the prevailing uptrend, signifying a strong buying day.
- The second candle is a smaller-bodied candle, which can be bullish or bearish (green, white, red, or black), and it typically gaps higher than the first candle. This candle represents indecision in the market and a potential slowing of the uptrend's momentum. The gap ensures that the second candle opens above the close of the first, creating a star-like appearance.
- The third candle is a large bearish candle (red or black) that closes well into the body of the first candle, ideally below its midpoint. This candle signifies a strong selling day and suggests that the bulls are losing control to the bears, which could indicate the start of a downtrend.
The evening star pattern is the bearish counterpart to the bullish morning star pattern.
The characteristics outlined previously depict the classic evening star pattern in its most recognized form. Yet, when it comes to actual trading scenarios, evening star variations that deviate from the textbook model may still be regarded as legitimate indicators of potential reversals, depending on the prevailing market circumstances.
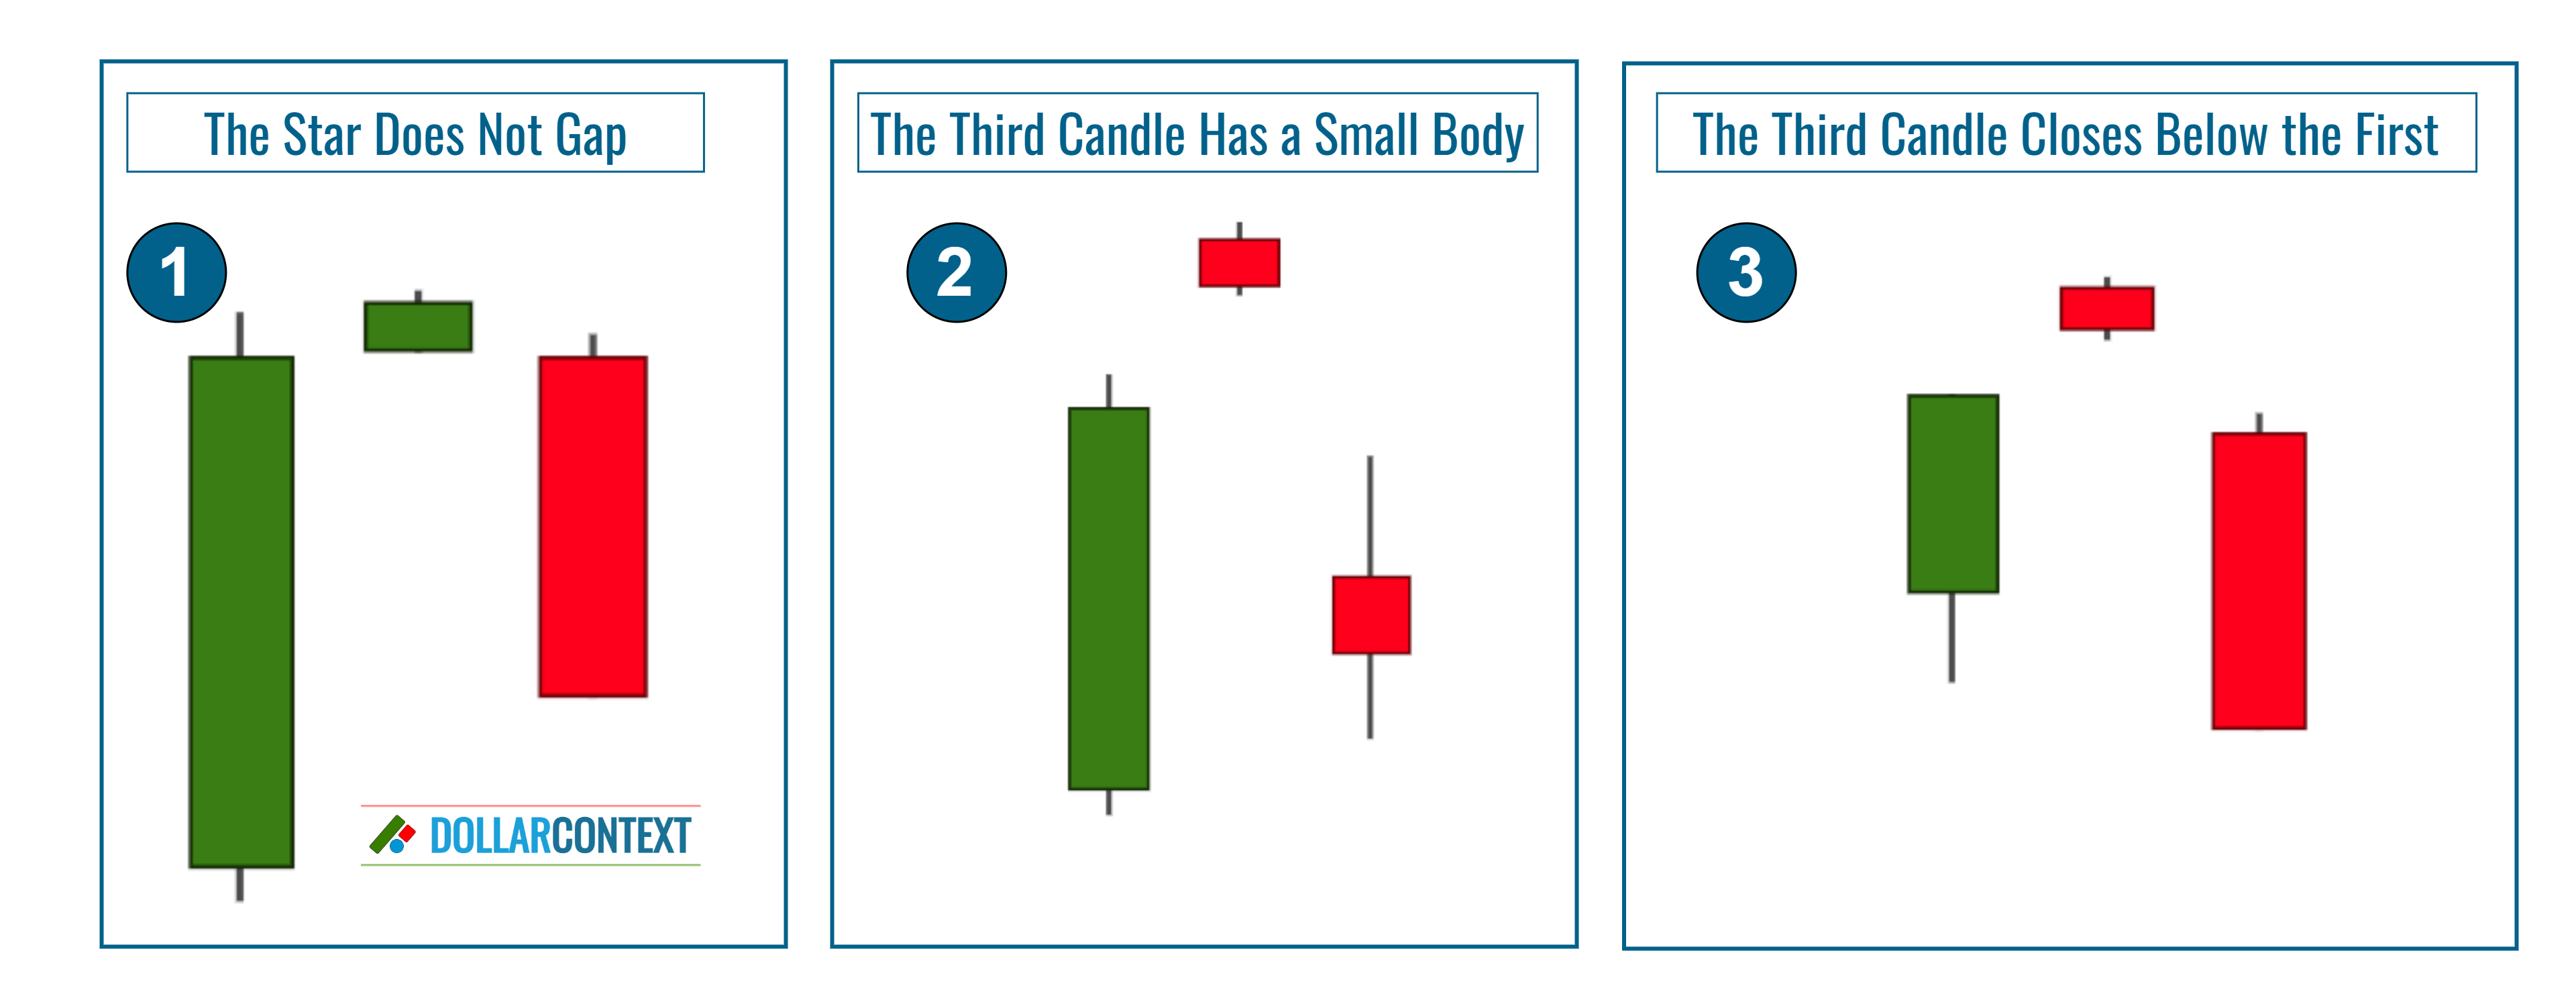
Below are some commonly observed variations of the evening star pattern:
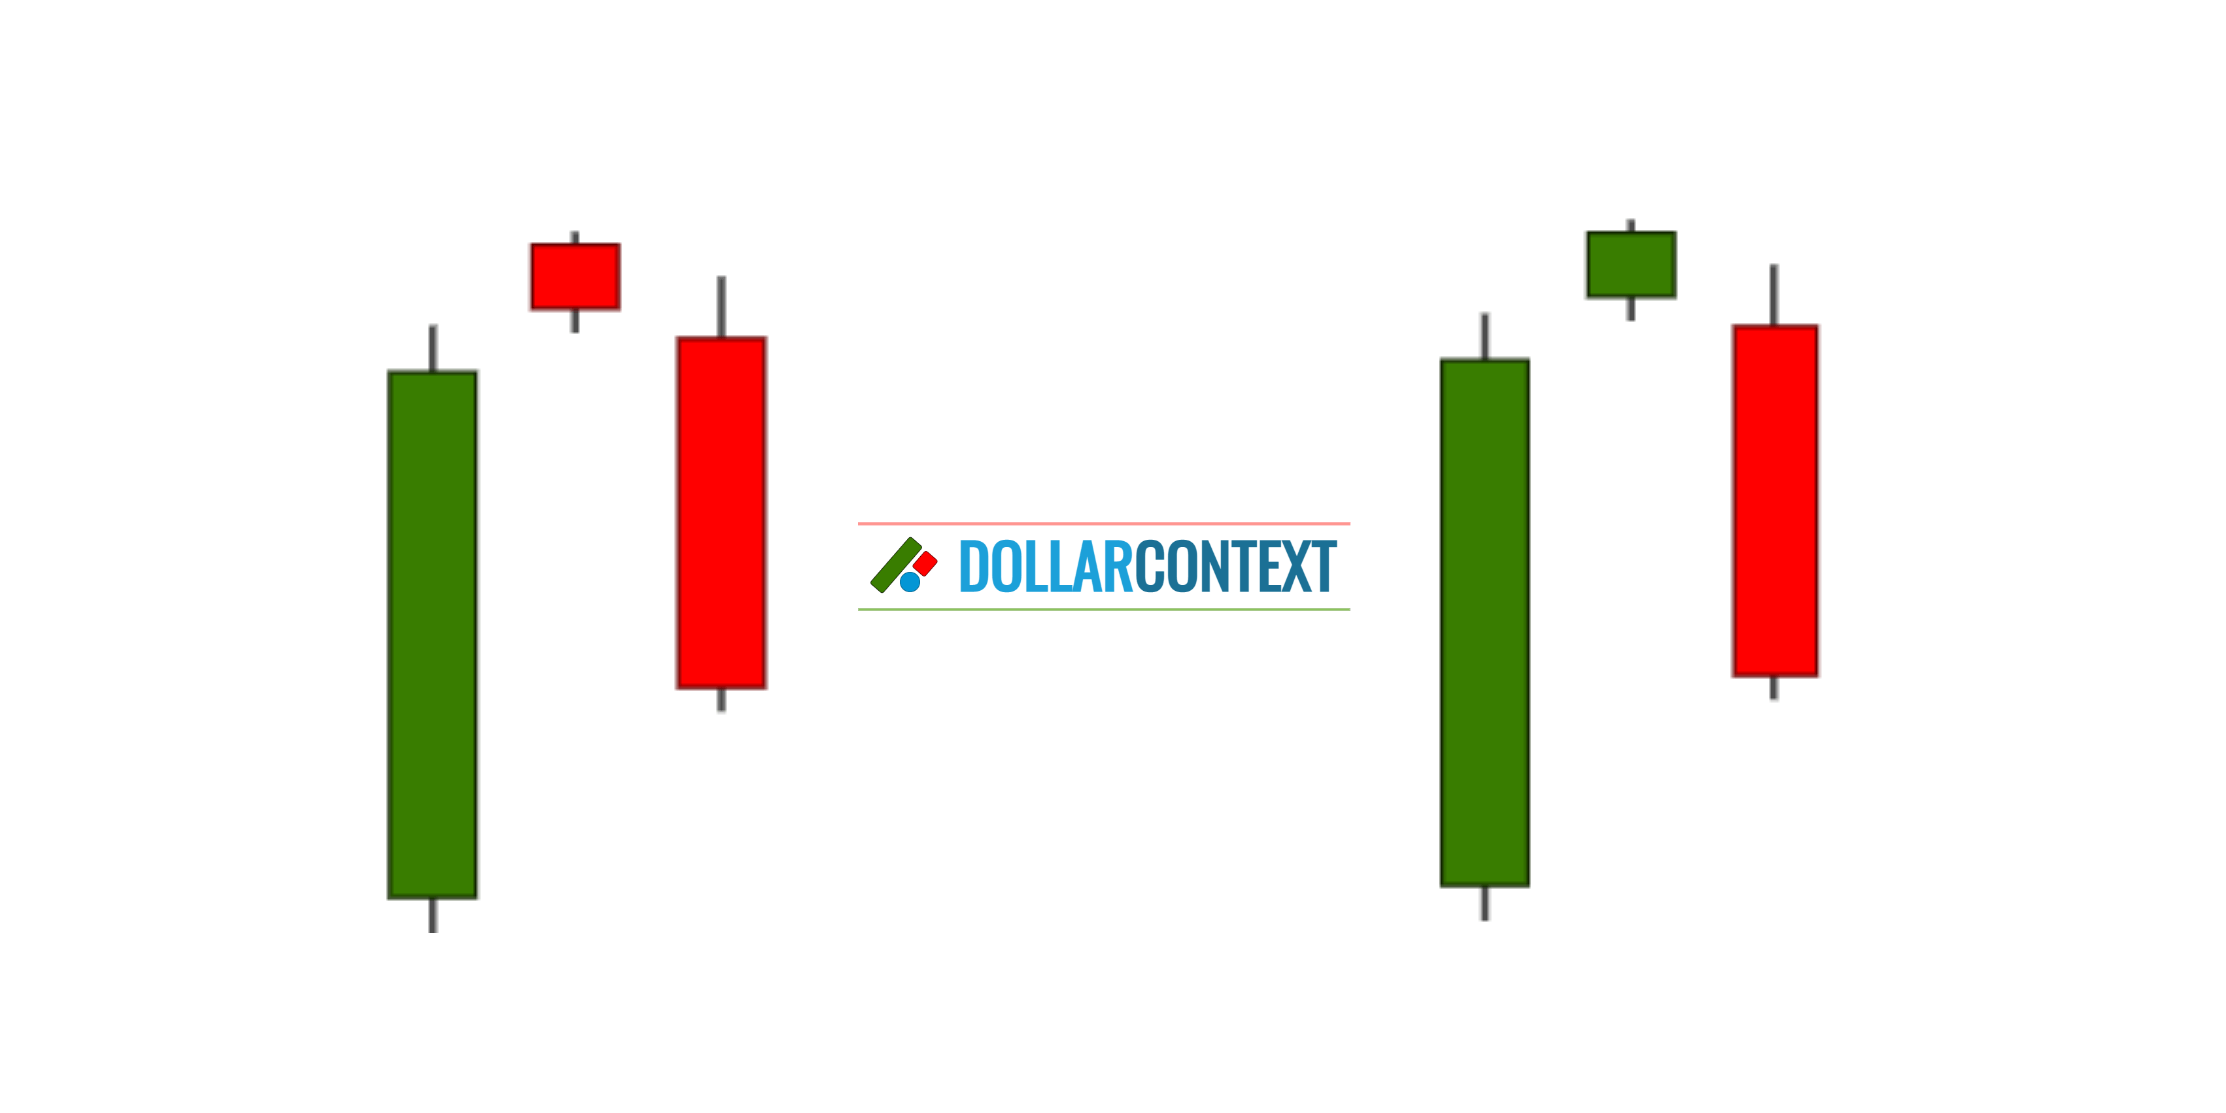
- The Second Candle (Star) Does Not Gap: This is common in lower volatility settings and shorter-term charts (minutes or hours), where the middle candle—the "star"—does not exhibit a price gap. Under such circumstances, it may be prudent to seek further bearish confirmation before initiating a trade.
- The Third Candle Has a Small Red or Black Body: In such cases, ensure that the closing price of the third candlestick penetrates deeply into the real body of the first. If that's not the case, additional bearish patterns should be considered before taking trading action.
- The Third Candle Closes Below the First: Often in more established or mature markets, the third candle closing beneath the first is a common sight. Such a pronounced red candle is indicative of a shift in market dynamics, potentially heralding the start of a bearish trend.
To qualify as an evening star (or an evening star variation), the following conditions must be satisfied:
- Established Uptrend Requirement: The emergence of the pattern should follow a definitive uptrend in the market. The robustness of the signal is directly proportional to the length of the preceding uptrend and the degree to which the market conditions are overbought.
- Initial Bullish Candle: The pattern's commencement is marked by a sizable bullish candlestick, typically green or white, indicating strong buying pressure.
- Second Candle (Star): The central feature of this formation is a candle with a small body, irrespective of its bullish or bearish nature, that ideally gaps above the preceding candle’s close.
- Final Bearish Candle: The concluding candle should be a bearish one, with a close that significantly intrudes into the real body of the initial bullish candle, signaling the bears taking control.
2. Context
When assessing the implications of an evening star pattern, the context in which this formation appears is as important as the three-candle combination itself.
Because the evening star reflects a shift in market sentiment, and potentially a bearish reversal, it should appear in the context of a clearly identifiable uptrend.
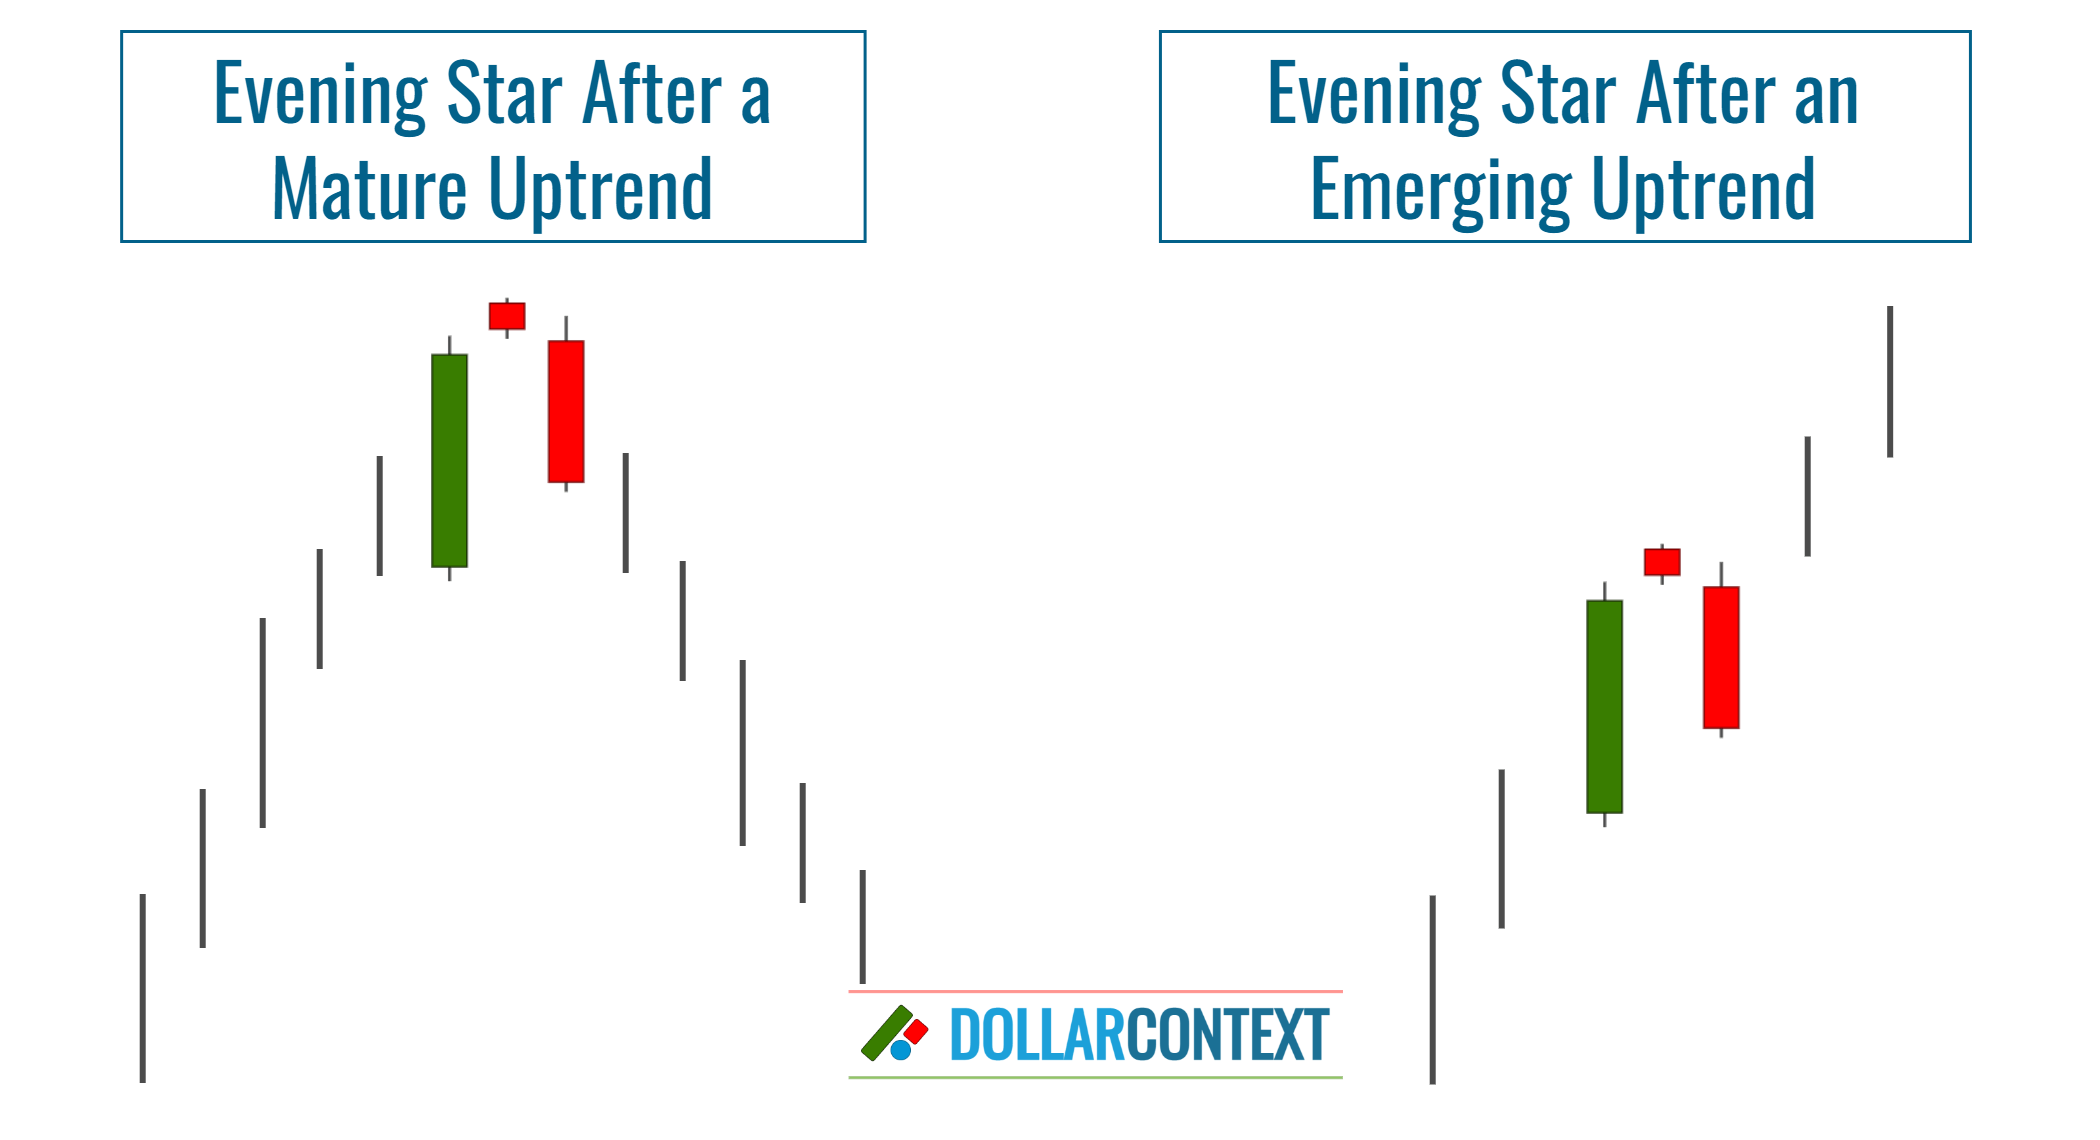
Mature vs. Emerging Trends: An evening star following a significant upward movement may suggest a market top. However, if the market has only recently started its upward trajectory, the chances of it being at its high are diminished.
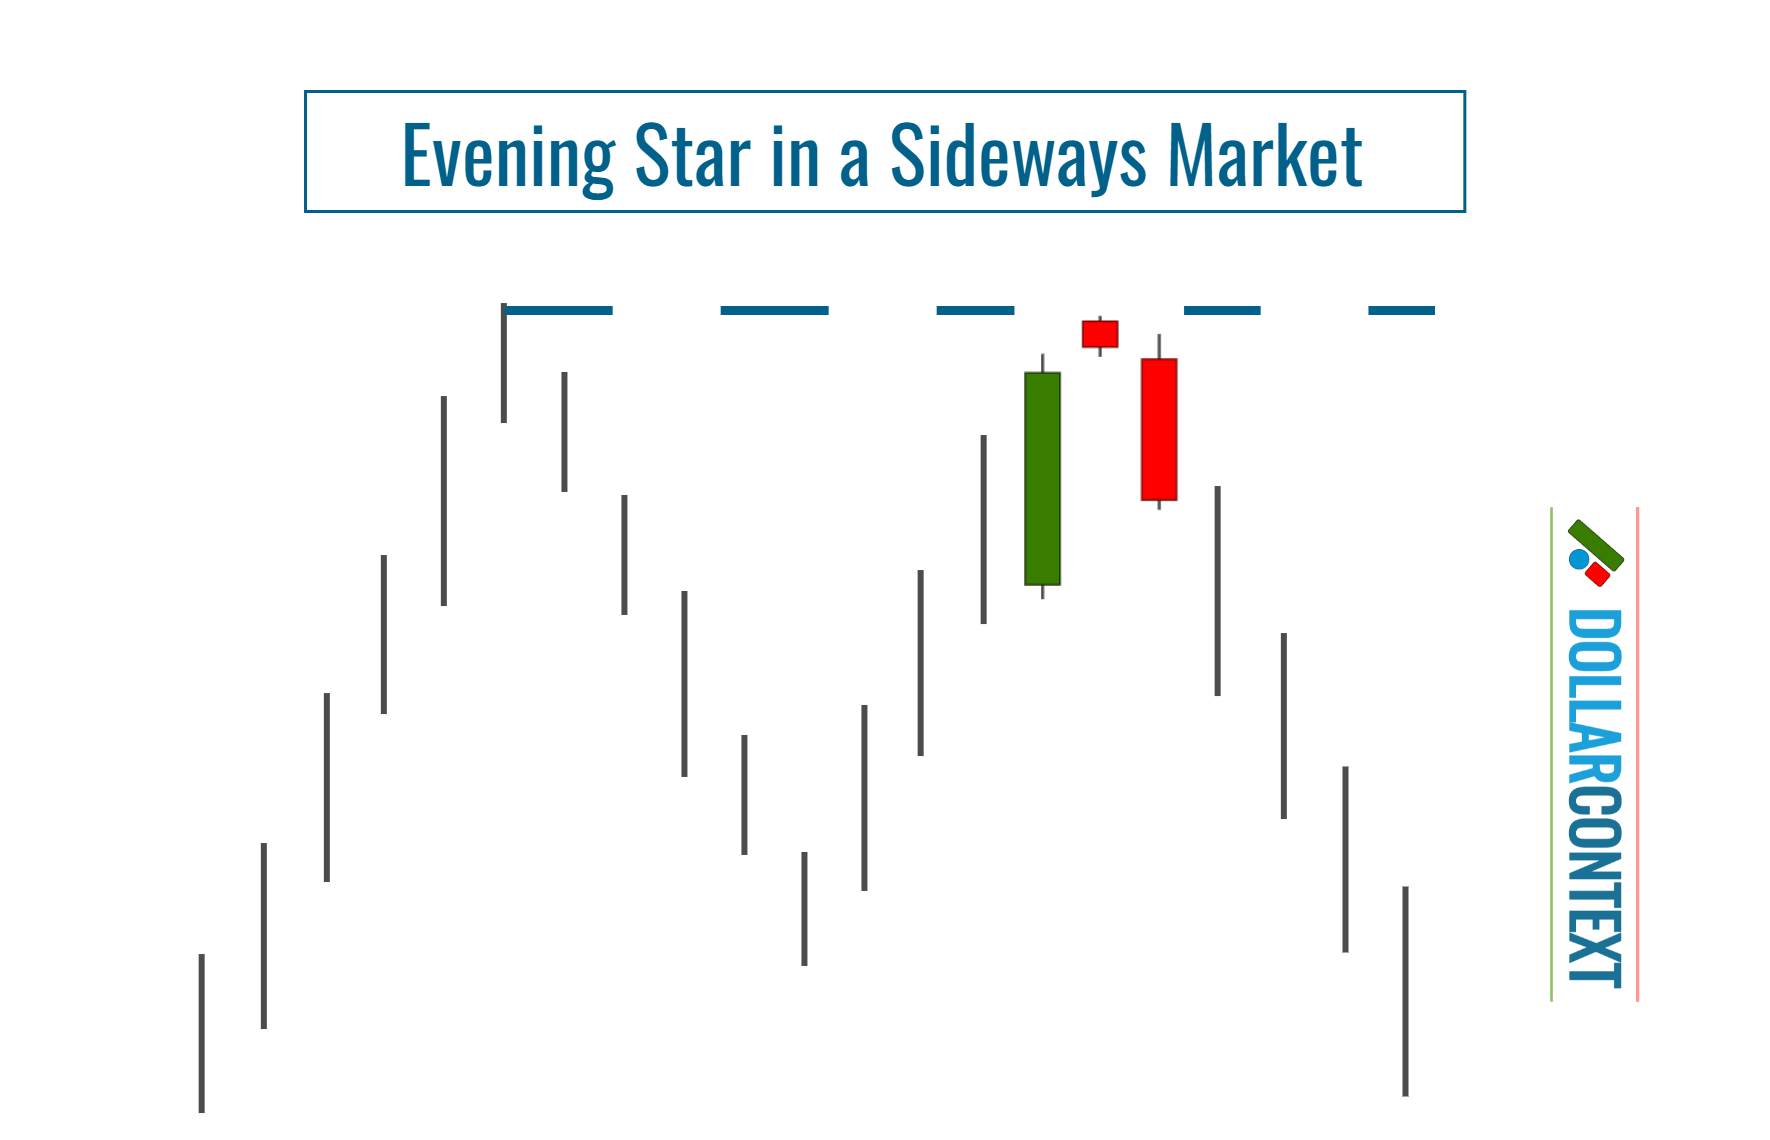
In sideways trading conditions, an evening star usually holds no significance. Having said that, if the pattern emerges near the upper limit of a wide trading range, it may indicate a potential move toward the opposite end of that range.
Following the appearance of an evening star, the likelihood of a reversal increases in relation to the duration and strength of the preceding uptrend.
When determining the reliability of the evening star as a reversal indicator, consider these additional contextual factors:
- Disparity in Body Size: The larger the body of the first candle and the smaller the star (second candle), the more significant the signal.
- Presence in Resistance Zones: An evening star that appears in an established resistance area substantially enhances its reversal implications.
- Confluence with Other Reversal Patterns: Sometimes, an evening star is accompanied by other reversal patterns within the same price range. The combined occurrence of these patterns enhances the probability of a genuine trend reversal.
- Market Extremes: Following this pattern, a reversal becomes more probable when the market is nearing excessively overbought conditions.
3. Psychology Behind the Evening Star
Psychologically, an evening star reflects a shift in market sentiment. The initial bullish momentum, represented by the first large green candle, suggests a continuation of the uptrend. However, the appearance of the small-bodied star candle indicates hesitation among traders, signaling that buyers are losing their grip on the market.
This indecision is followed by a definitive bearish candle, which represents a clear change in attitude, as sellers take control and push prices down. The pattern as a whole captures the transition from bullish to bearish bias, hinting at an impending downturn as confidence wanes and a new consensus forms among market participants.
4. Entry Points
To determine an entry point for an evening star pattern, you can implement one of the strategies detailed below.
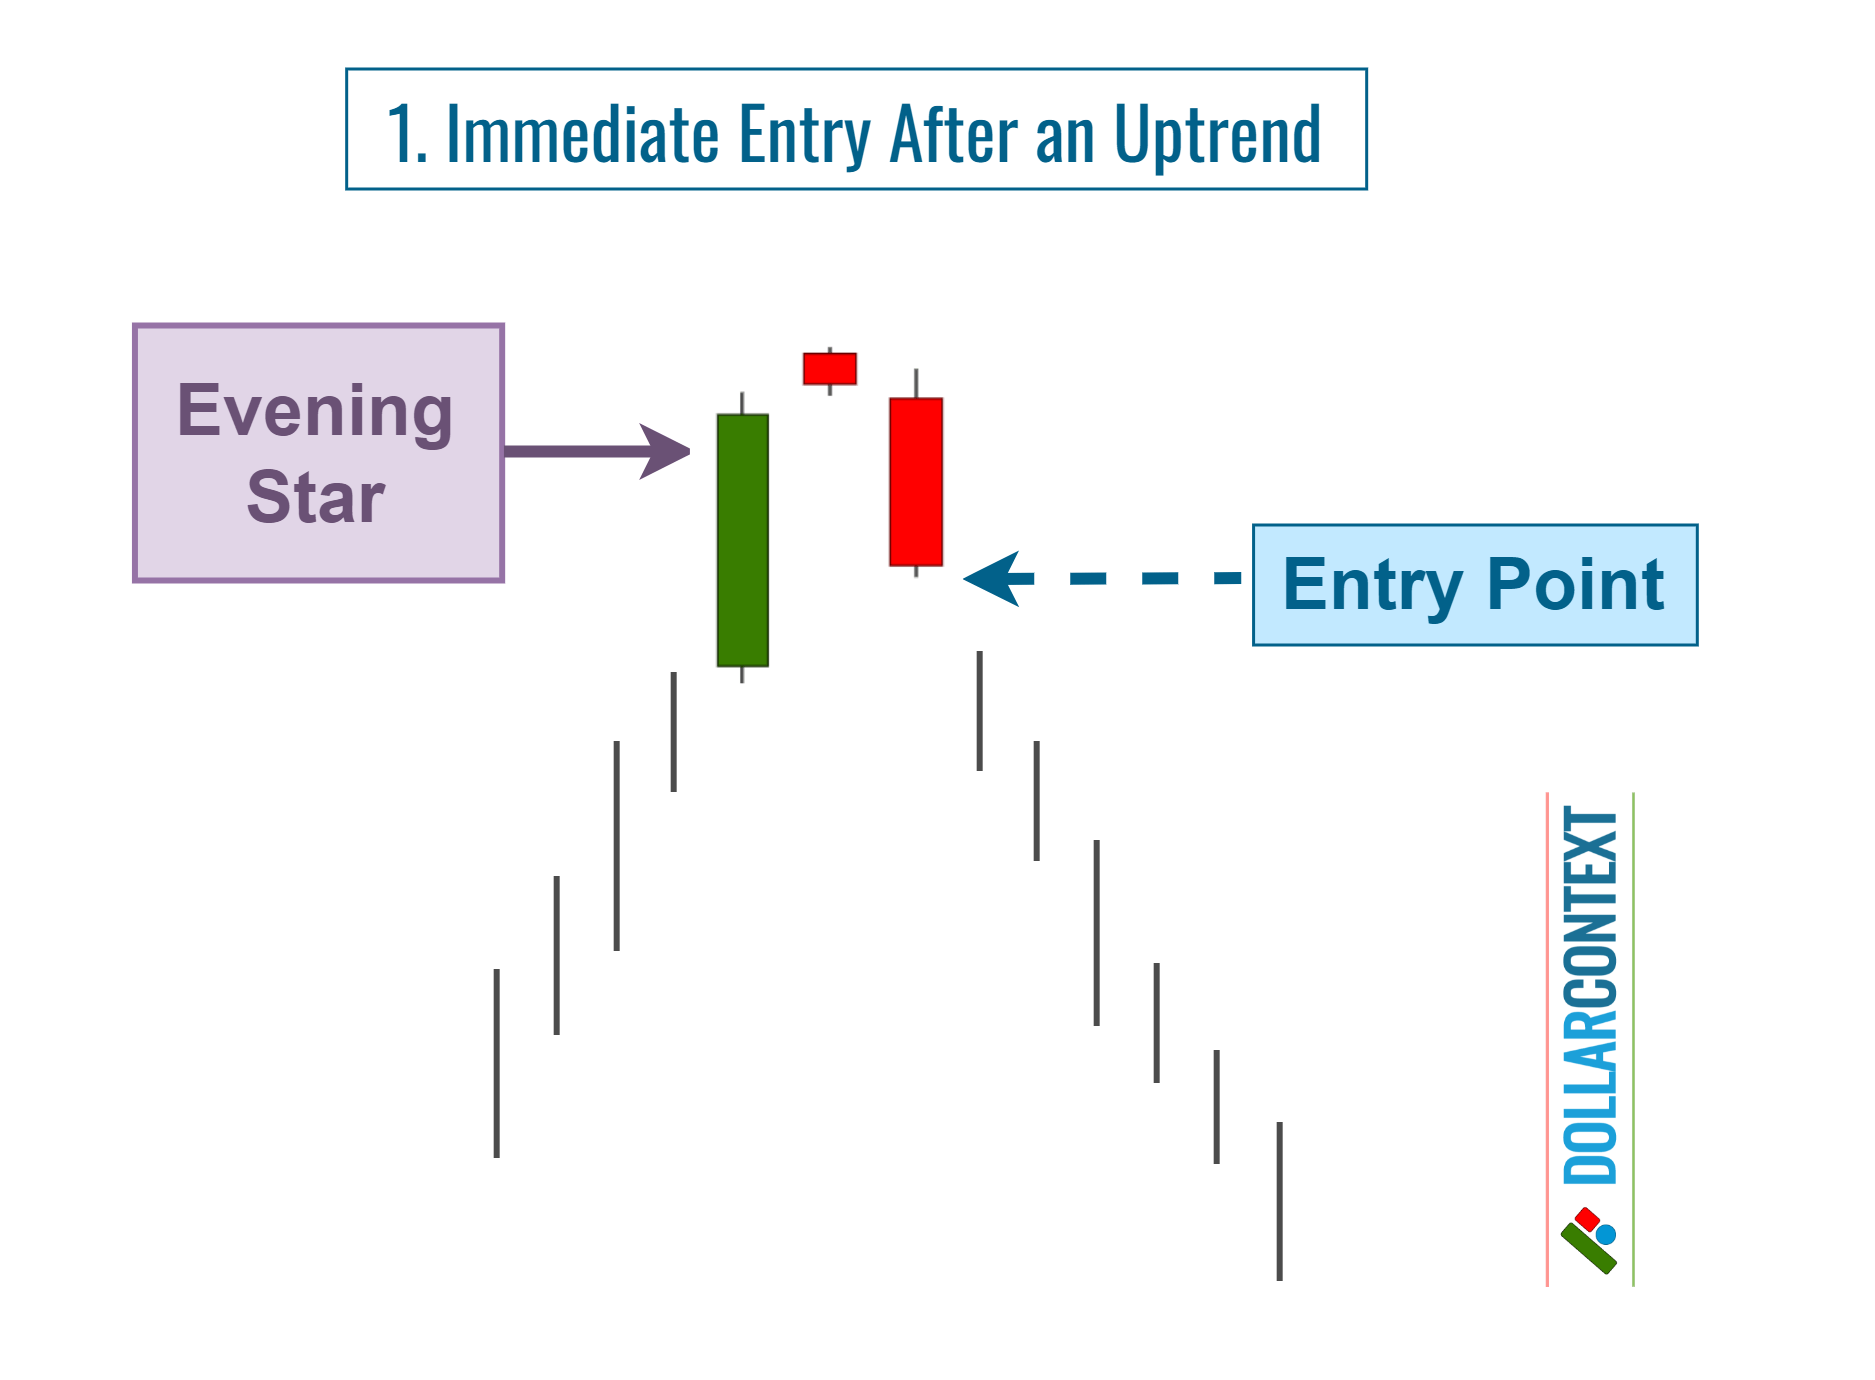
4.1 Immediate Entry
After the formation of the evening star, you could consider opening a position if the preceding trend is well-established and additional technical indicators suggest an imminent reversal. This method is bolder, banking on the expectation of a rapid market reversal.
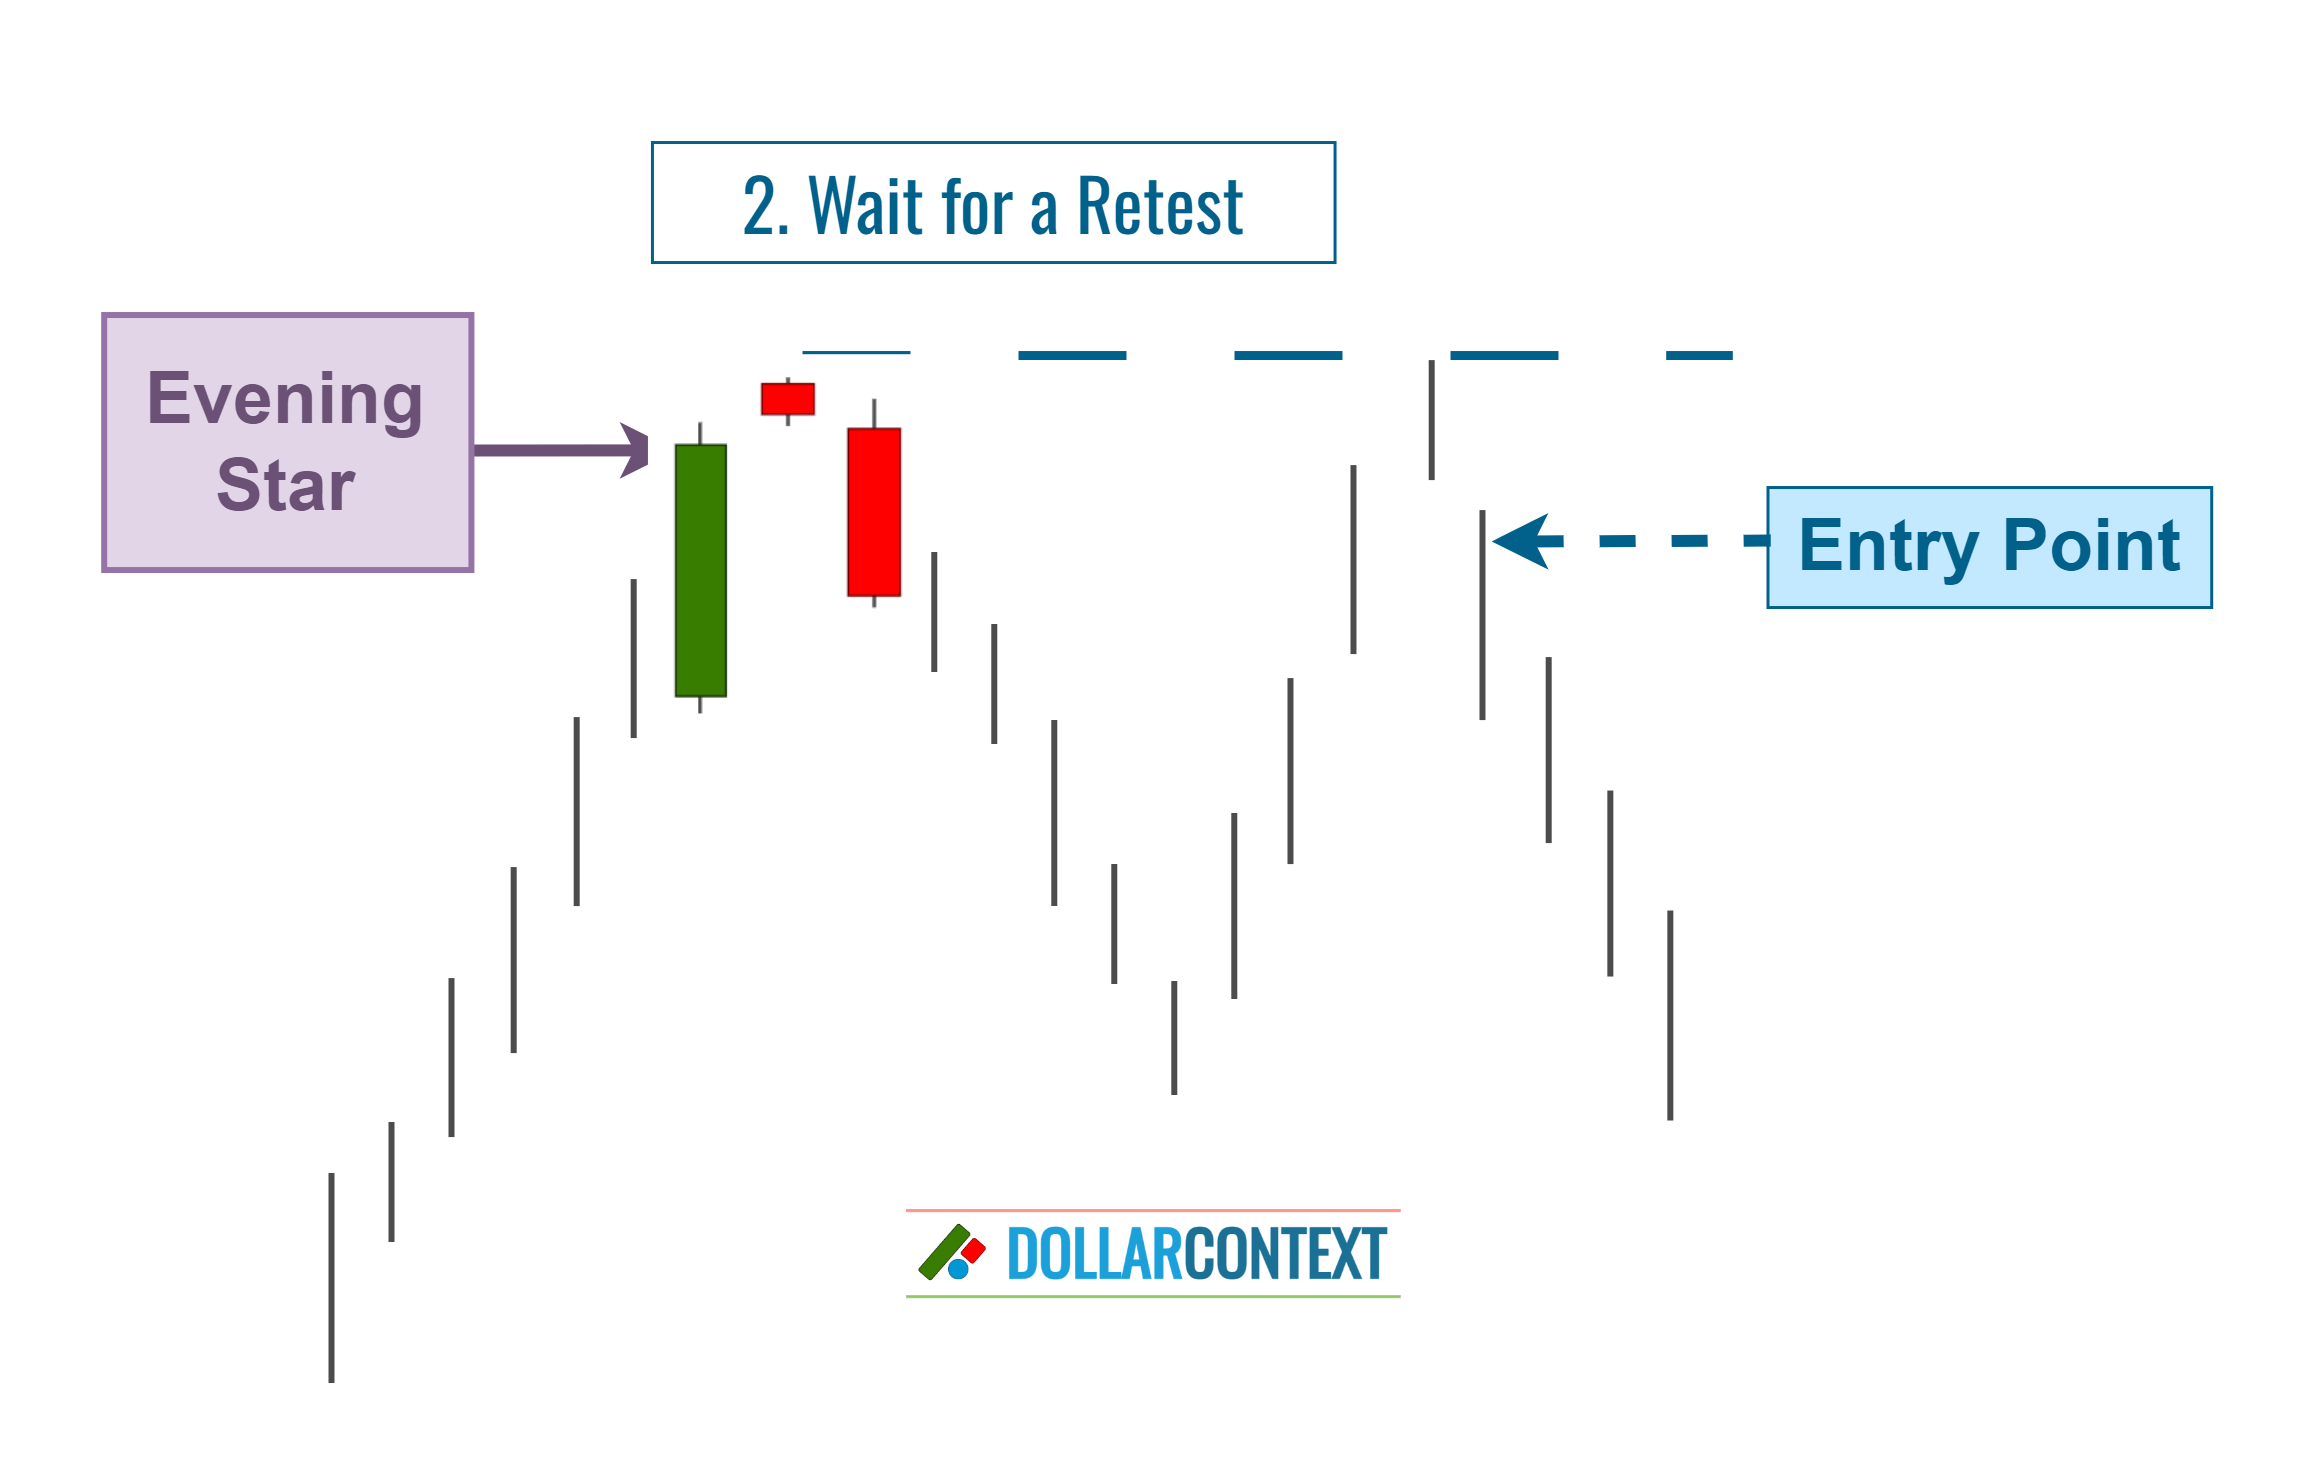
4.2 Wait for a Retest
It's important to admit that after a pronounced or mature uptrend, the appearance of an evening star might still face residual selling pressure in the short term. As a result, the initial downward move may not be reliable, causing the market to retest the highs of the pattern. This is why some traders prefer to wait for the market to revisit the highs of the evening star before initiating a short position.
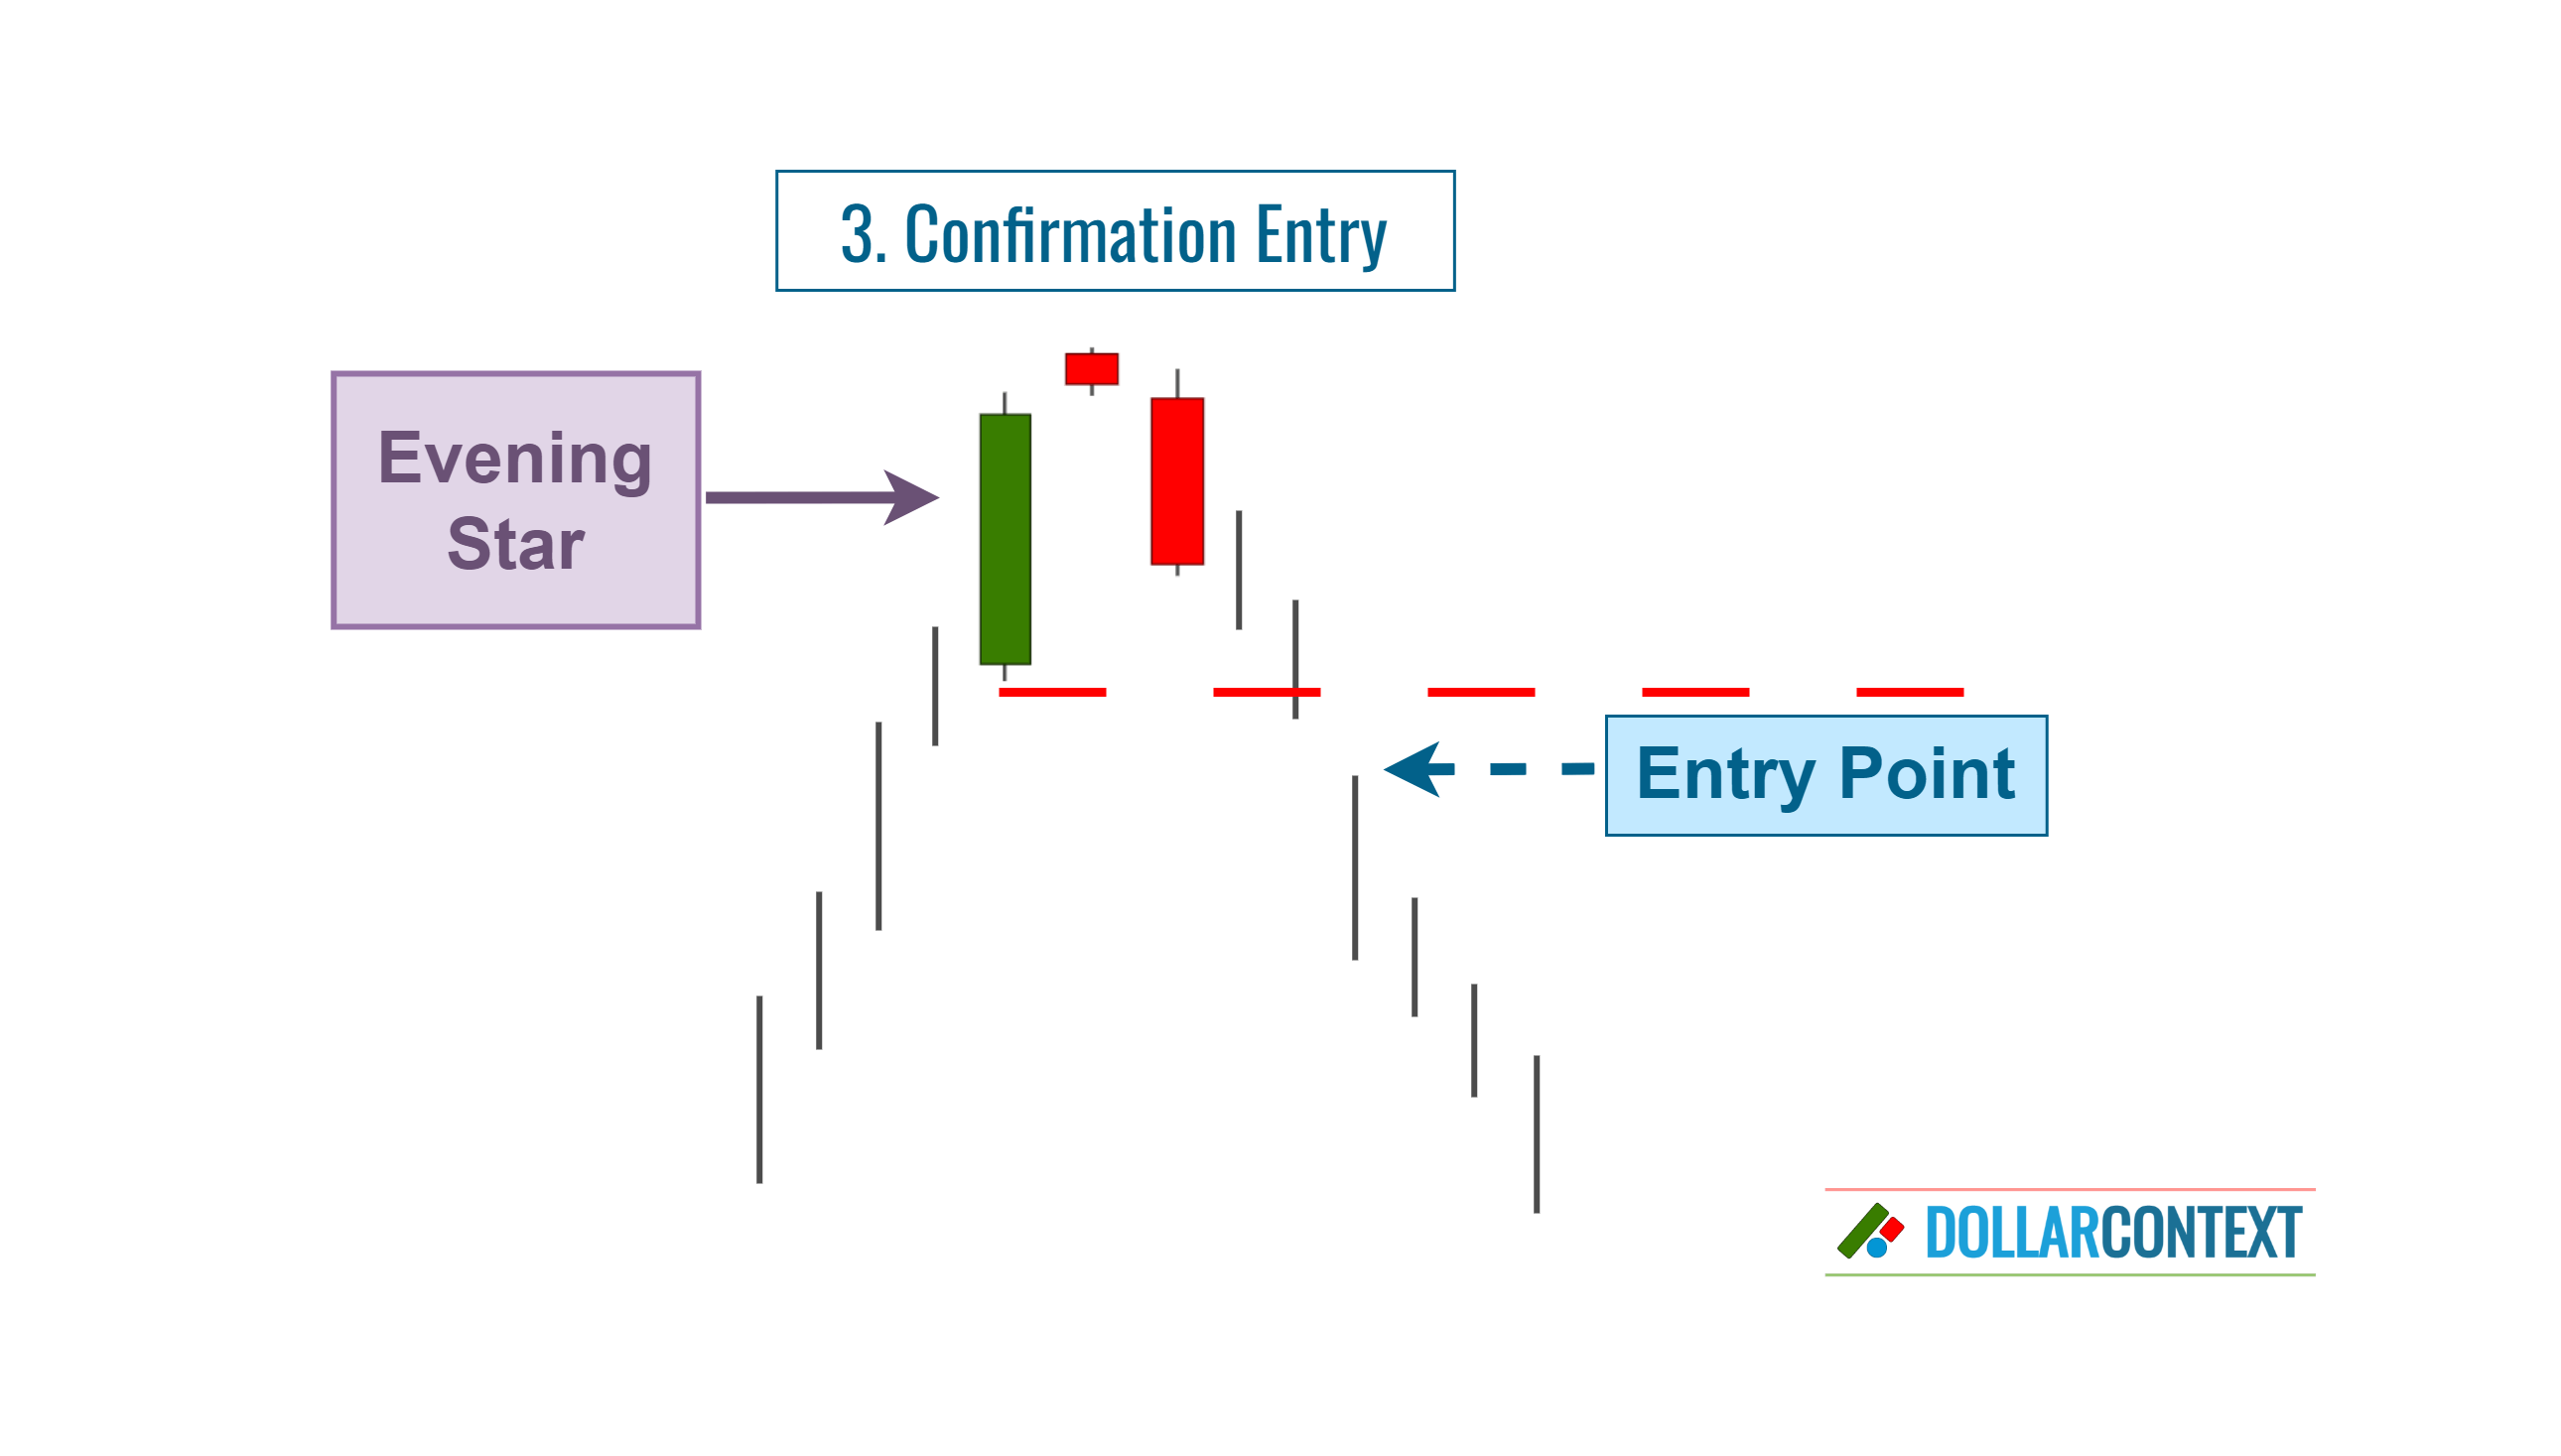
4.3 Confirmation
Following the evening star, initiate a trade once the price action confirms the onset of a new downward trend, ensuring a substantial shift in momentum before entering the market.
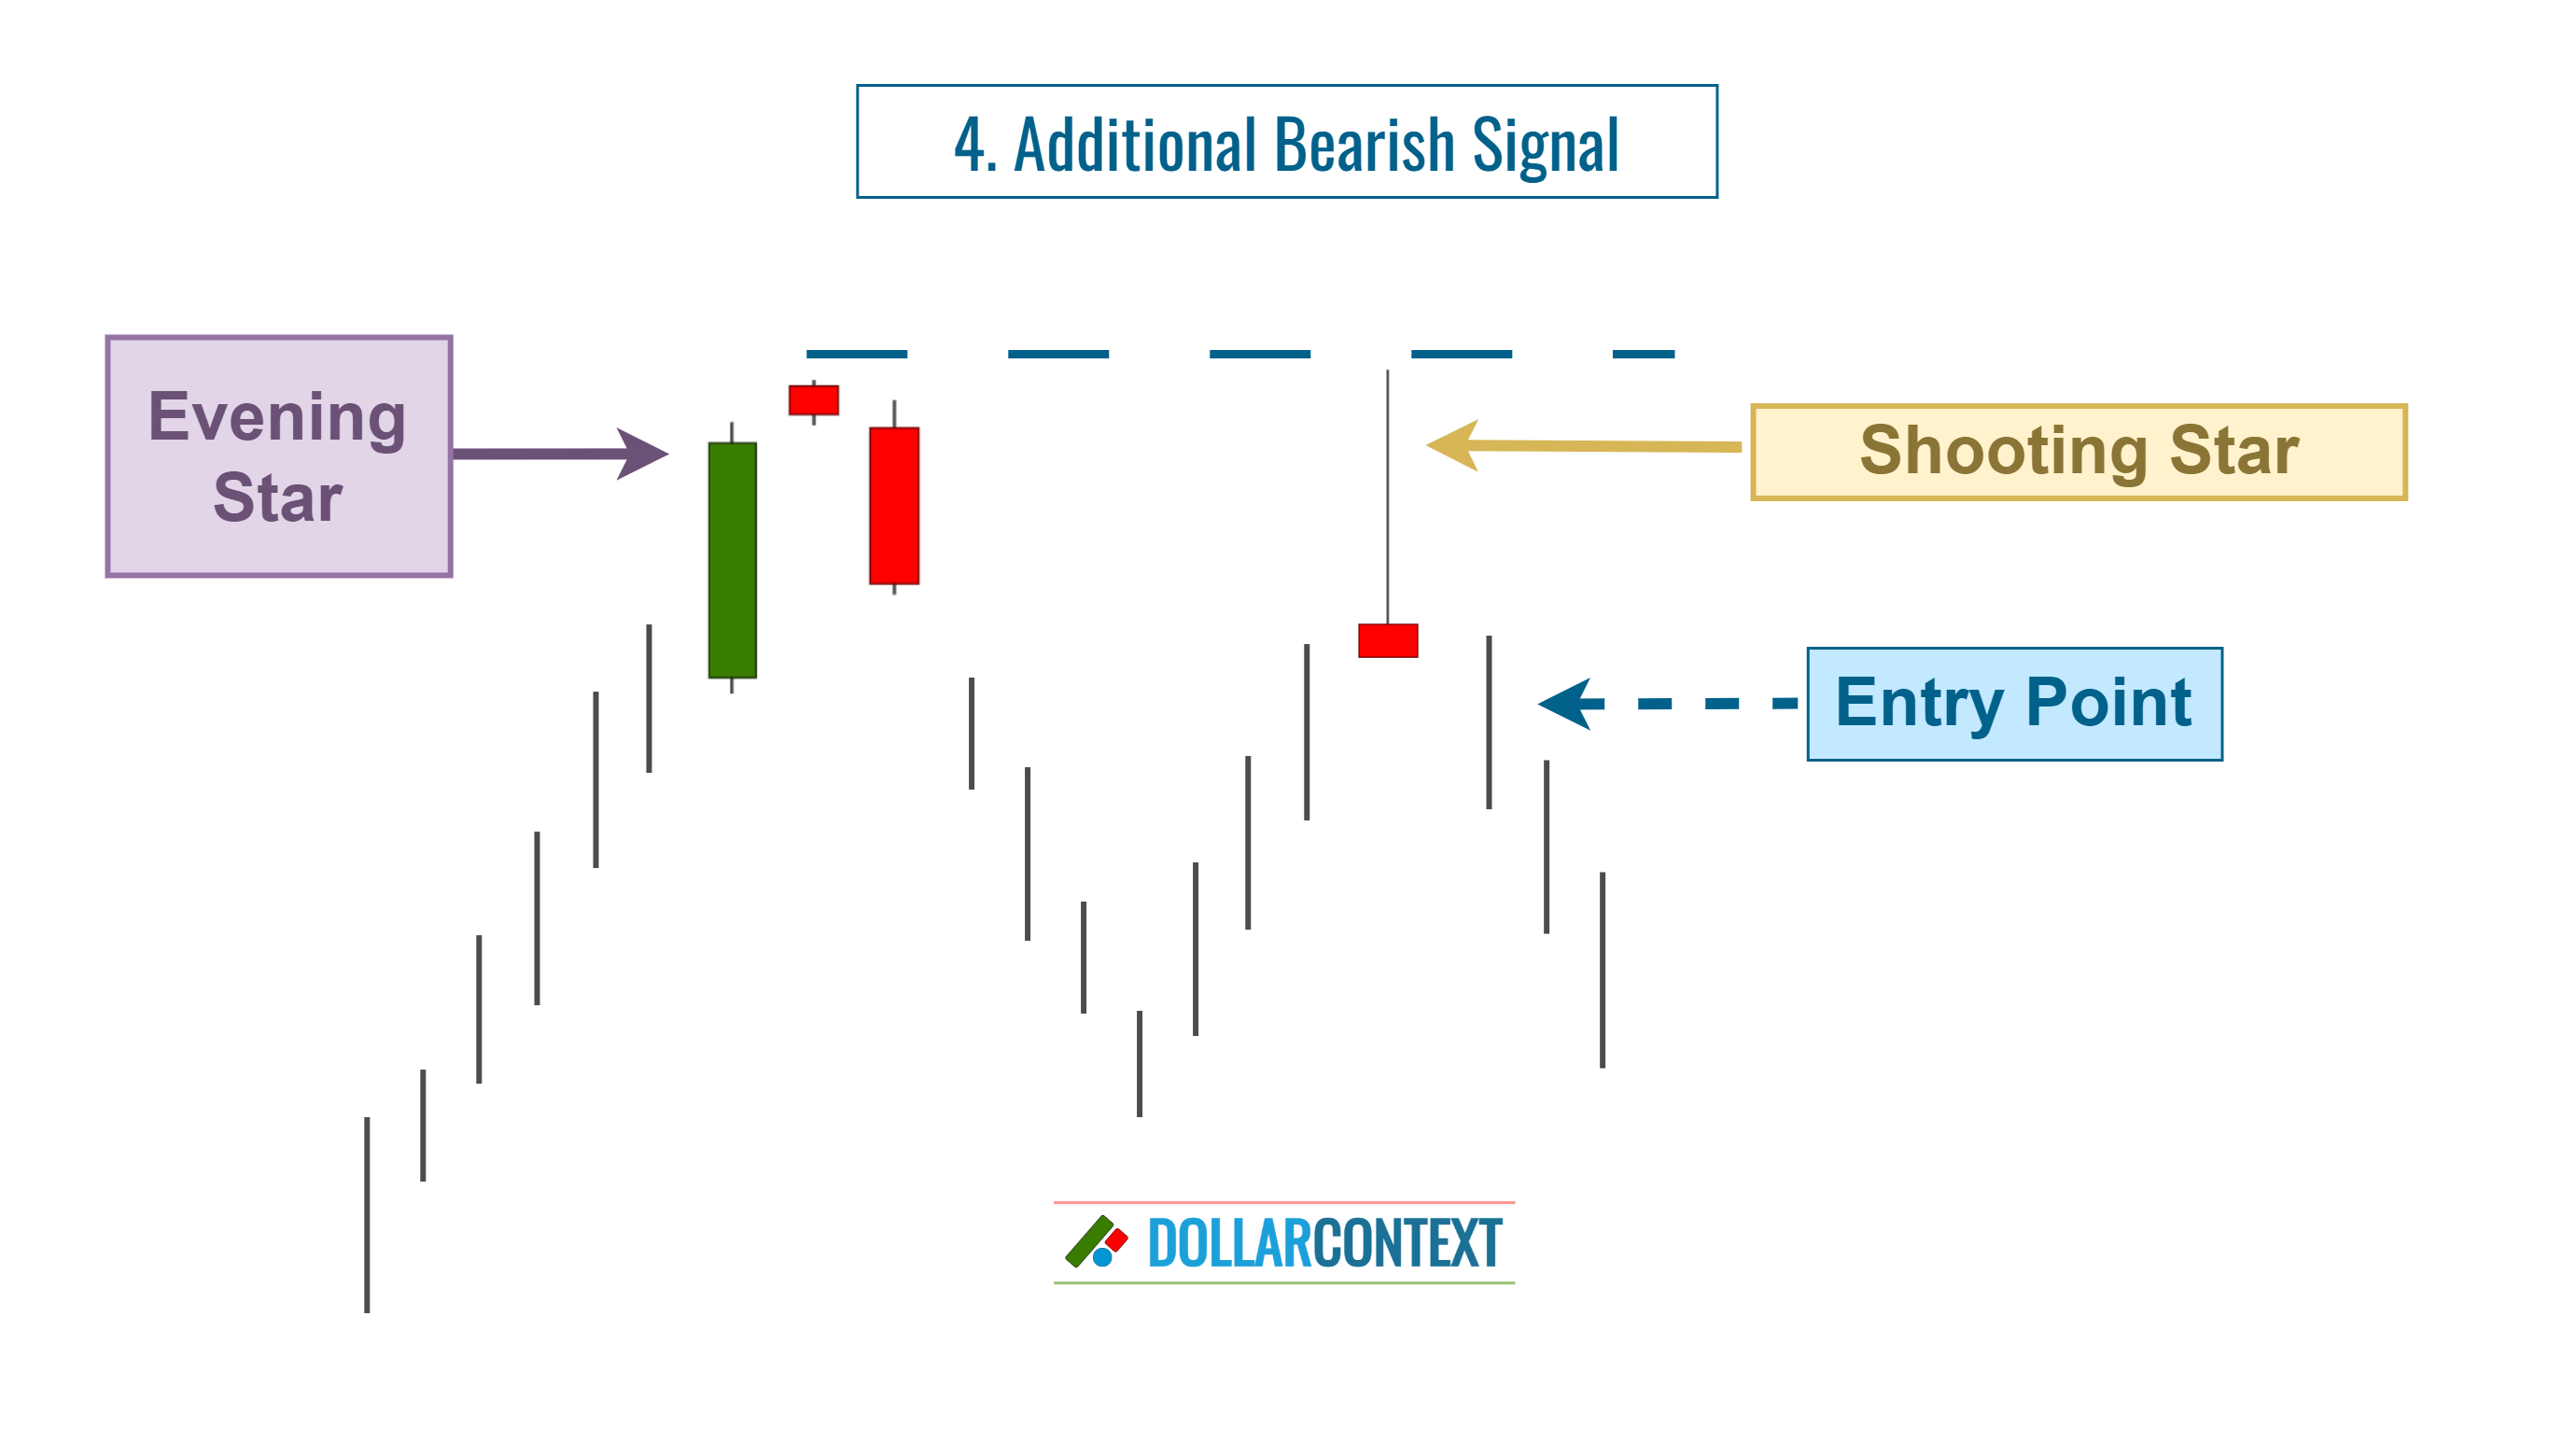
4.4 On an Additional Bearish Signal
After the evening star pattern, hold off on initiating a position until a subsequent reversal candlestick formation or indicator materializes, thereby bolstering the likelihood of a trend reversal. This might manifest as a shooting star or another reversal pattern. Be aware that the pattern that reinforces the probability of the reversal may appear before the evening star.
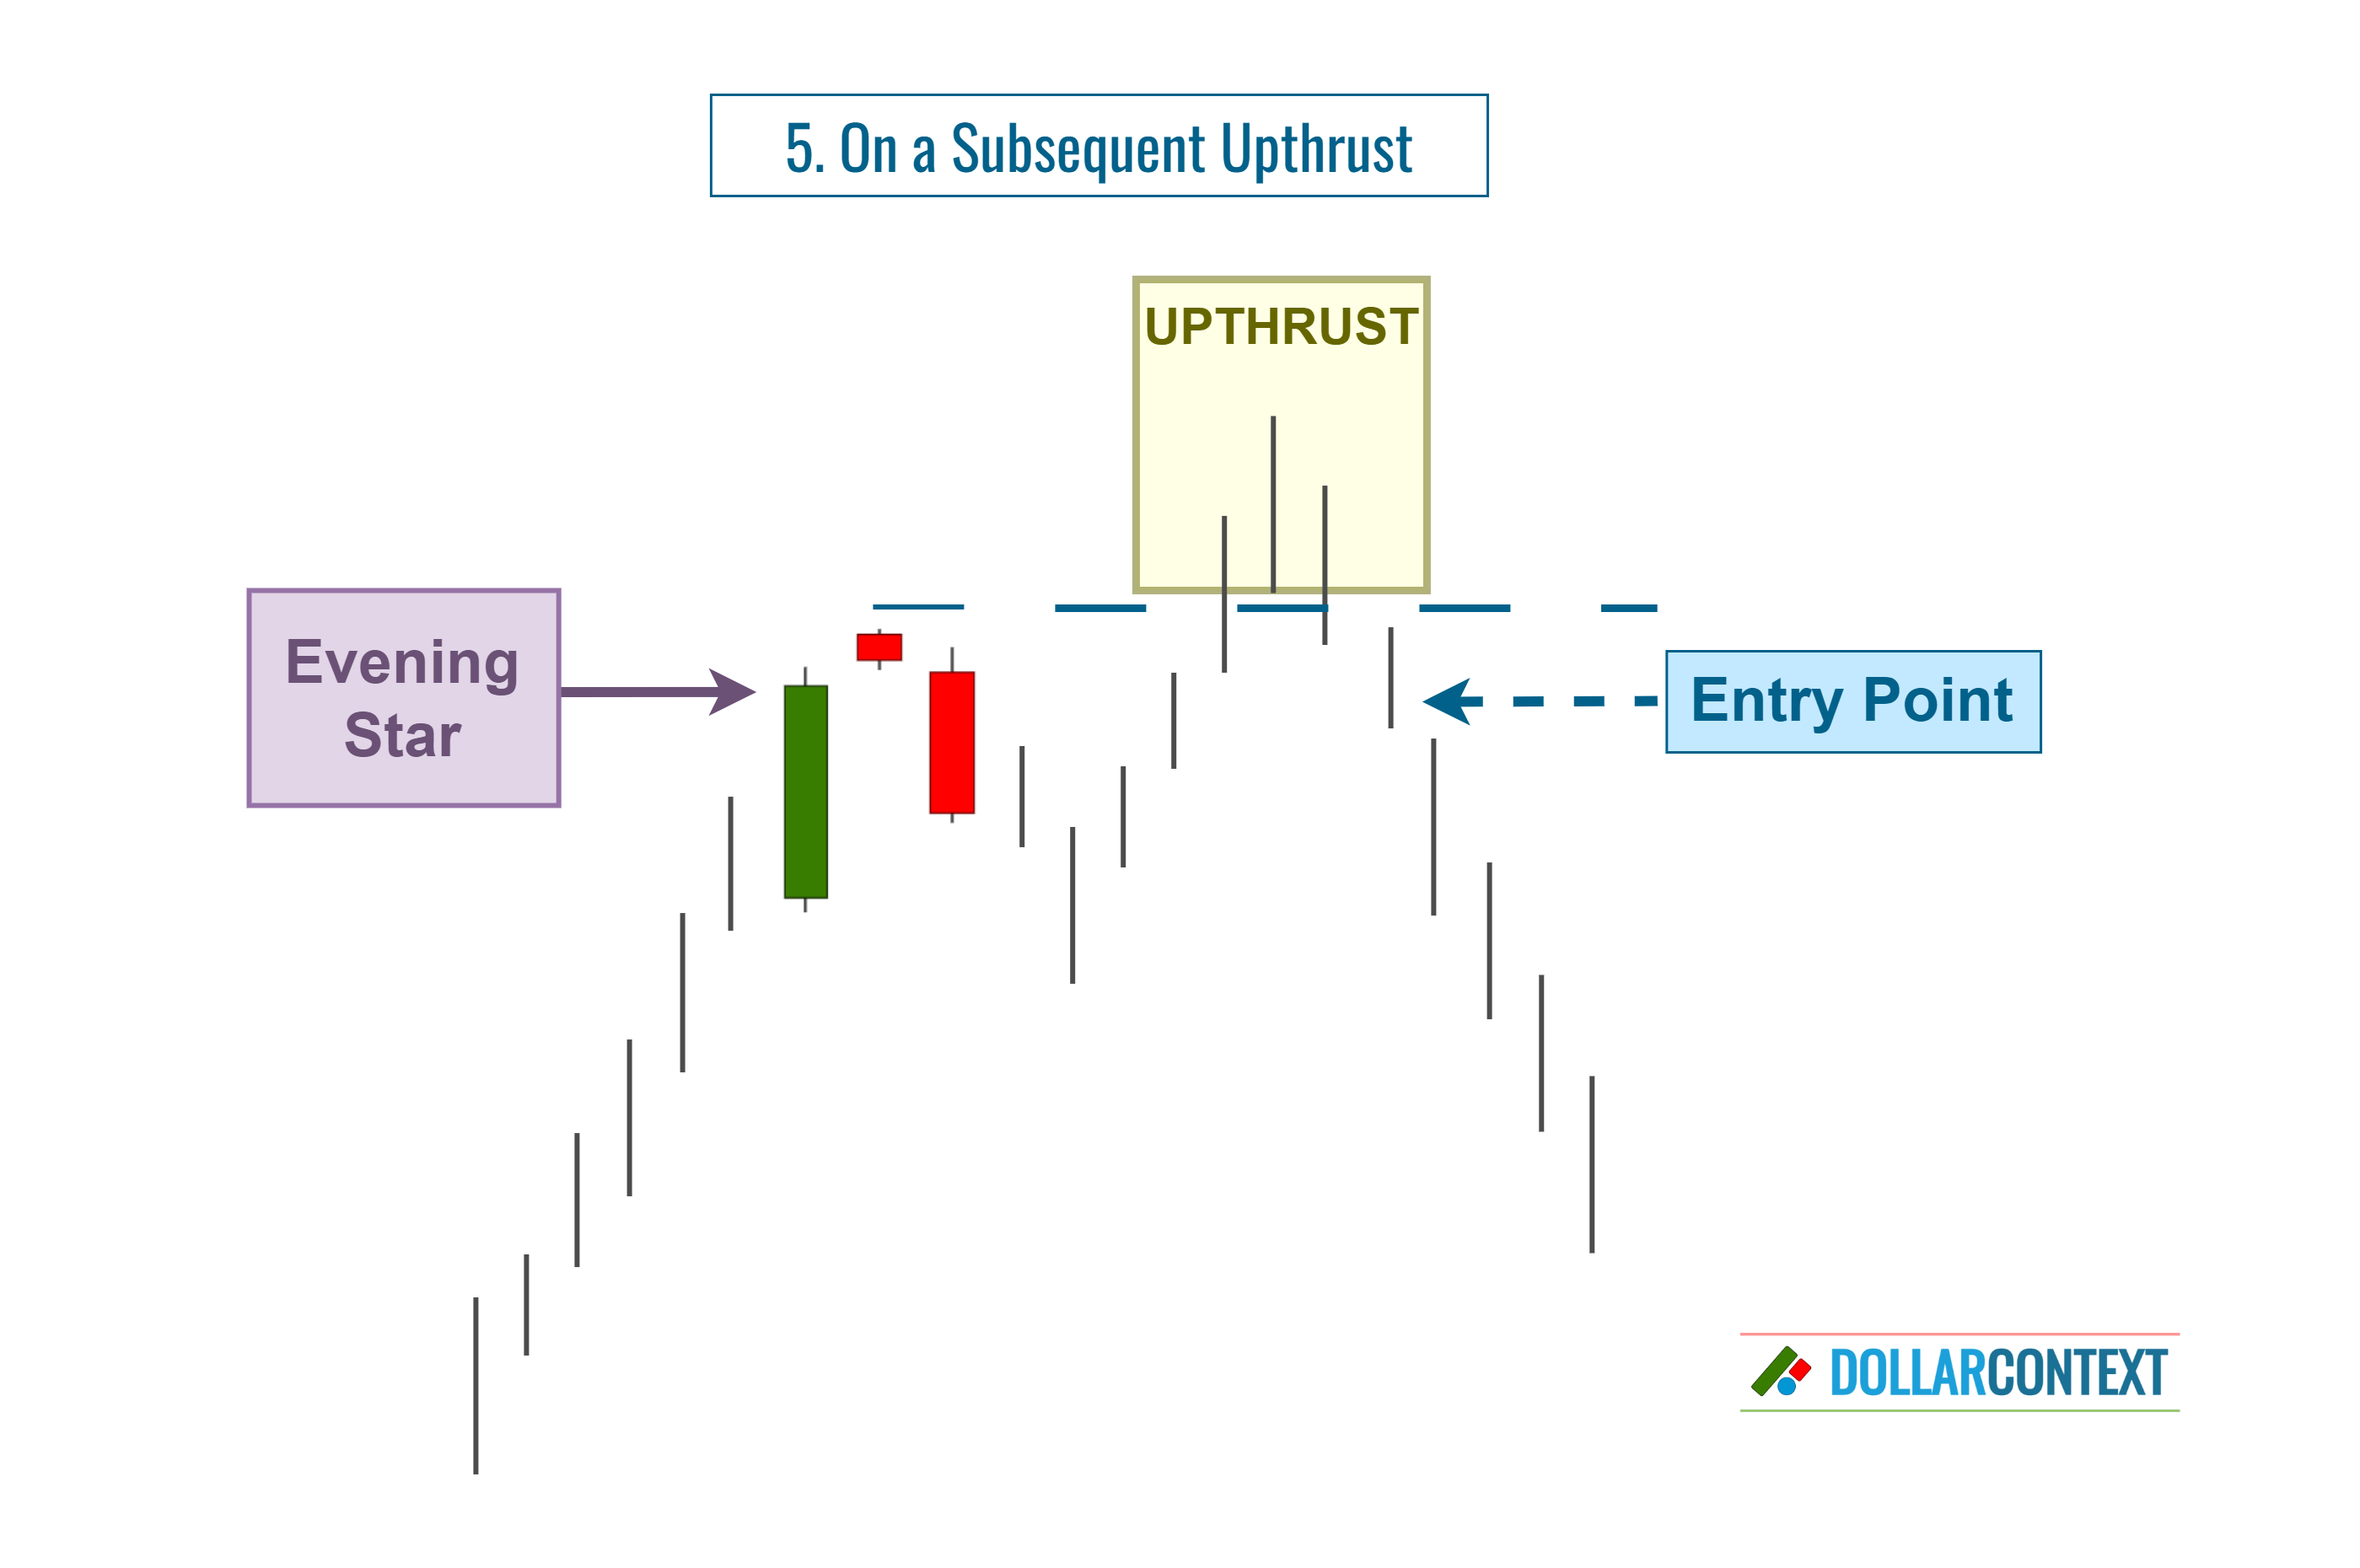
4.5 After a False Breakout (Upthrust)
An upthrust implies a situation where the market briefly breaks through a resistance level, but quickly reverses course to move in the opposite direction. Basically, it's a false upward breakout.
Upthrusts suggest that the breakout might not be sustained, and a reversal into the opposite direction could be approaching.
4.6 Mixed Strategy
A mixed approach entails initiating a short position at the first indication of an evening star formation, and then incrementally increasing that position as additional bearish indicators materialize.
5. Stop-Loss
Following an uptrend, the price range of an evening star becomes resistance. Traders usually identify those levels to determine their initial stop-loss for an evening star.
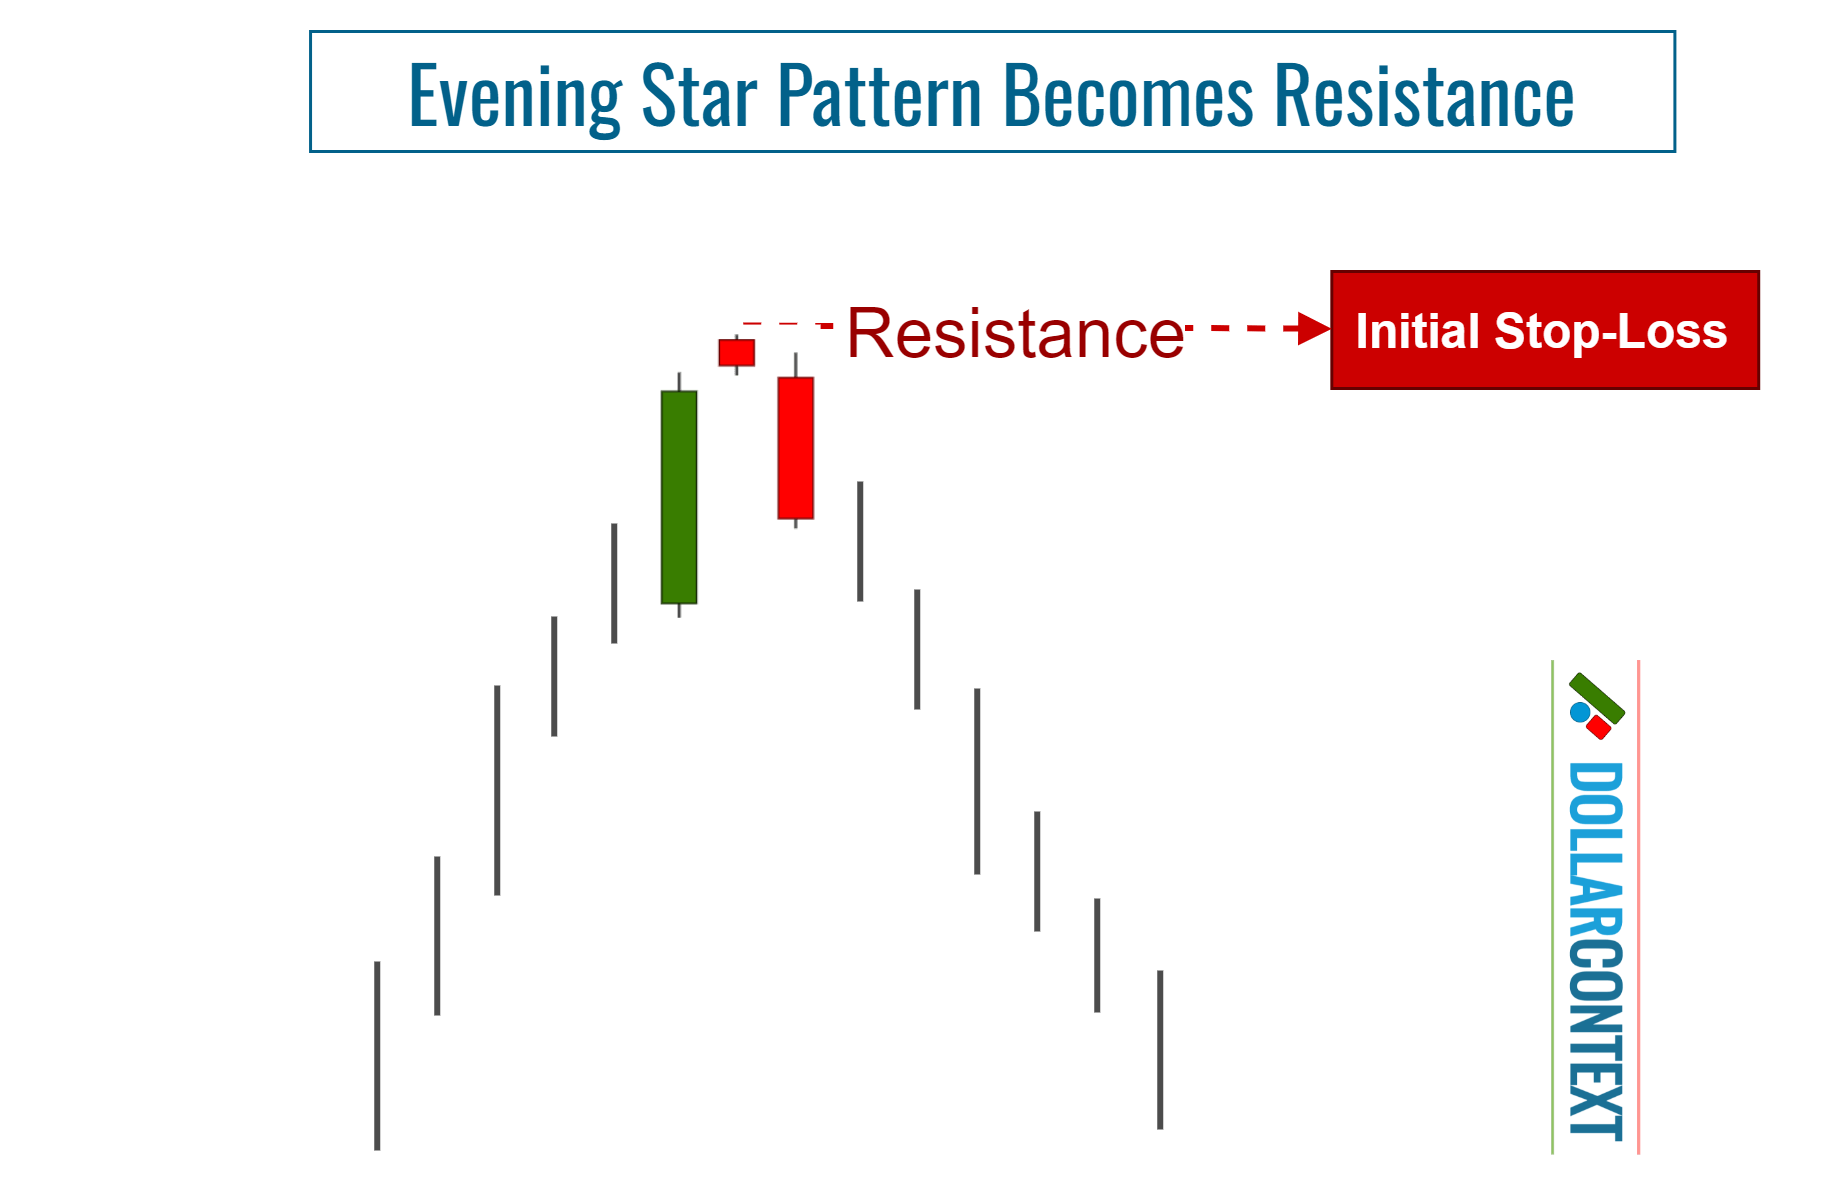
However, to safeguard against premature exits prompted by erratic market movements or deceptive breakouts, take into account the following protective measures:
- Incorporate a buffer to mitigate the effects of deceptive breakouts.
- Set a stop-loss order that activates on closing prices, which can provide a more reliable indicator than transient intra-session fluctuations.
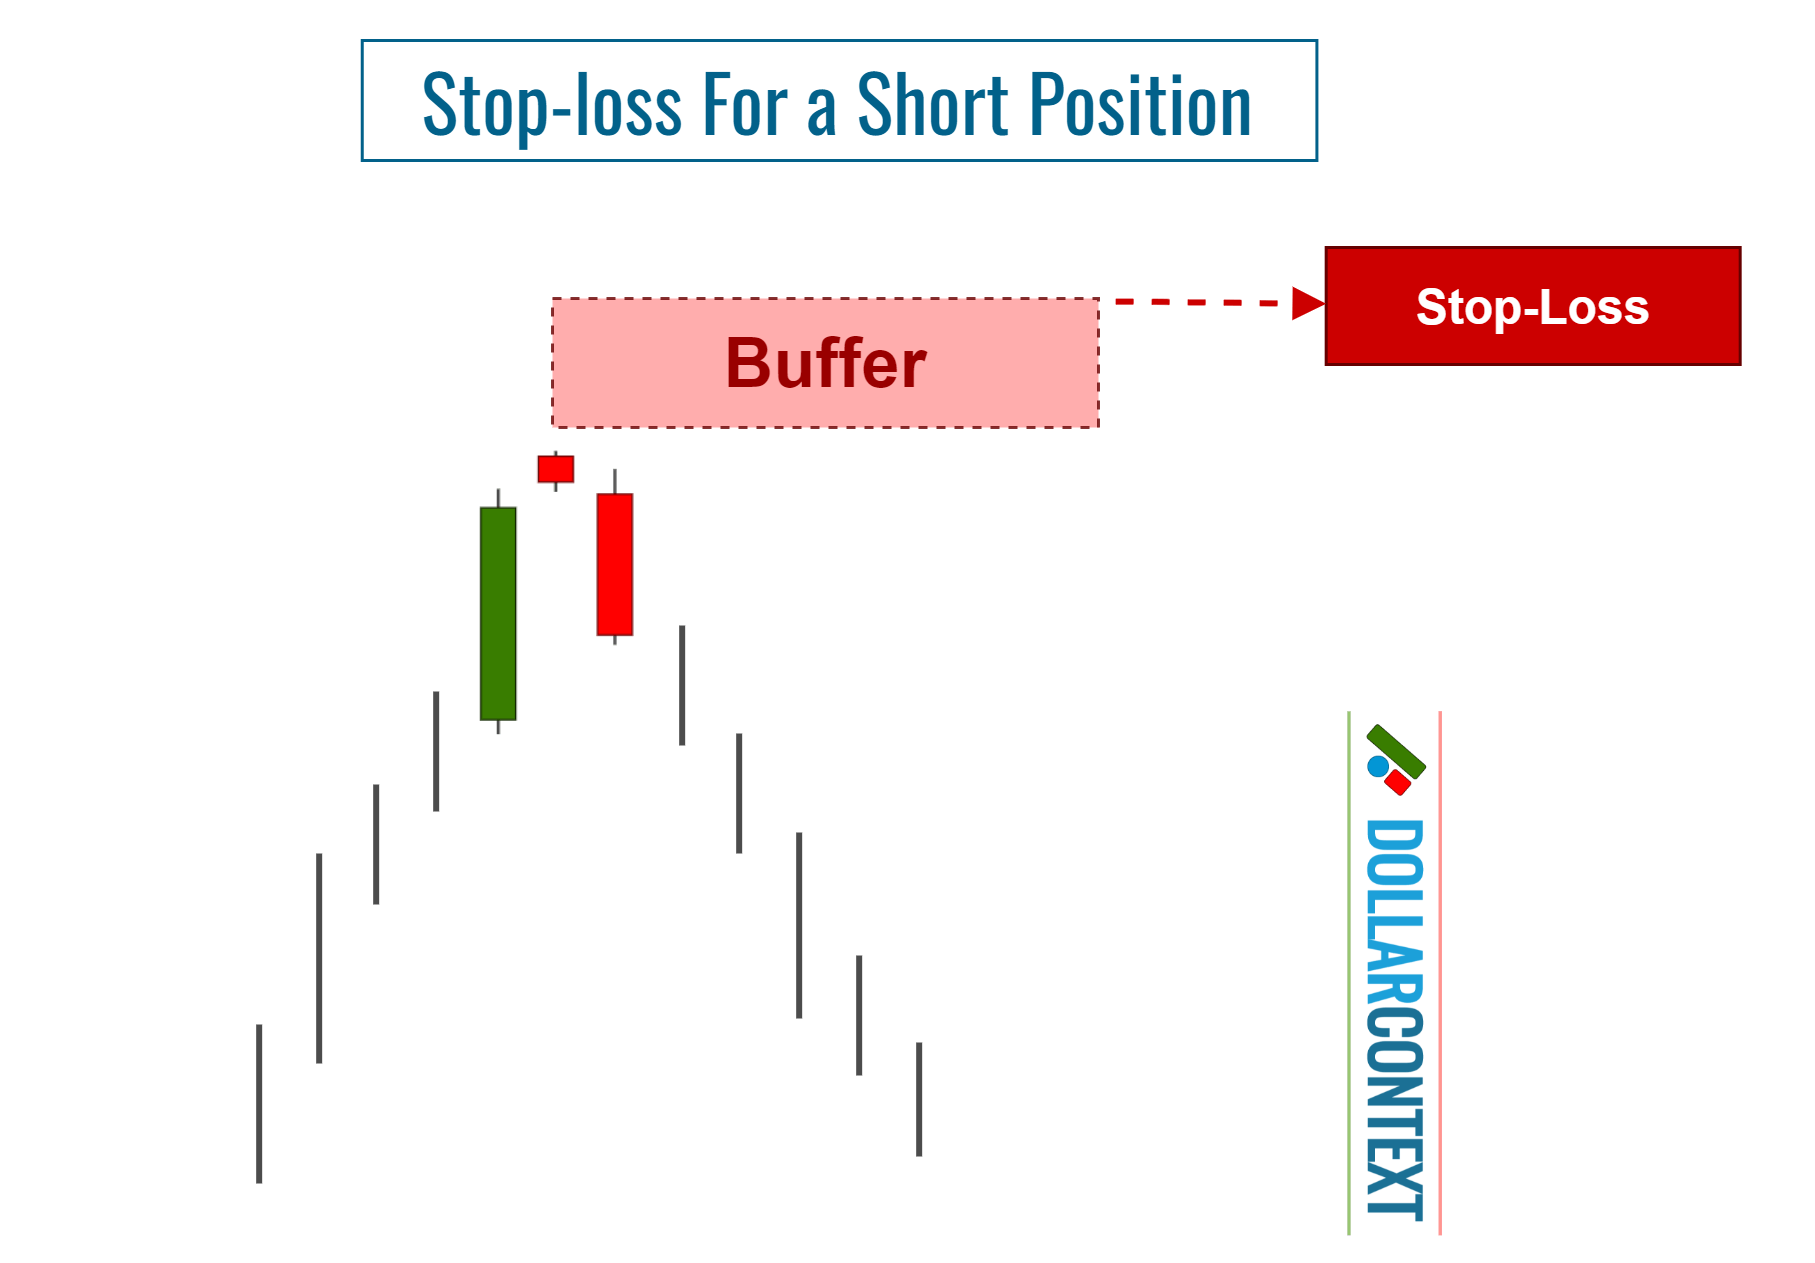
As your position progresses, additional bearish formations may emerge, reinforcing the resistance initially indicated by the evening star pattern. When this occurs, consider adjusting your stop-loss to encompass the peak levels observed within these new patterns.
6. Profit Target
Though candlestick patterns are frequently useful as signals for trend reversals and potential trade initiations, they do not inherently advise on profit-taking targets. To determine the optimal exit strategy, traders may employ additional methods such as moving average indicators, classical chart formations, or Fibonacci retracement levels.
However, if you're in a profitable trade that began with an evening star, and you observe the emergence of a bullish candlestick pattern, it could be prudent to interpret this new pattern as a cue to close your position.
7. Subtypes (Evening Doji Star and Abandoned Baby Top)
There are two distinctive types of evening stars: the evening doji star and the abandoned baby top.
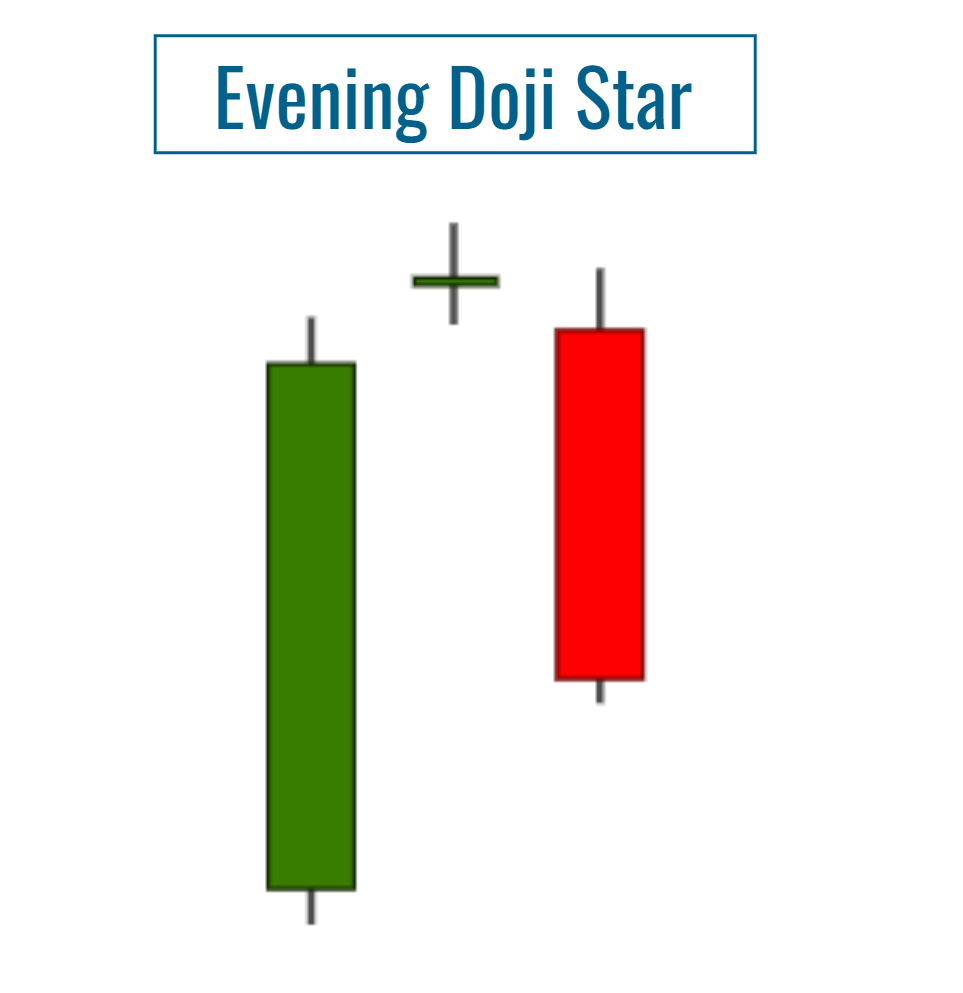
Evening Doji Star
The evening doji star stands out from the regular evening star formation. In the standard evening star, the second candlestick presents a small real body; however, in the evening doji star version, this second candlestick is replaced by a doji. This doji's inclusion intensifies the potential impact of the pattern.
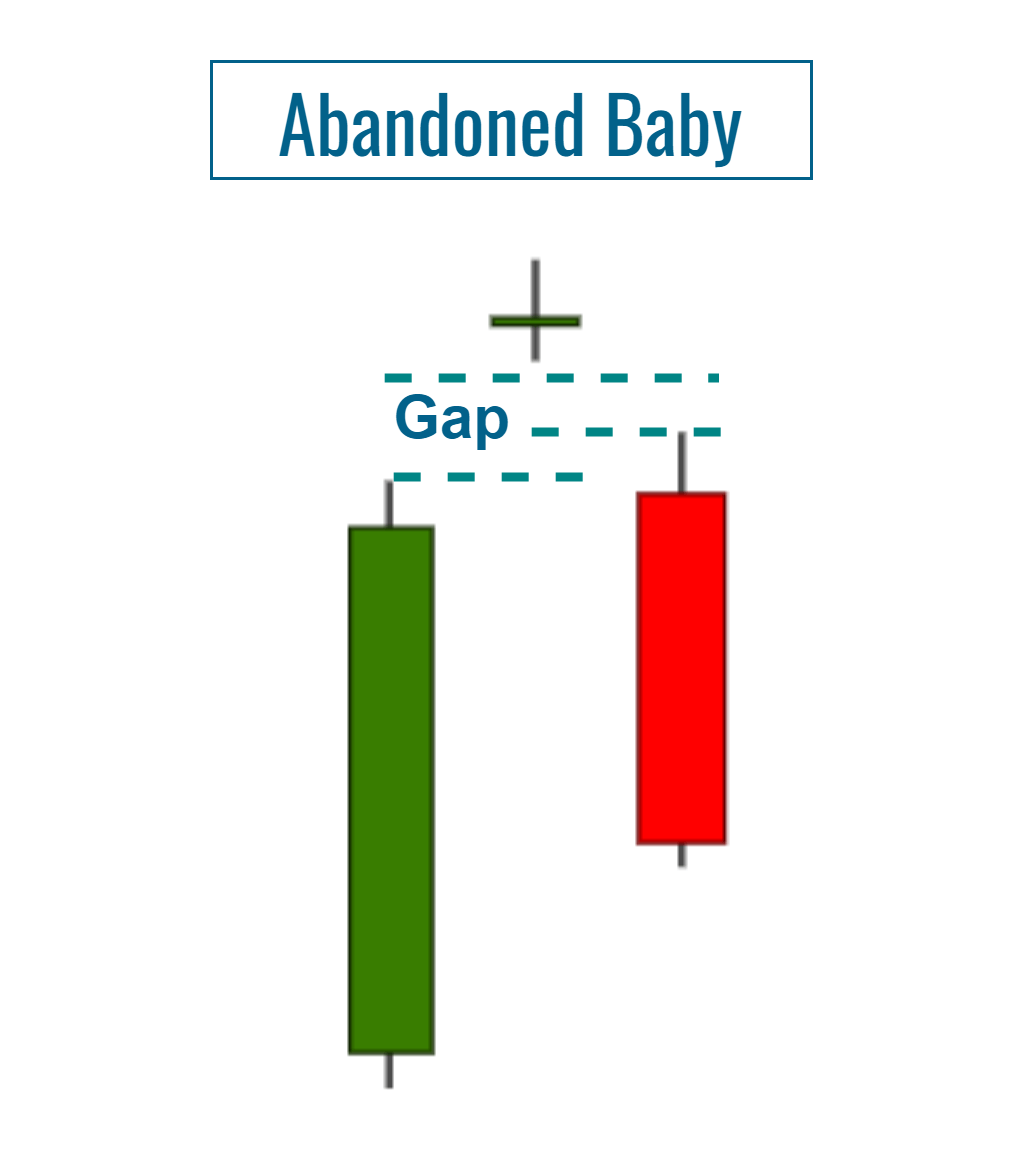
Abandoned Baby Top
If the star of this pattern is a doji that gaps higher (with its shadows not intersecting the previous session's shadows), and it is succeeded by a bearish candlestick that gaps lower (again, without its shadows overlapping the doji), this formation is seen as a potent indicator of a significant trend reversal at the peak. Known as the "abandoned baby top," this pattern is particularly uncommon.
8. Examples
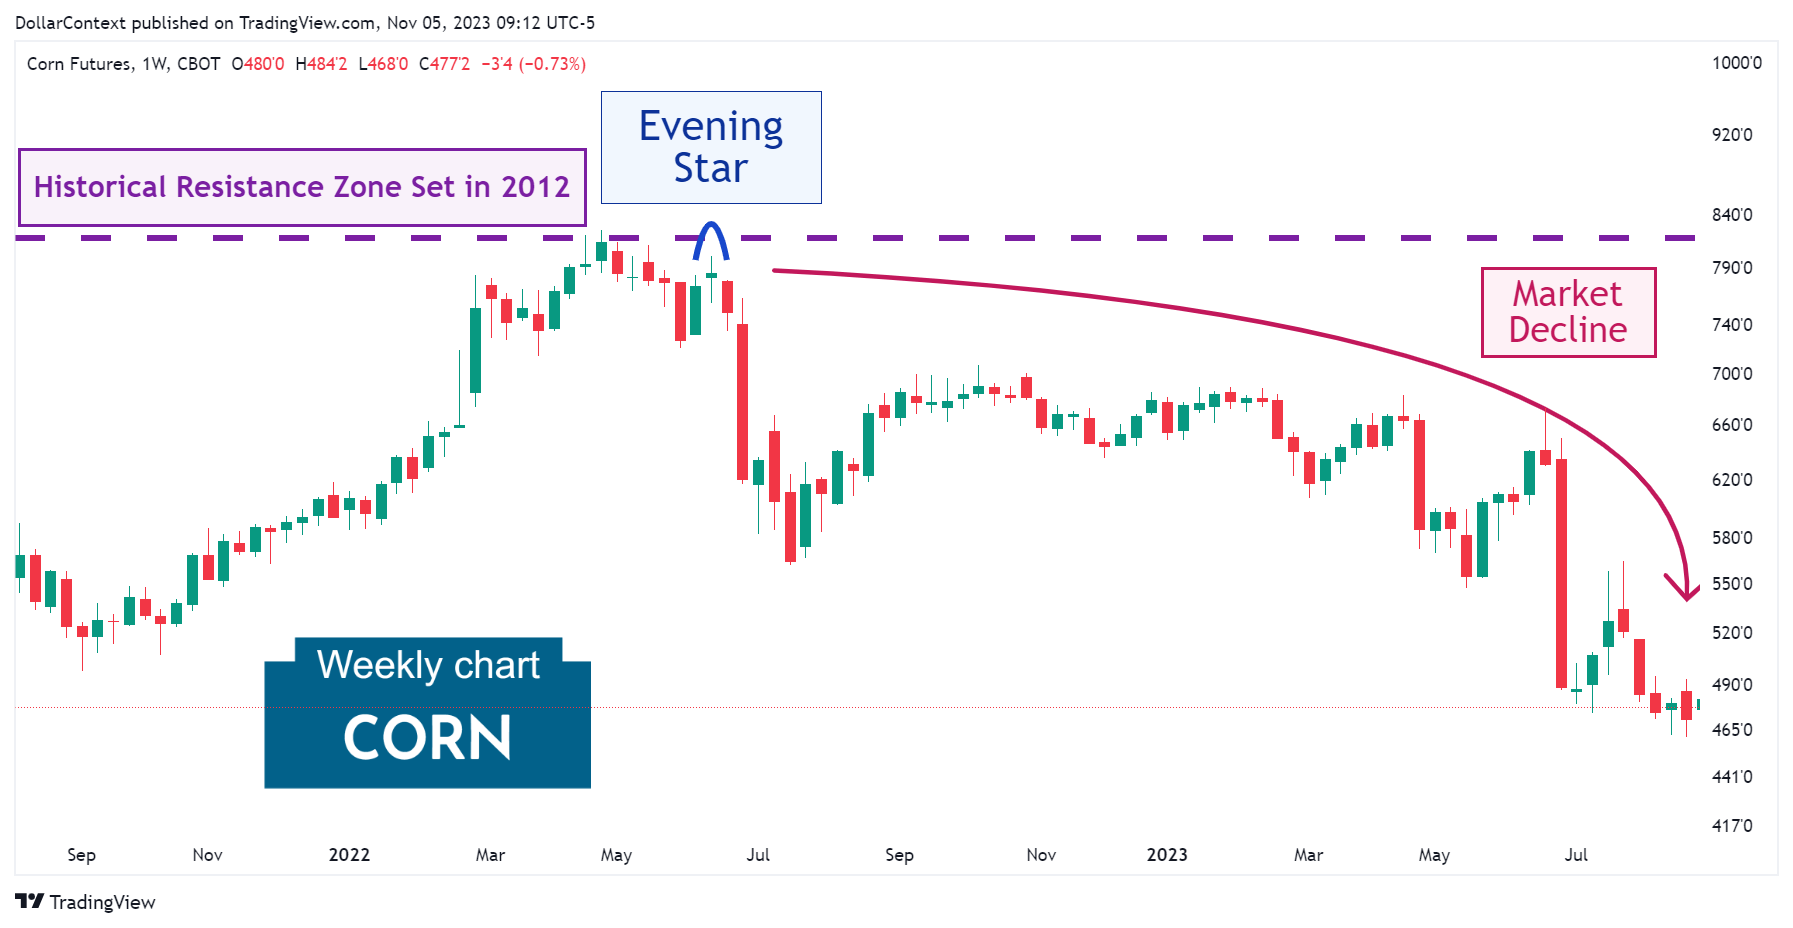
8.1 Corn Futures (Weekly Chart)
The chart below illustrates how the corn market displayed a morning star in late June 2022. Considering that the opening and closing prices of the second candle of the pattern are nearly identical, the formation may also be classified as an evening doji star.
The evening star emerged near a historical resistance zone set in 2012. As mentioned in section 2 (context), this heightened the likelihood of a reversal at the top and the beginning of a downward trend.
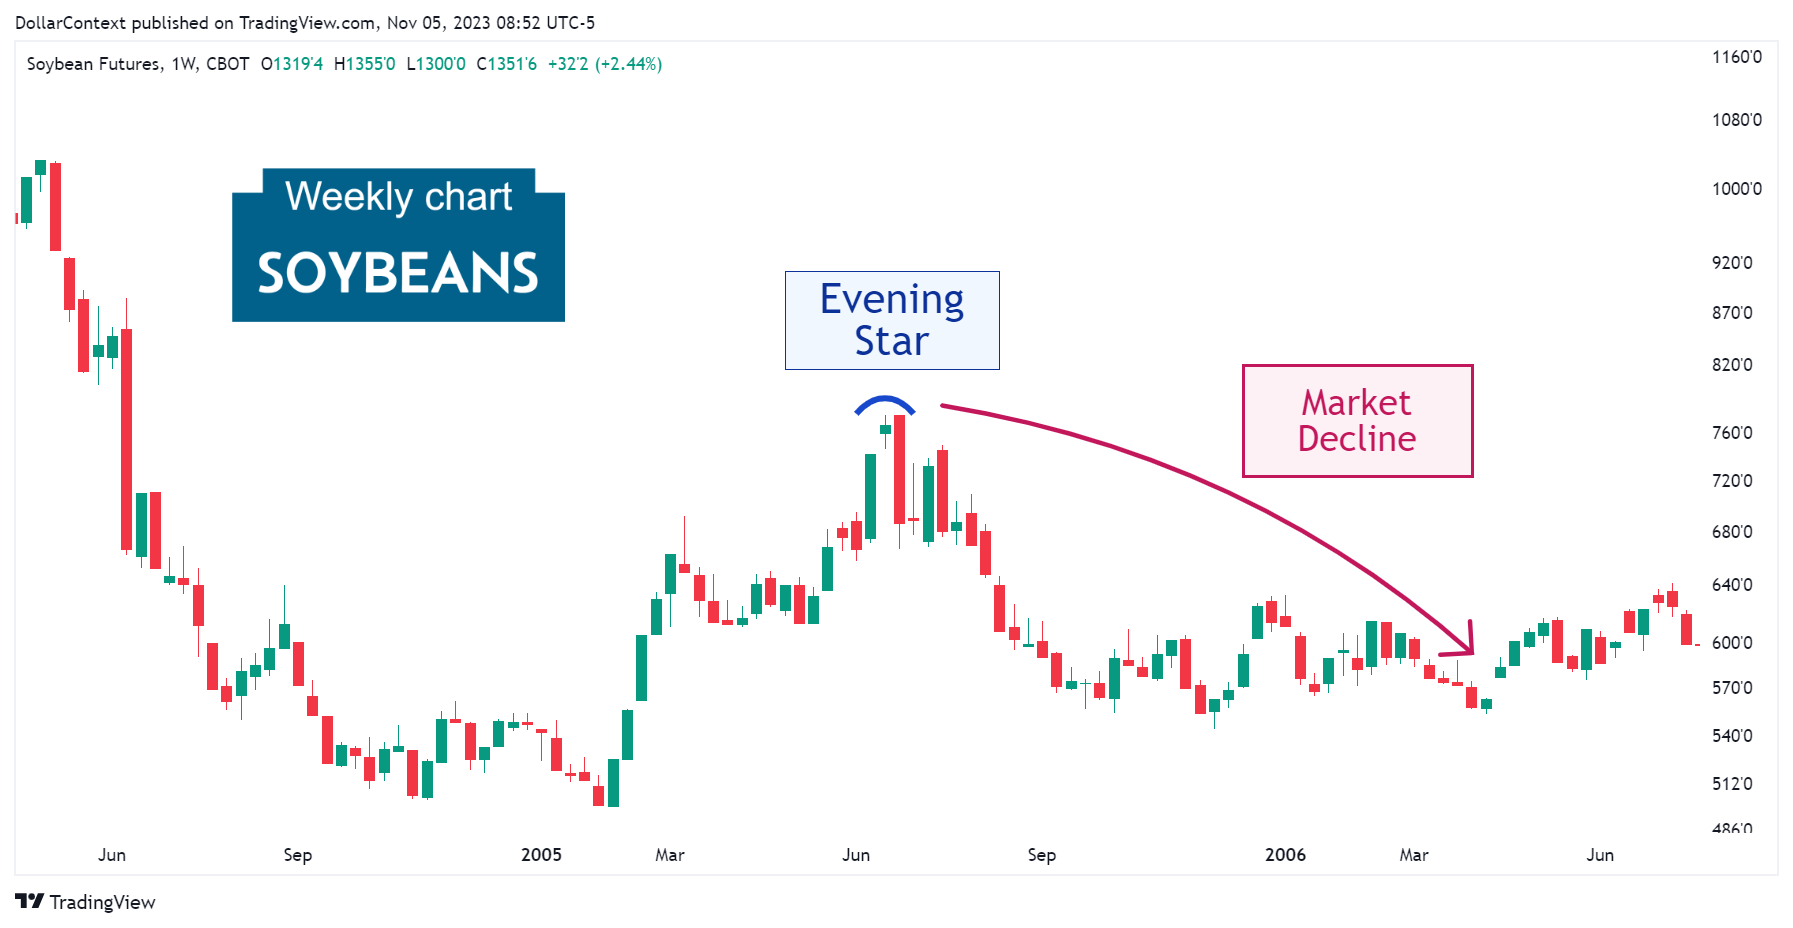
8.2 Soybean Futures (Weekly Chart)
In June 2005, soybean prices exhibited an evening star pattern. Given that the uptrend leading up to it was not distinctly pronounced, it could cast some doubt on the pattern's reliability as an indicator of a reversal.
Eventually, the market saw an initial drop and then settled into an extended period of sideways trading.
8.3 More Examples (Case Studies)
- Case Study 0005: Evening Star Signals the End of a Market Correction (S&P 500)
- Case Study 0009: Evening Star Transitions Into a Consolidating Phase (S&P 500)
- Case Study 0010: Evening Star and Shooting Star Patterns Yield Immediate Results (AUD/USD)
- Case Study 0019: Long Upper Shadow and Shooting Star (AUD/USD)
- Case Study 0025: Evening Star, Long Upper Shadow, Engulfing Pattern, and Long Red Real Body (EUR/USD)
- Case Study 0027: Evening Star and Bearish Engulfing Pattern (DXY)


