Evening Star: Implications in Different Market Scenarios
We discuss the implications of the evening star pattern in different market scenarios, including uptrends and lateral movements.

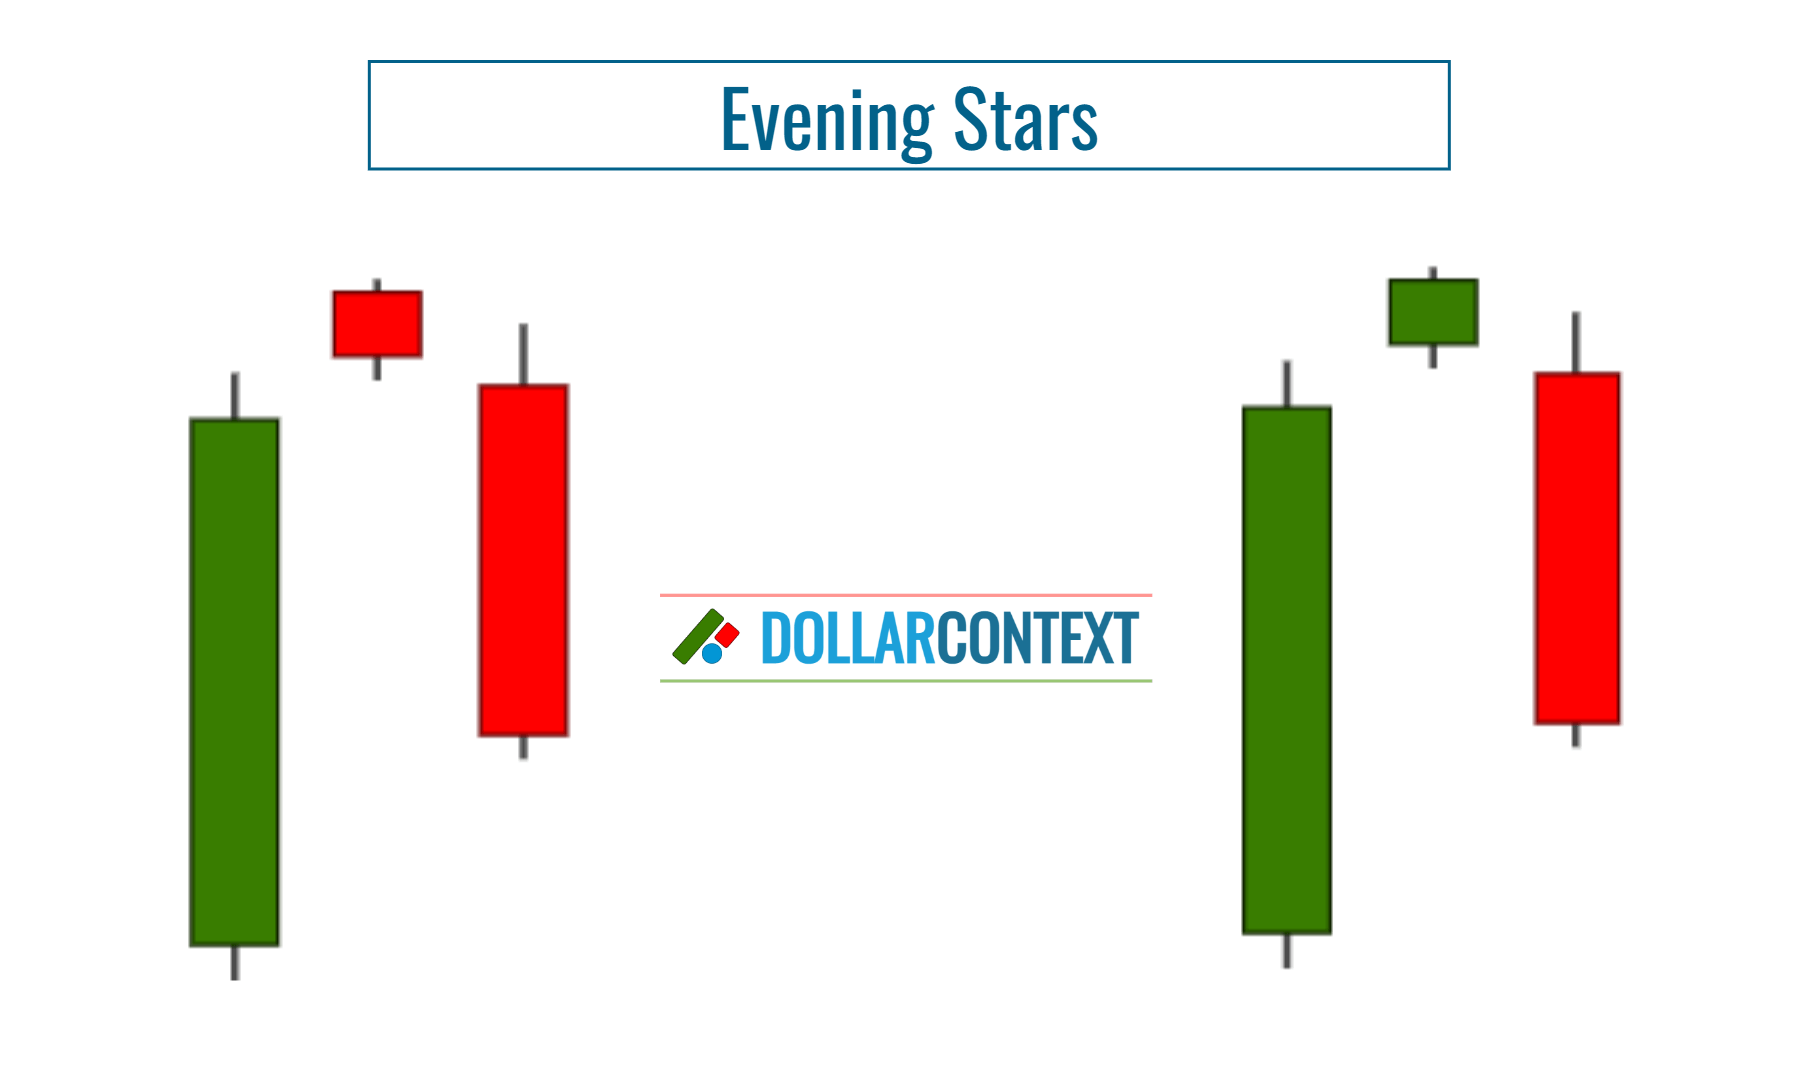
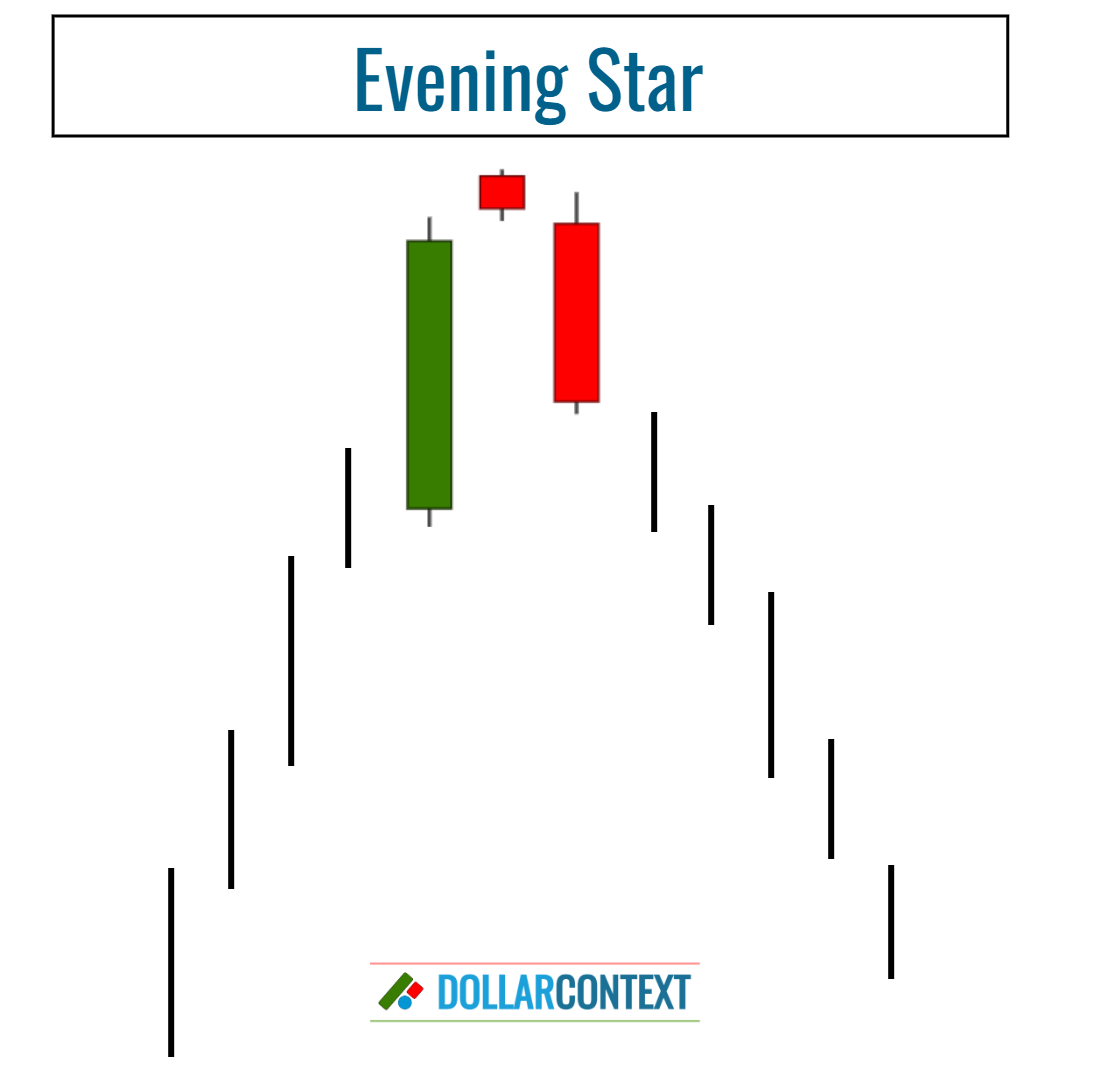
In the realm of Japanese candlestick charting, the configuration of an evening star presents three distinct candlesticks:
- The first candle features a lengthy green body with minimal or absent upper wick.
- The second candle has a modest body size. Ideally, it should open higher than the closing price of the first candlestick. This suggests that the uptrend is persisting but losing steam. The body of this candle can be either red or green.
- The concluding candle is a bearish one, characterized by a long red body with minimal or no upper wick. Ideally, this candle should open at a price lower than the second candlestick's closing price and close deep within the first candlestick's body, thereby signaling a possible trend reversal.
Evening Star: Significance in Different Scenarios
1. Trend-Driven Market vs. Sideways Action
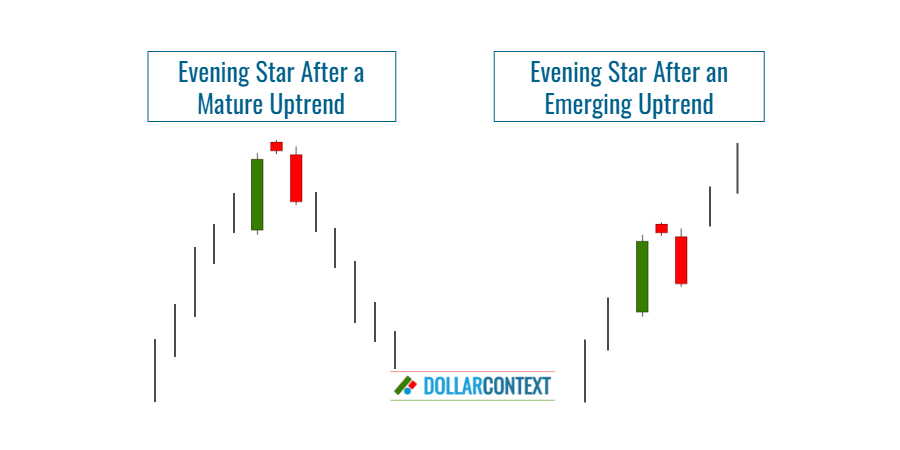
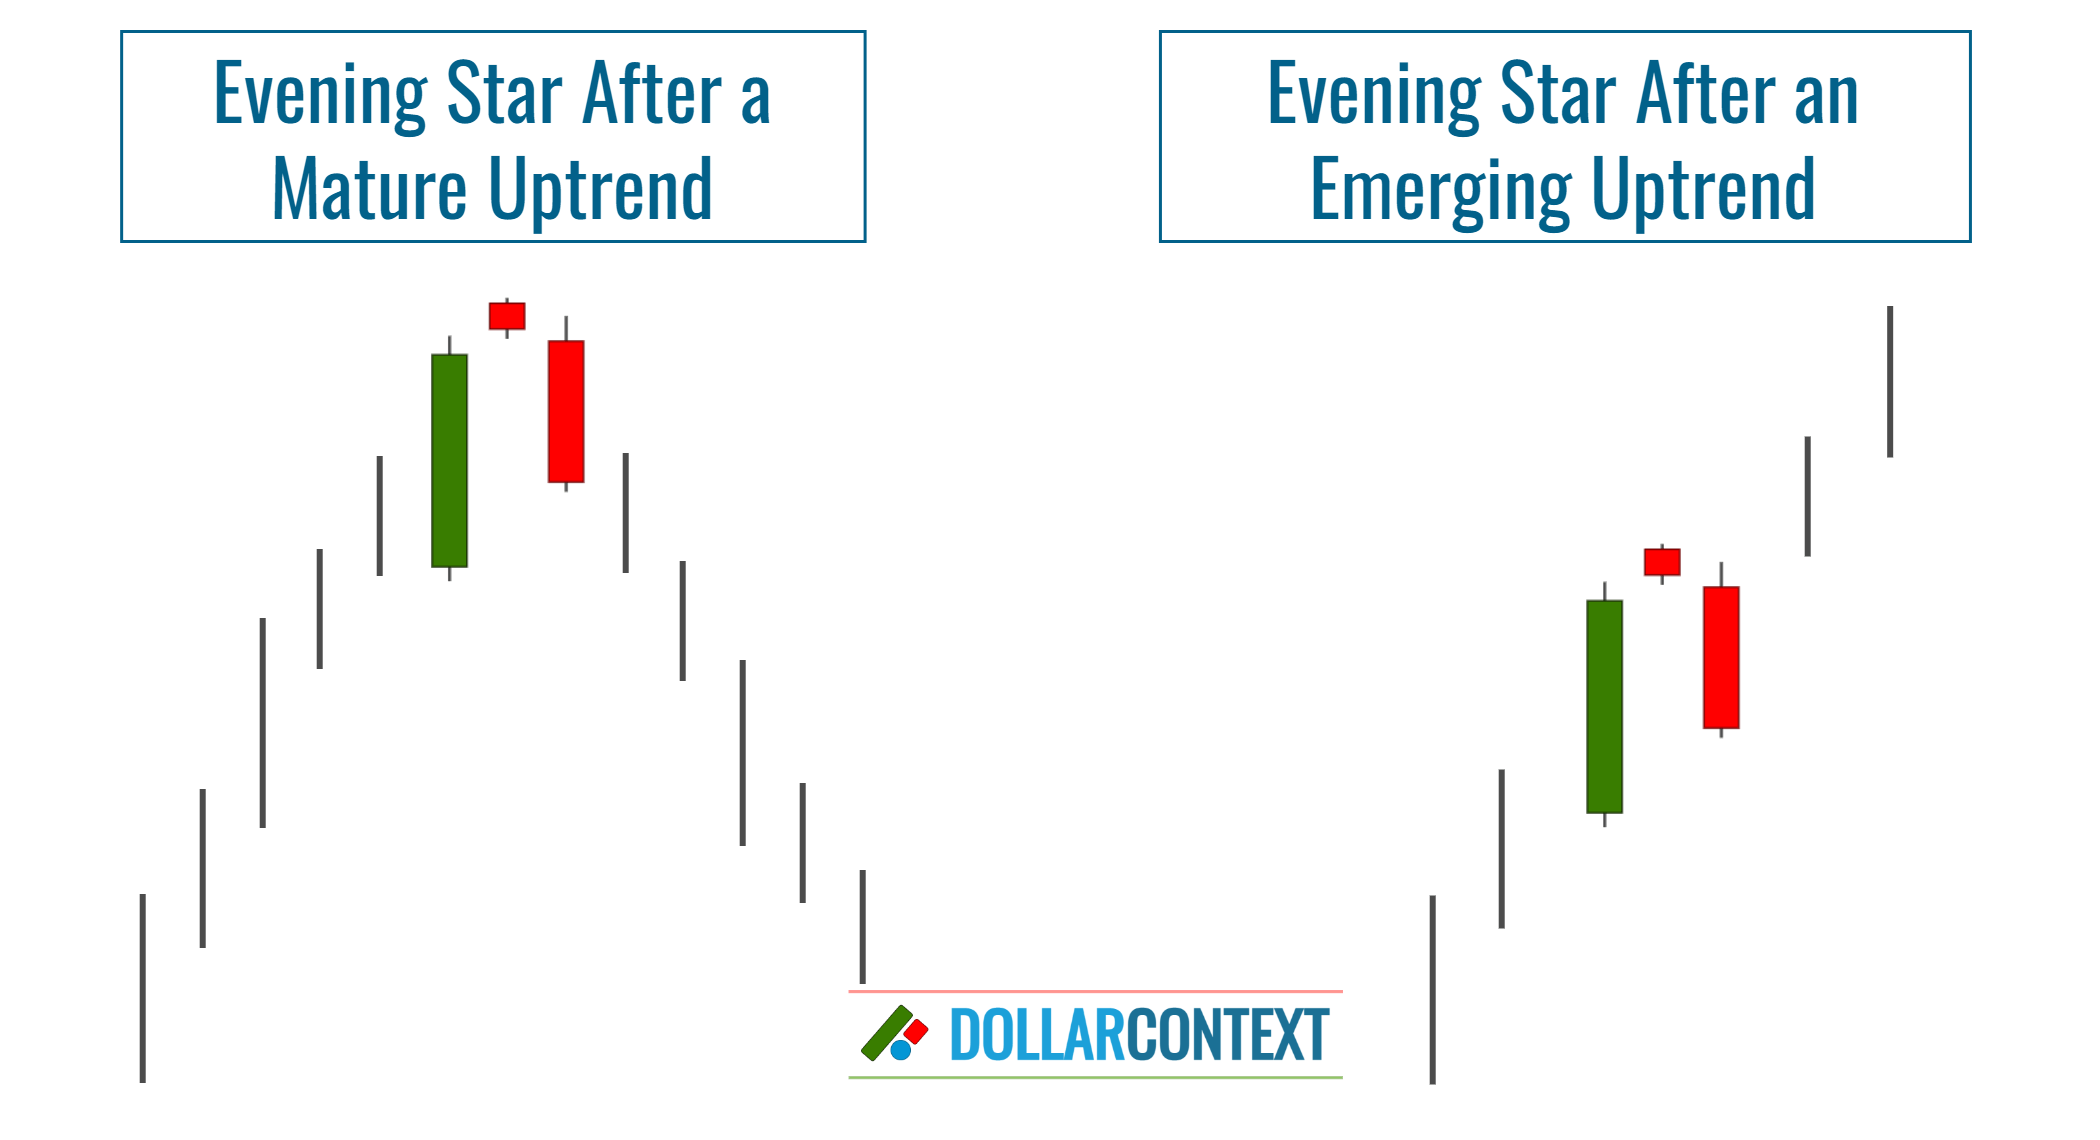
The emergence of an evening star following the advanced stage of an uptrend suggests a possible shift in market direction.
An essential aspect of interpreting the evening star is determining its position within the context of the ongoing trend. The included illustration underscores this point by showing that an evening star pattern emerging after a considerable upward movement may indicate a market top. Conversely, if the pattern appears early in a rally, the likelihood of it marking the peak is reduced.
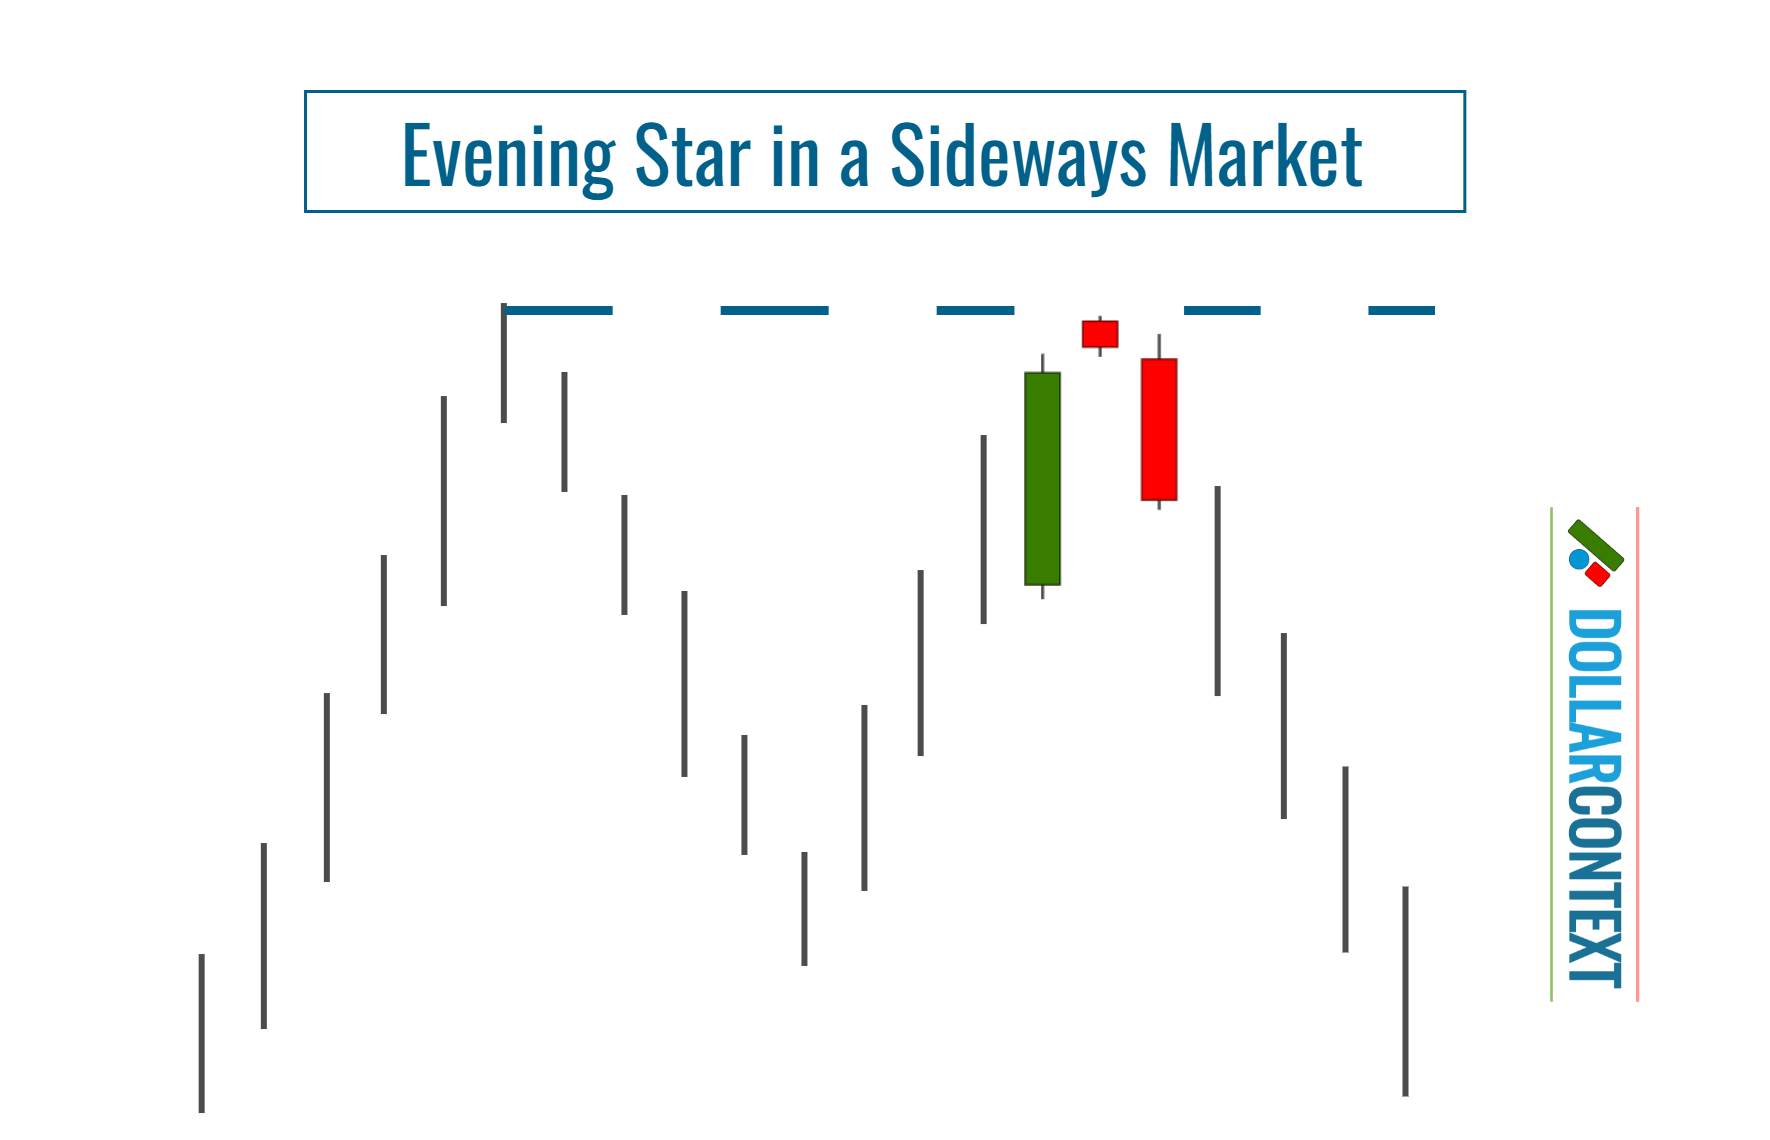
In sideways trading conditions, an evening star usually lacks relevance. Yet, if it emerges near the upper boundary of a wide trading range, it could indicate a potential shift back to the range's lower limit.
2. Variations of an Evening Star
The illustrations and guidelines provided above showcase the classic or textbook manifestation of the evening star pattern. However, it's important to note that in actual trading scenarios, less-than-perfect versions of this pattern can also be significant, depending on specific market conditions.
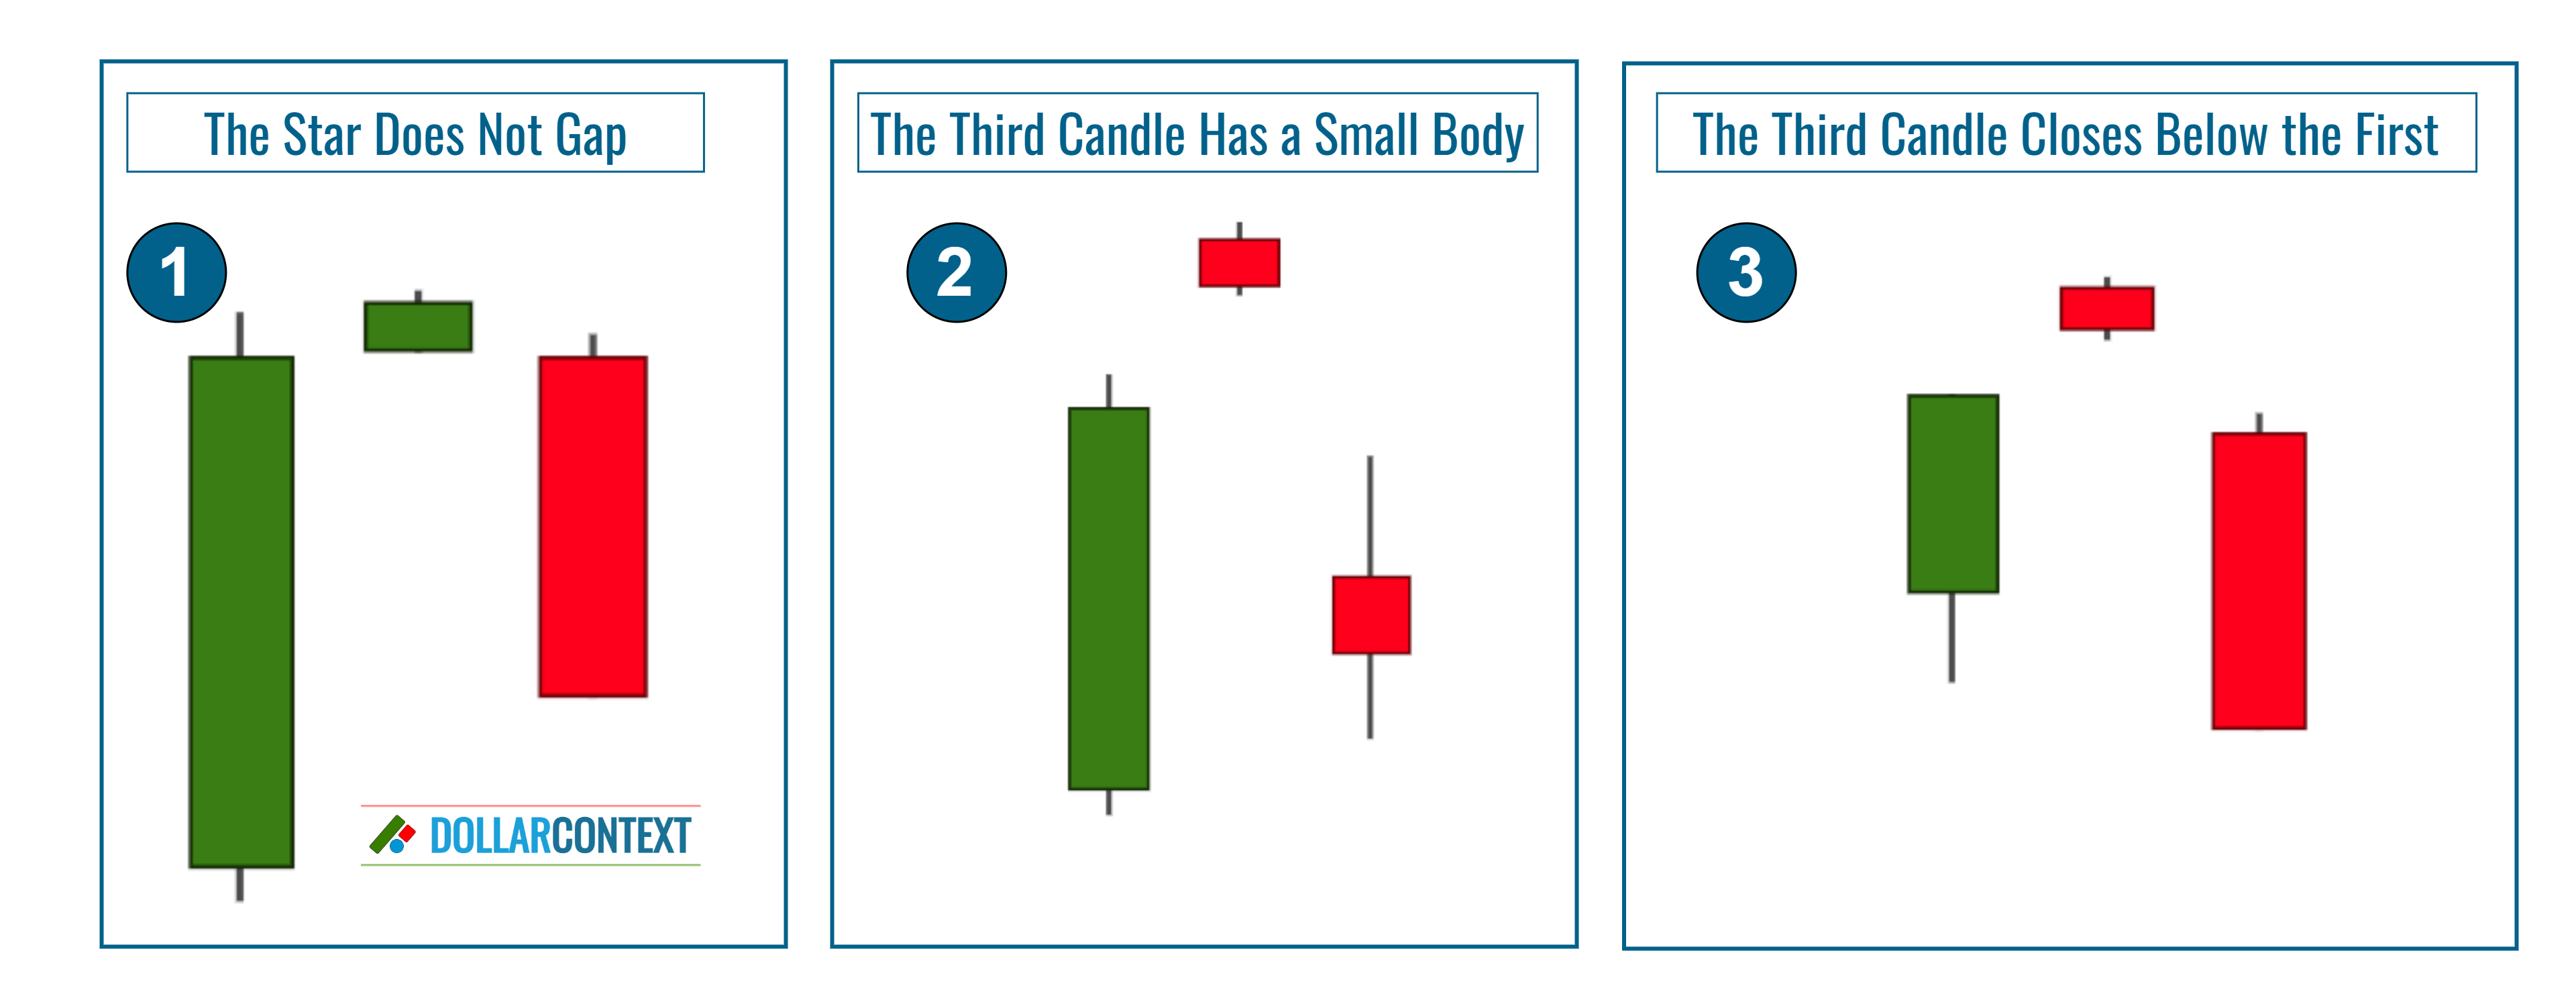
Common variations of the evening star pattern include combinations where:
- The Second Candle (Star) Does Not Gap: You're likely to encounter this scenario in shorter charting timeframes (hours or minutes) and in markets with low volatility. In such cases, it's usually advisable to wait for additional signs of a downward trend before initiating a trade.
- The Third Candle Has a Small Red/Black Body: In such instances, ensure that the third candle closes significantly within the body of the first. If not, it would be wise to seek additional confirmation before proceeding.
- The Third Candle Closes Below the First: This situation often occurs in markets that are either long-standing or have reached a mature phase. The prominent red candle signals a change in market sentiment, potentially marking the onset of a new bear market.
3 Support/Resistance Zones
An evening star appearing within a resistance zone gains additional significance for several reasons:
- Confirmation of Critical Zones: Resistance zones serve as barriers where the price has struggled to break higher in the past. The presence of an evening star near these zones lends credence to their importance.
- Strengthened Reversal Indicator: An evening star forming at a resistance zone heightens the likelihood of a price decline, signaling a strong refusal to push prices higher and the potential onset of a bearish trend.
Put simply, an evening star serves to confirm or strengthen a resistance zone and increases the probability of a top reversal.
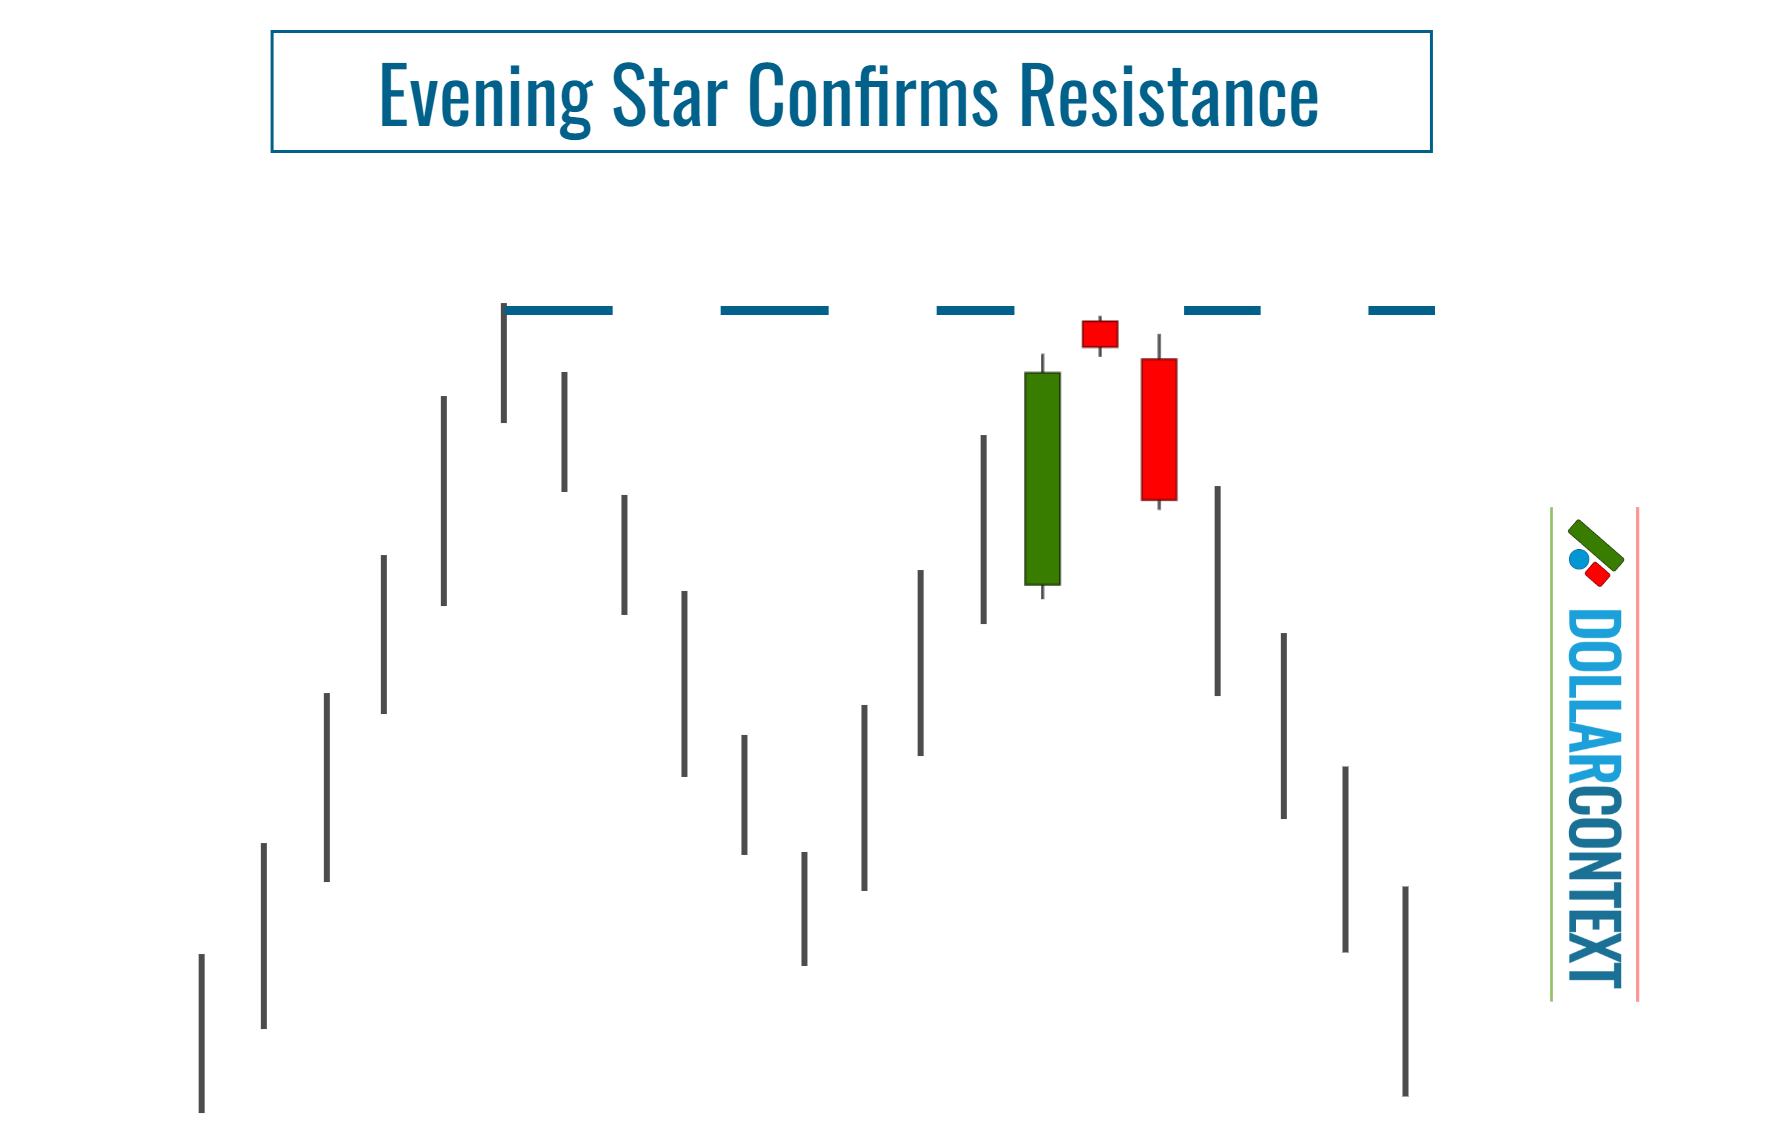
Be also aware that the evening star itself defines a resistance zone.
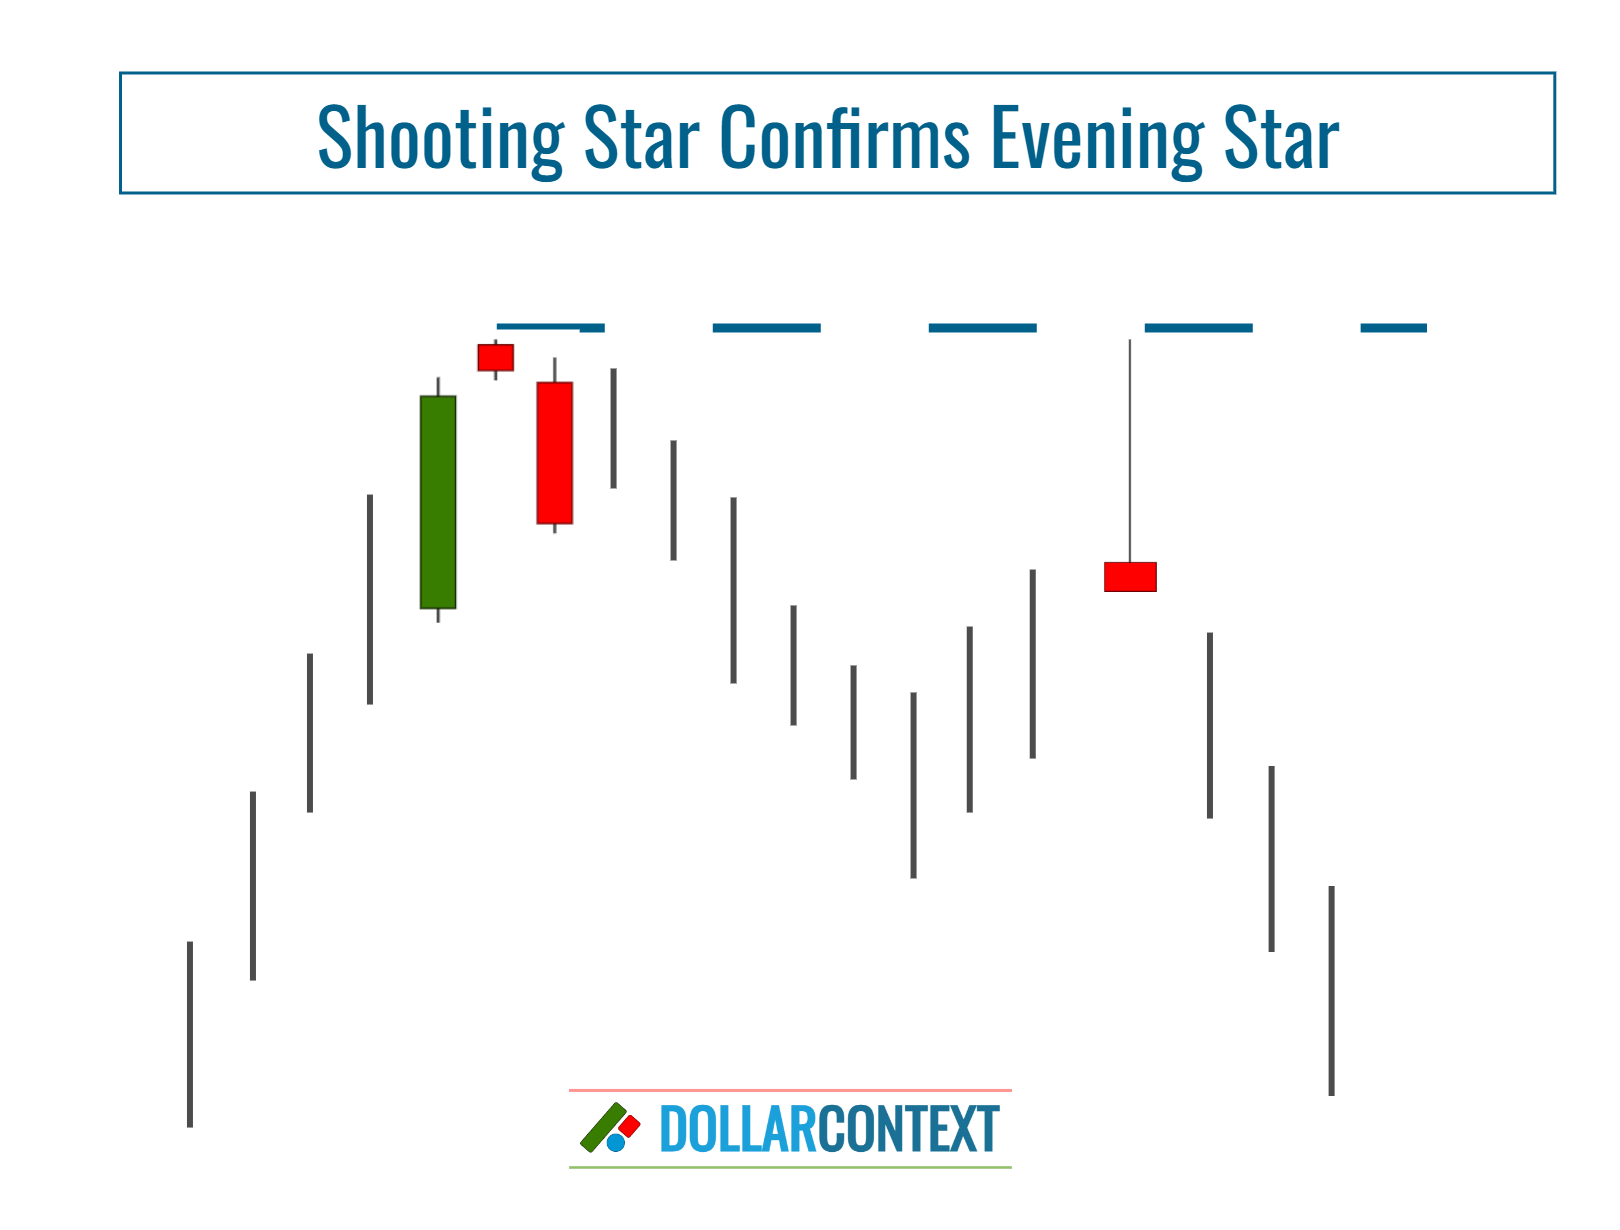
4. Additional Candlestick Patterns
When additional reversal patterns are spotted near the price range of the evening star, such overlapping signals can offer a more robust hint at a potential shift in price direction.