
Using the Evening Star Pattern to Identify Key Resistance Levels
After an uptrend, the price range associated with an evening star becomes resistance.

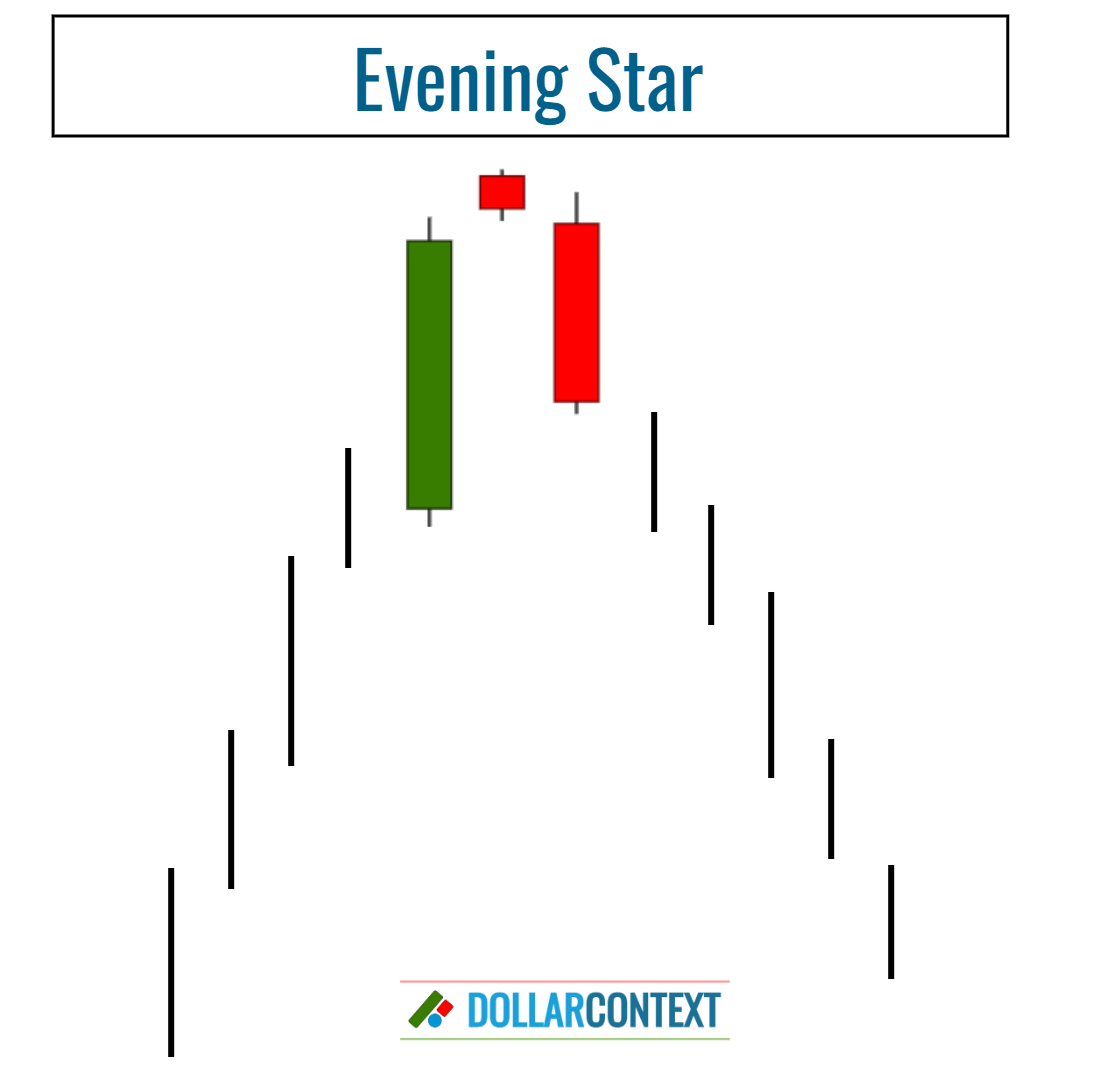
Serving as an indicator of a bearish reversal, the evening star manifests at the culmination of an upward trend. This pattern is formed by three key candlesticks:
- A substantial bullish (green) candle, which shows robust buying activity.
- A candle with a small body (either bullish or bearish), denoting market uncertainty and hinting at a potential loss of upward momentum. Ideally, this candle should not overlap with the real body of the initial bullish candle.
- A lengthy bearish (red) candle, which solidifies the reversal by displaying strong selling interest. The third candle typically closes well within the range of the initial bullish candle that forms part of this pattern.
Under this model, we can identify two distinct cases:
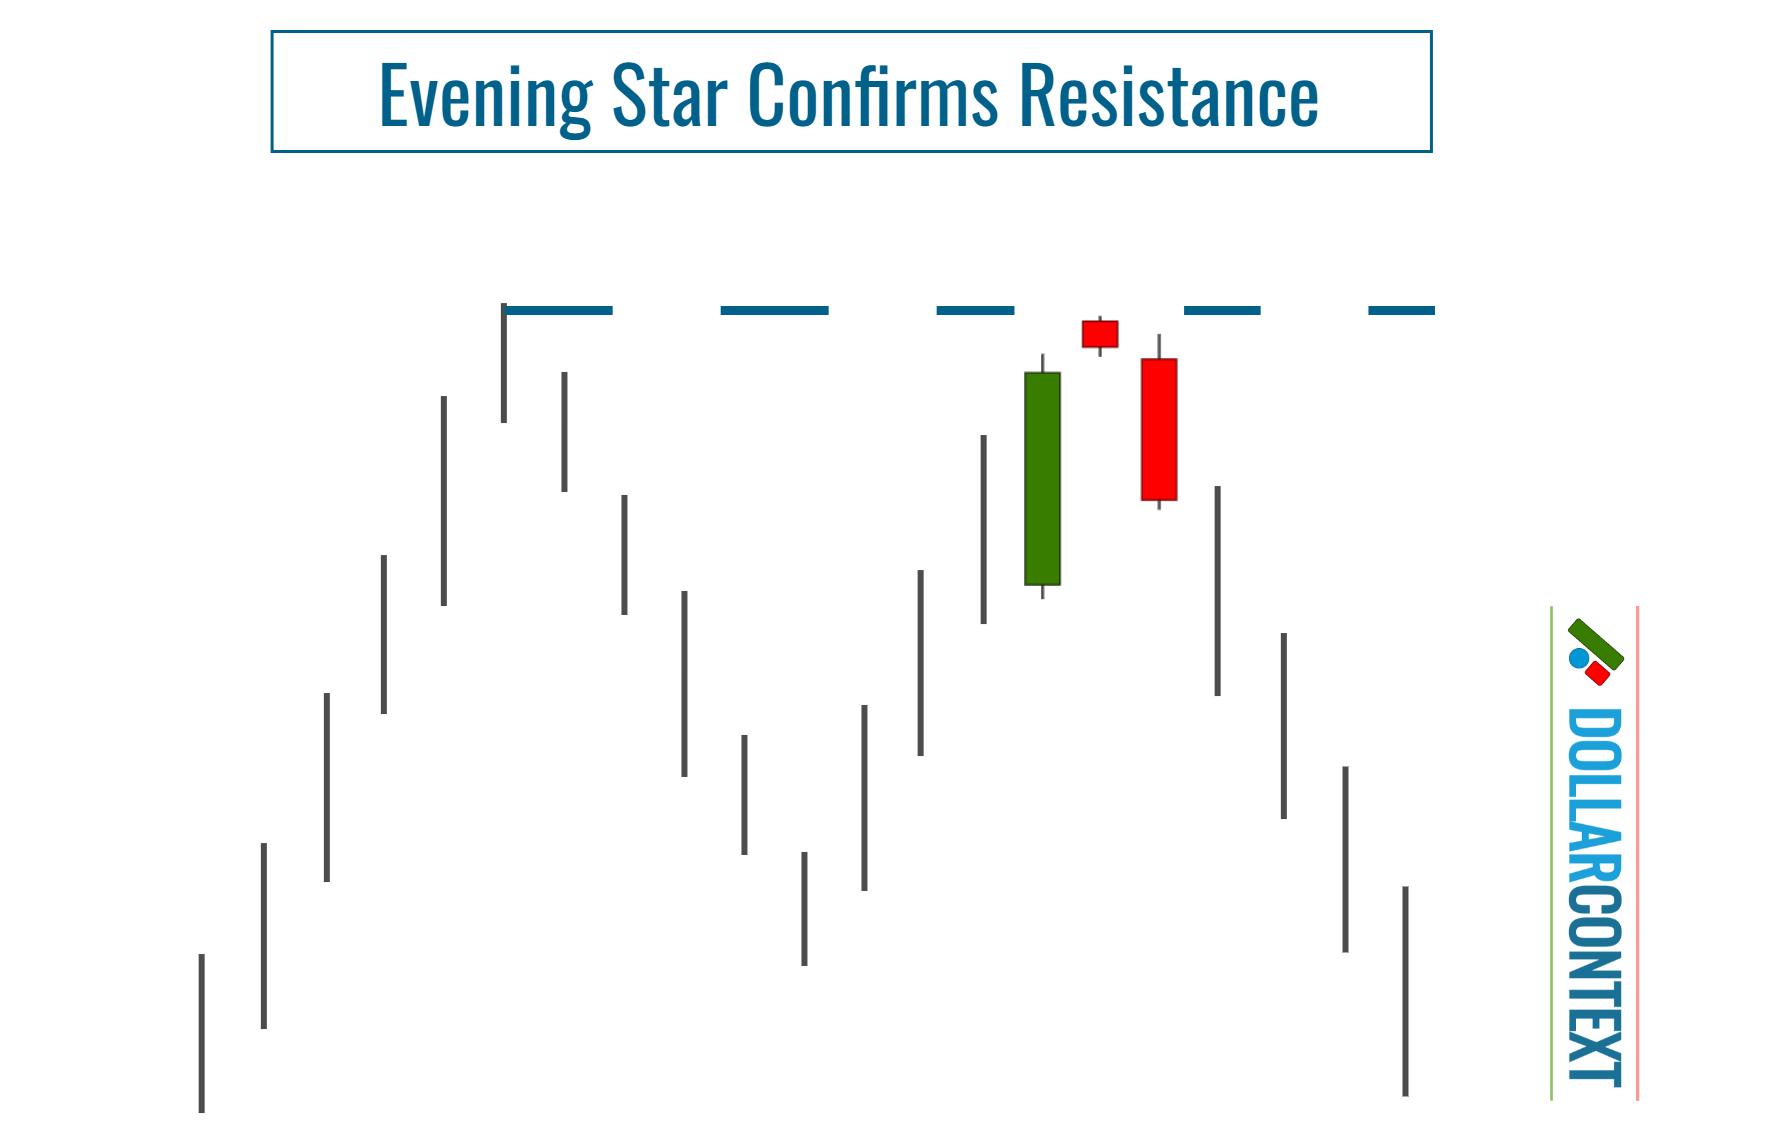
- When an evening star appears within an already defined resistance area, it serves to strengthen or validate the existing resistance.
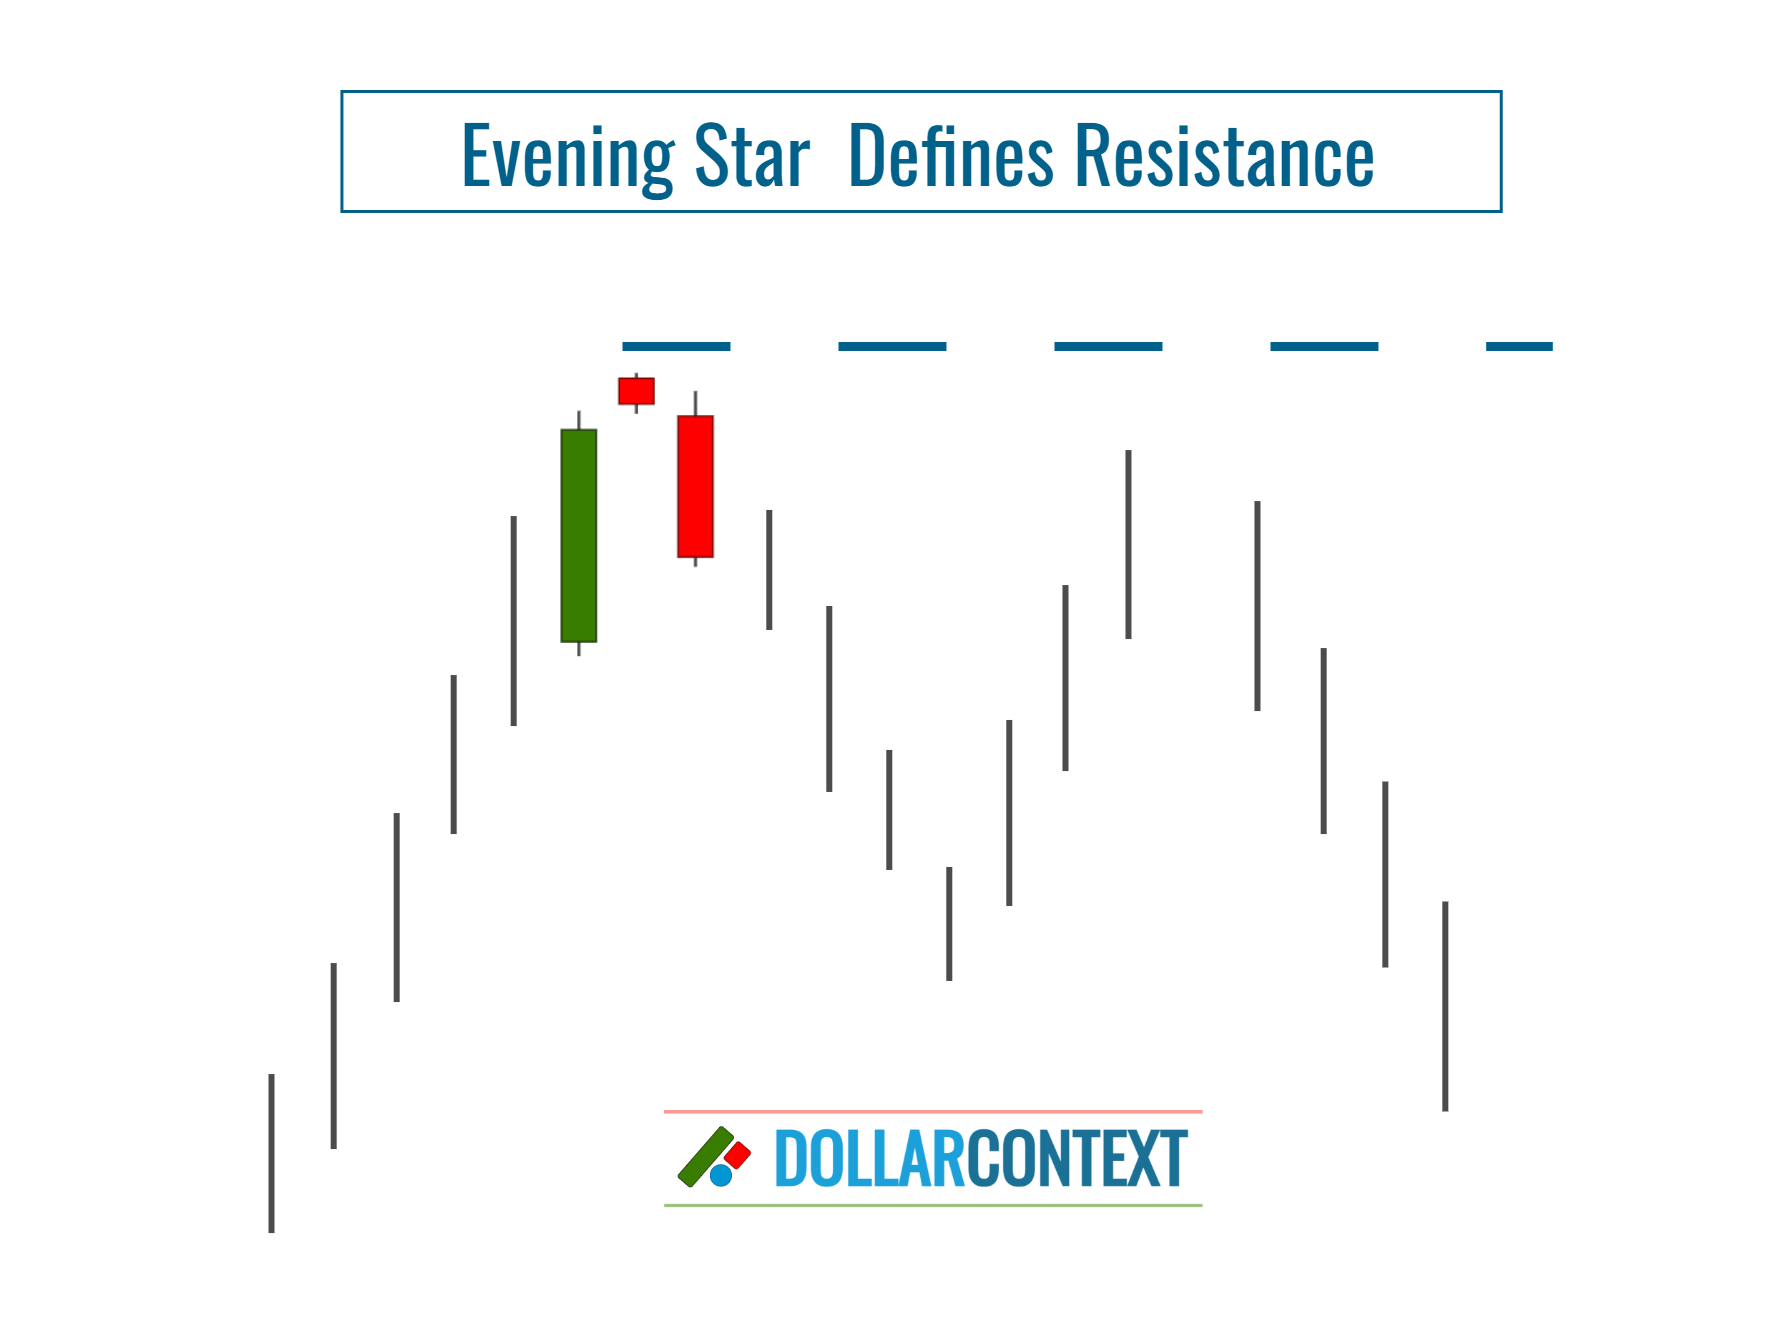
- If an evening star materializes at a fresh high, it establishes a new resistance zone.
1. Evening Star Confirms Resistance
When an evening star appears within a previously defined resistance area, it reinforces the credibility of that resistance, increasing the likelihood of a bearish trend reversal.
2. Evening Star Defines New Resistance
If an evening star creates a new high, it sets up a fresh resistance zone that may be tested in the future.
3. Breakout of the Resistance Area
When entering a trade guided by the evening star, it's crucial to determine a particular price level at which you'll reevaluate your initial approach. This identified price can act as the initial stop-loss for your evening star-based strategy.
If a trading session clearly surpasses the resistance level set by the evening star pattern, the market is likely to continue its prior trend. Nonetheless, as elaborated in the subsequent section, exceptions do exist.
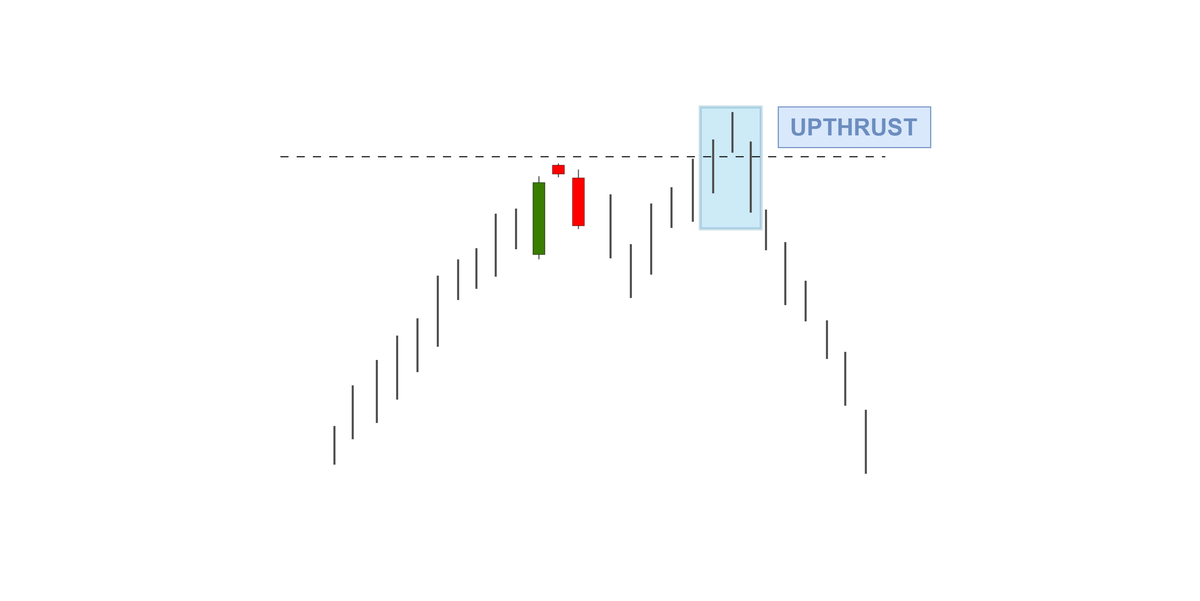
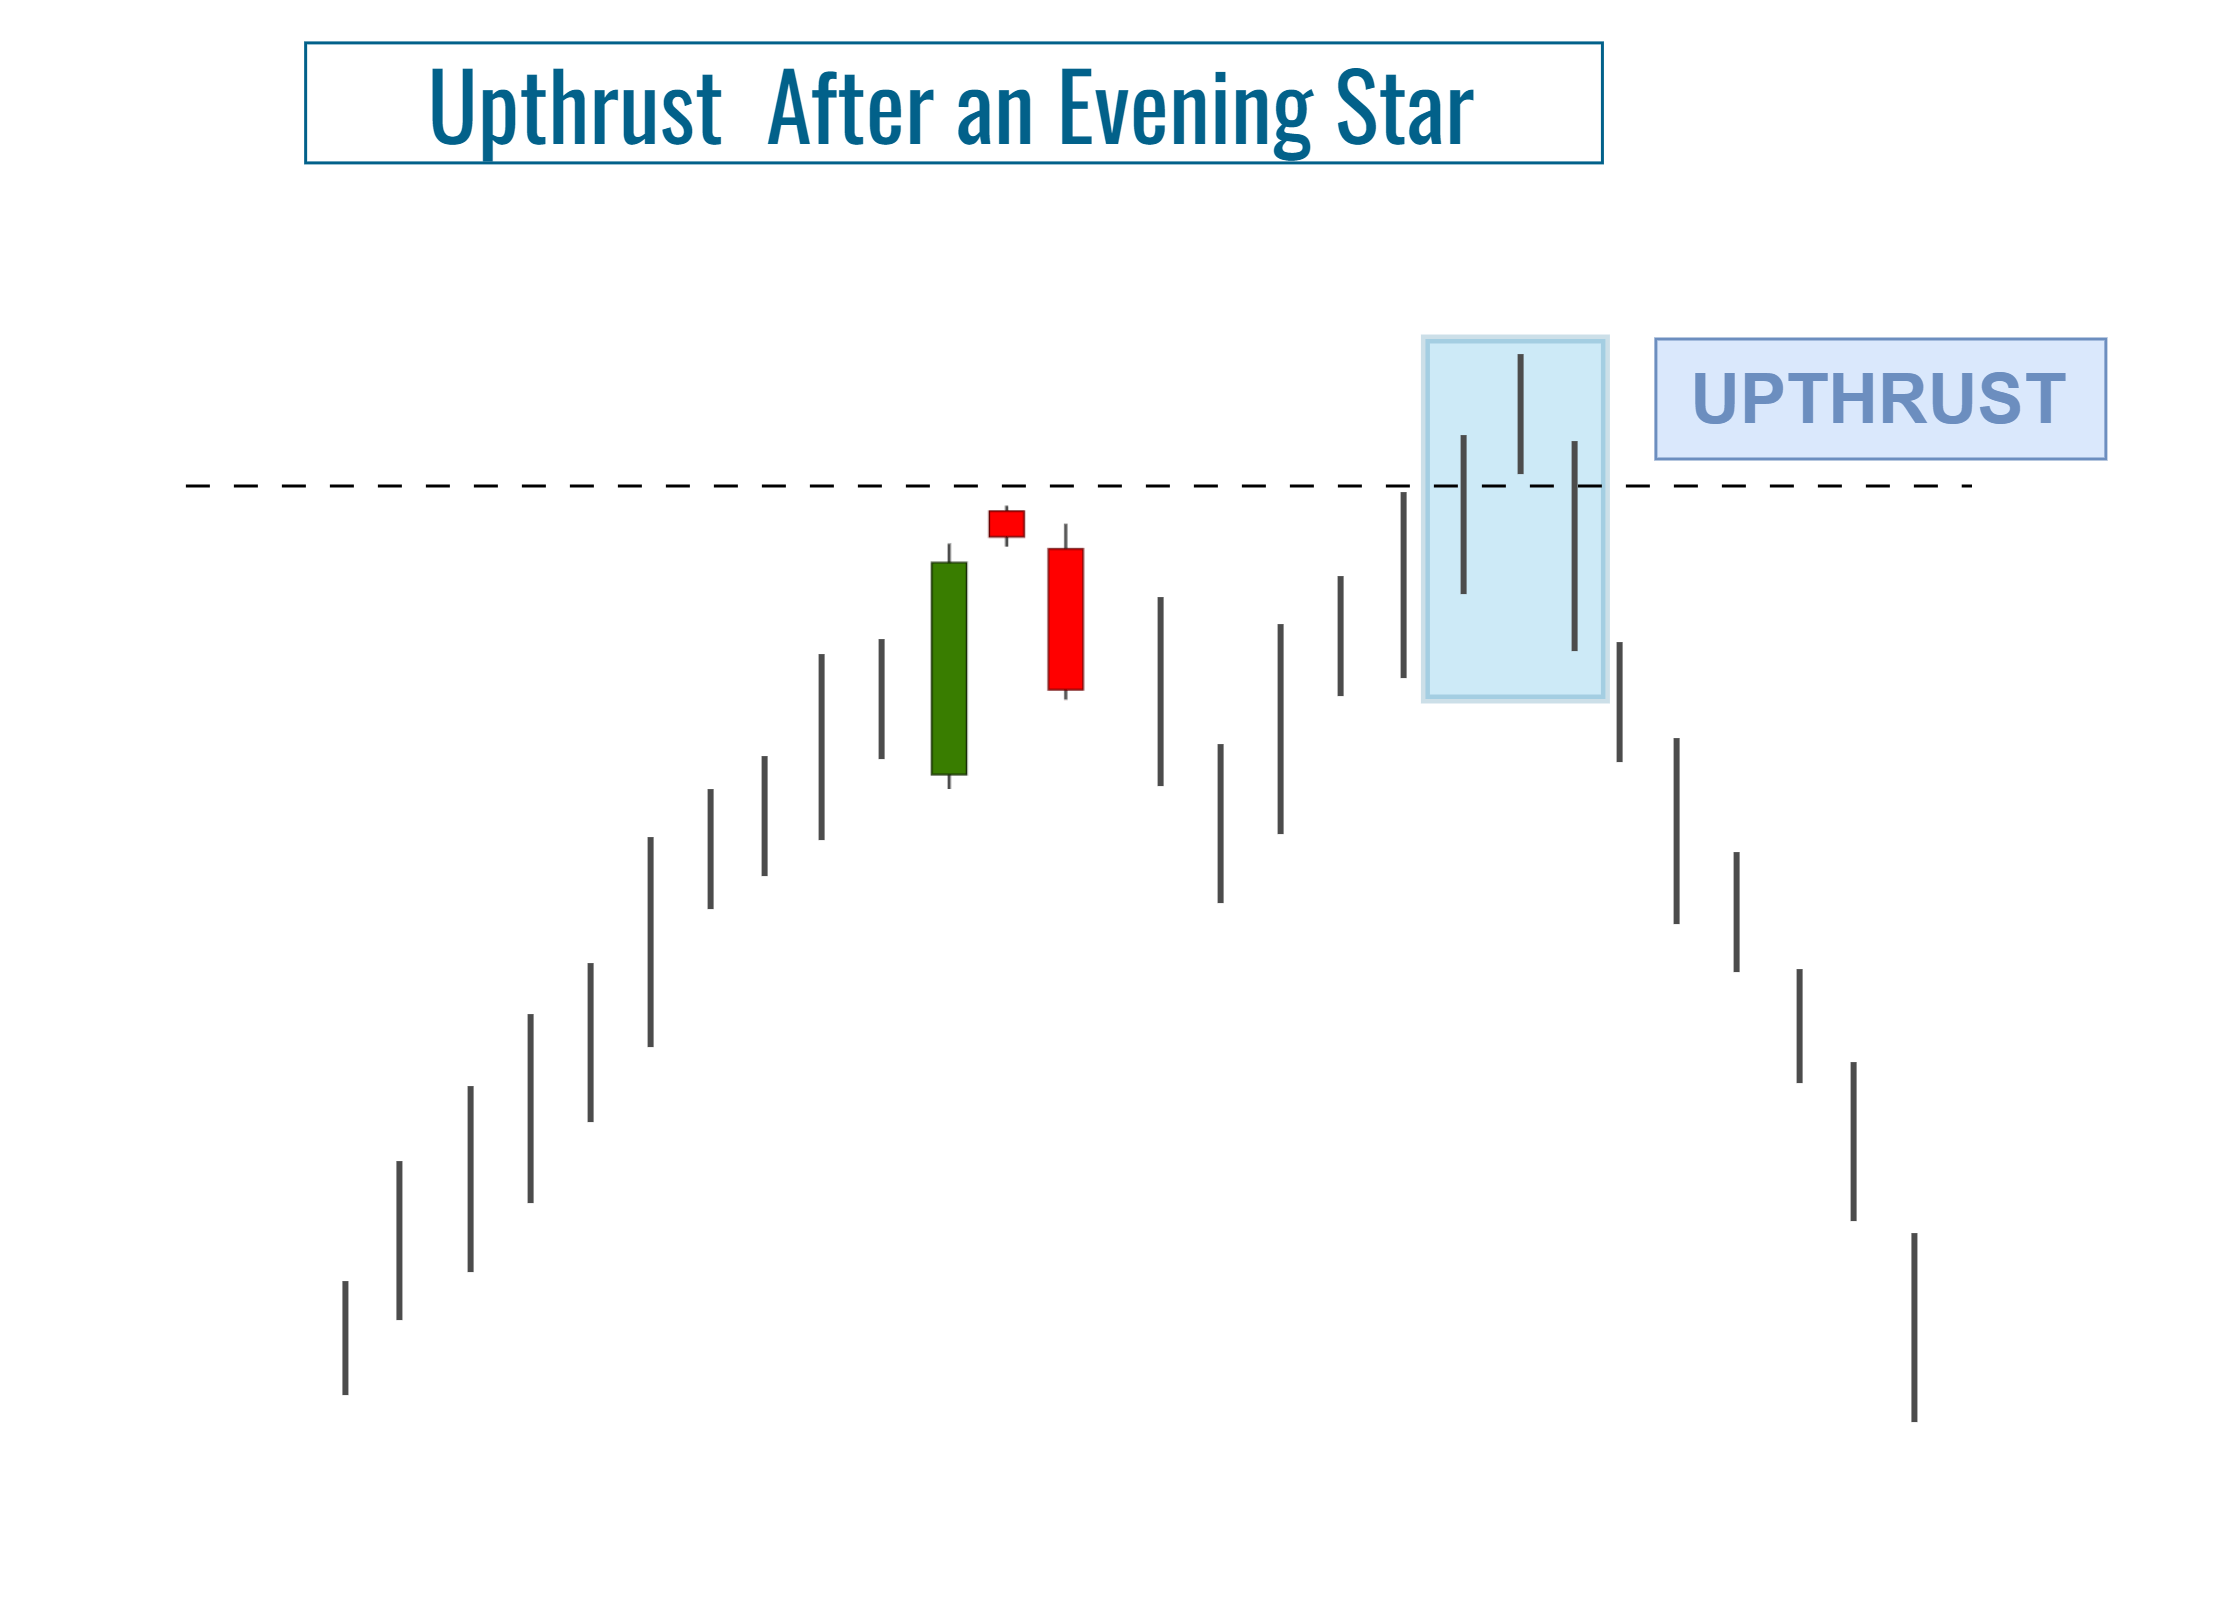
4. False Breakouts
When a resistance level is broken, many traders view it as a signal that the price may further move in the direction of the breakout. However, markets sometimes act against these expectations. Rather than maintaining the existing trend, they might reverse course and return to their previous range. This occurrence is often referred to as a "false breakout" or an "upthrust".
To minimize the potential for a false breakout, consider the following suggestions:
- Base your stop-loss on the session's closing price, rather than being influenced by fluctuations within the session.
- Consider incorporating a safety margin to your predetermined stop-loss level.
- In instances where subsequent bearish candlestick patterns reinforce the resistance level established by an evening star, the likelihood of a genuine breakout significantly drops.


