
Hammer Strategy: A Comprehensive Tutorial
Today, we're going to explore a crucial pattern in the realm of Japanese candlestick analysis: the hammer.

Today, we'll explore a vital element of Japanese candlestick analysis: the hammer pattern.
Before diving deep into the analysis of this pattern, we need to highlight three essential aspects of most candlestick formations, including the hammer:
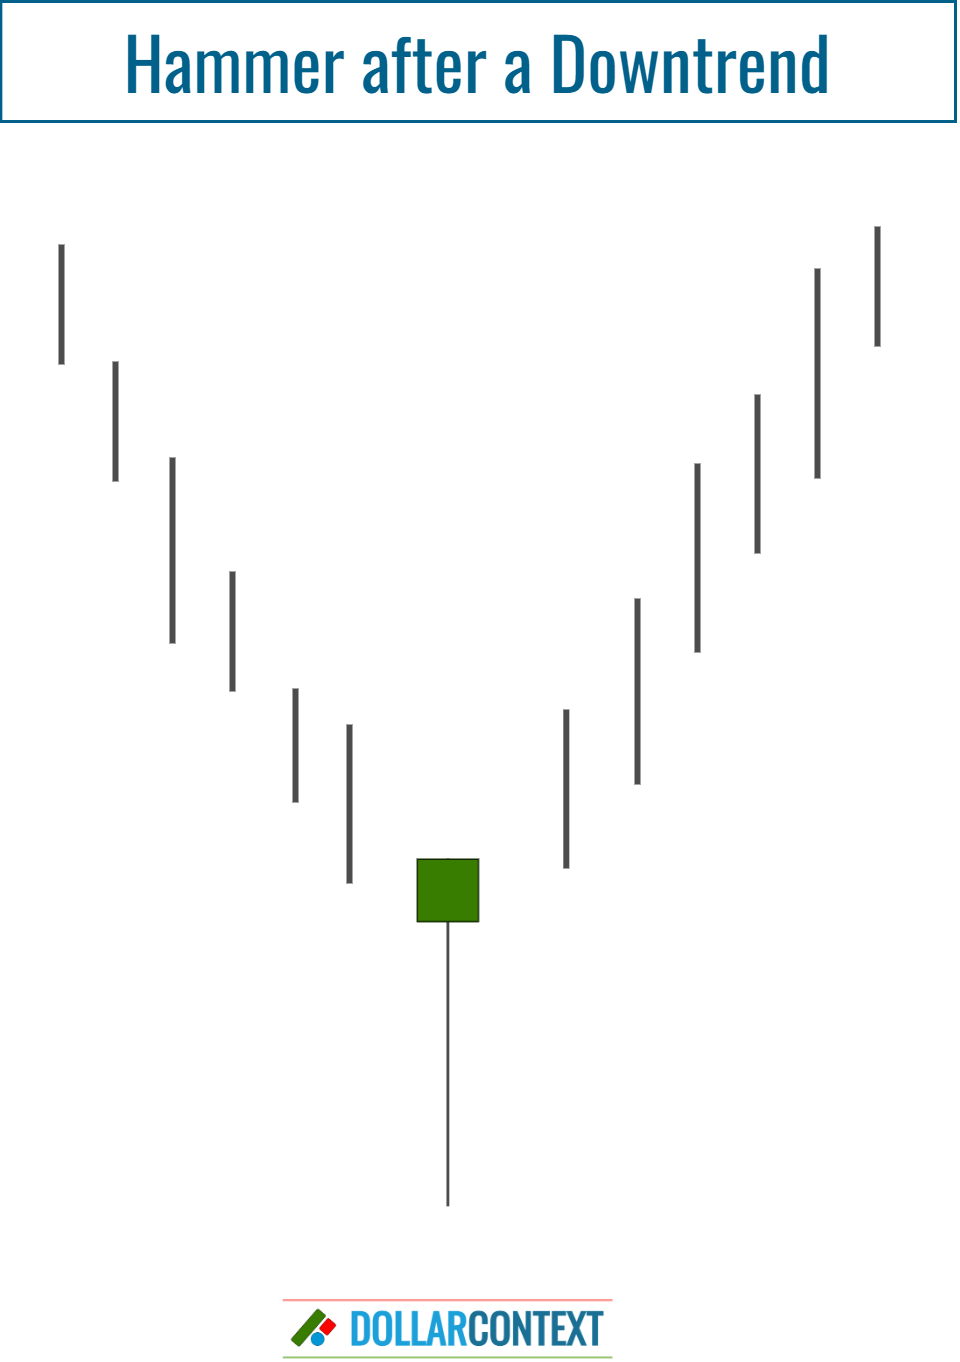
- Candlestick patterns are reversal signals, indicating that the current trend may end soon, and a new trend in the opposite direction might begin. For a pattern like the hammer, the signal always arises after a downtrend.
- They can be used in all time intervals, including minutes, hours, days, weeks, or months.
- You can apply them to any market with accessible price data, including commodities, stocks, commodities, forex, and indices. This is because candlestick patterns are based on price action, a phenomenon consistent in every market.
Contents
1. The Shape of a Hammer
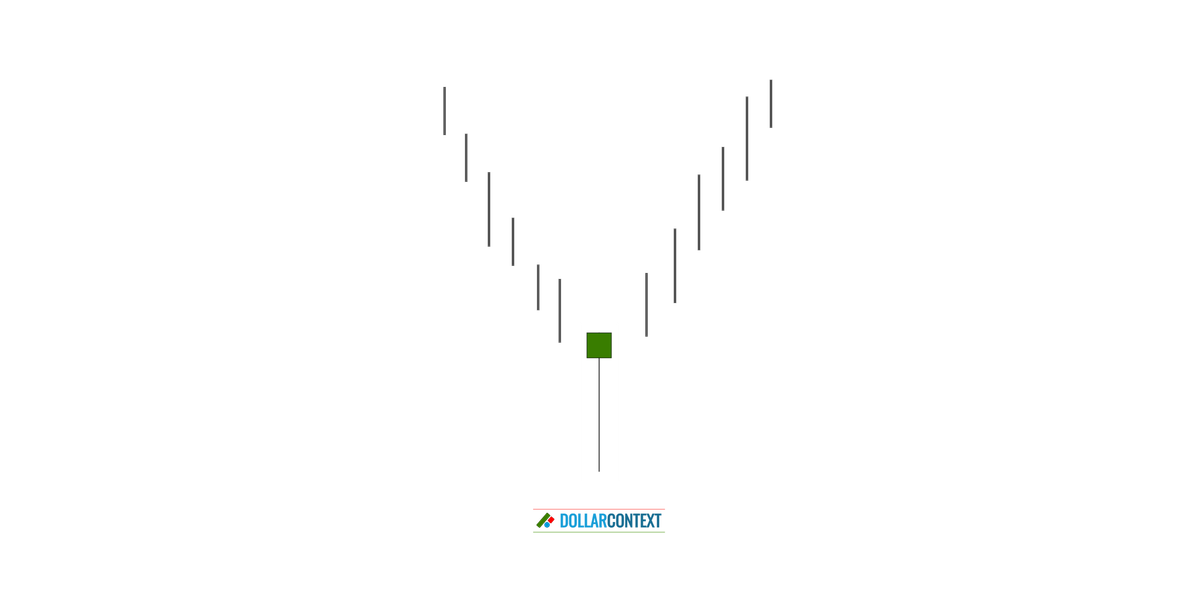
The hammer is a single-candle pattern that is easily recognizable because of its unique shape, which looks similar to a real-life hammer. Here's a breakdown of the visual characteristics of a hammer:
- Long Lower Shadow (wick): This is the most distinguishing feature of the hammer. It represents a significant price decline during the period, followed by a strong close near the opening price.
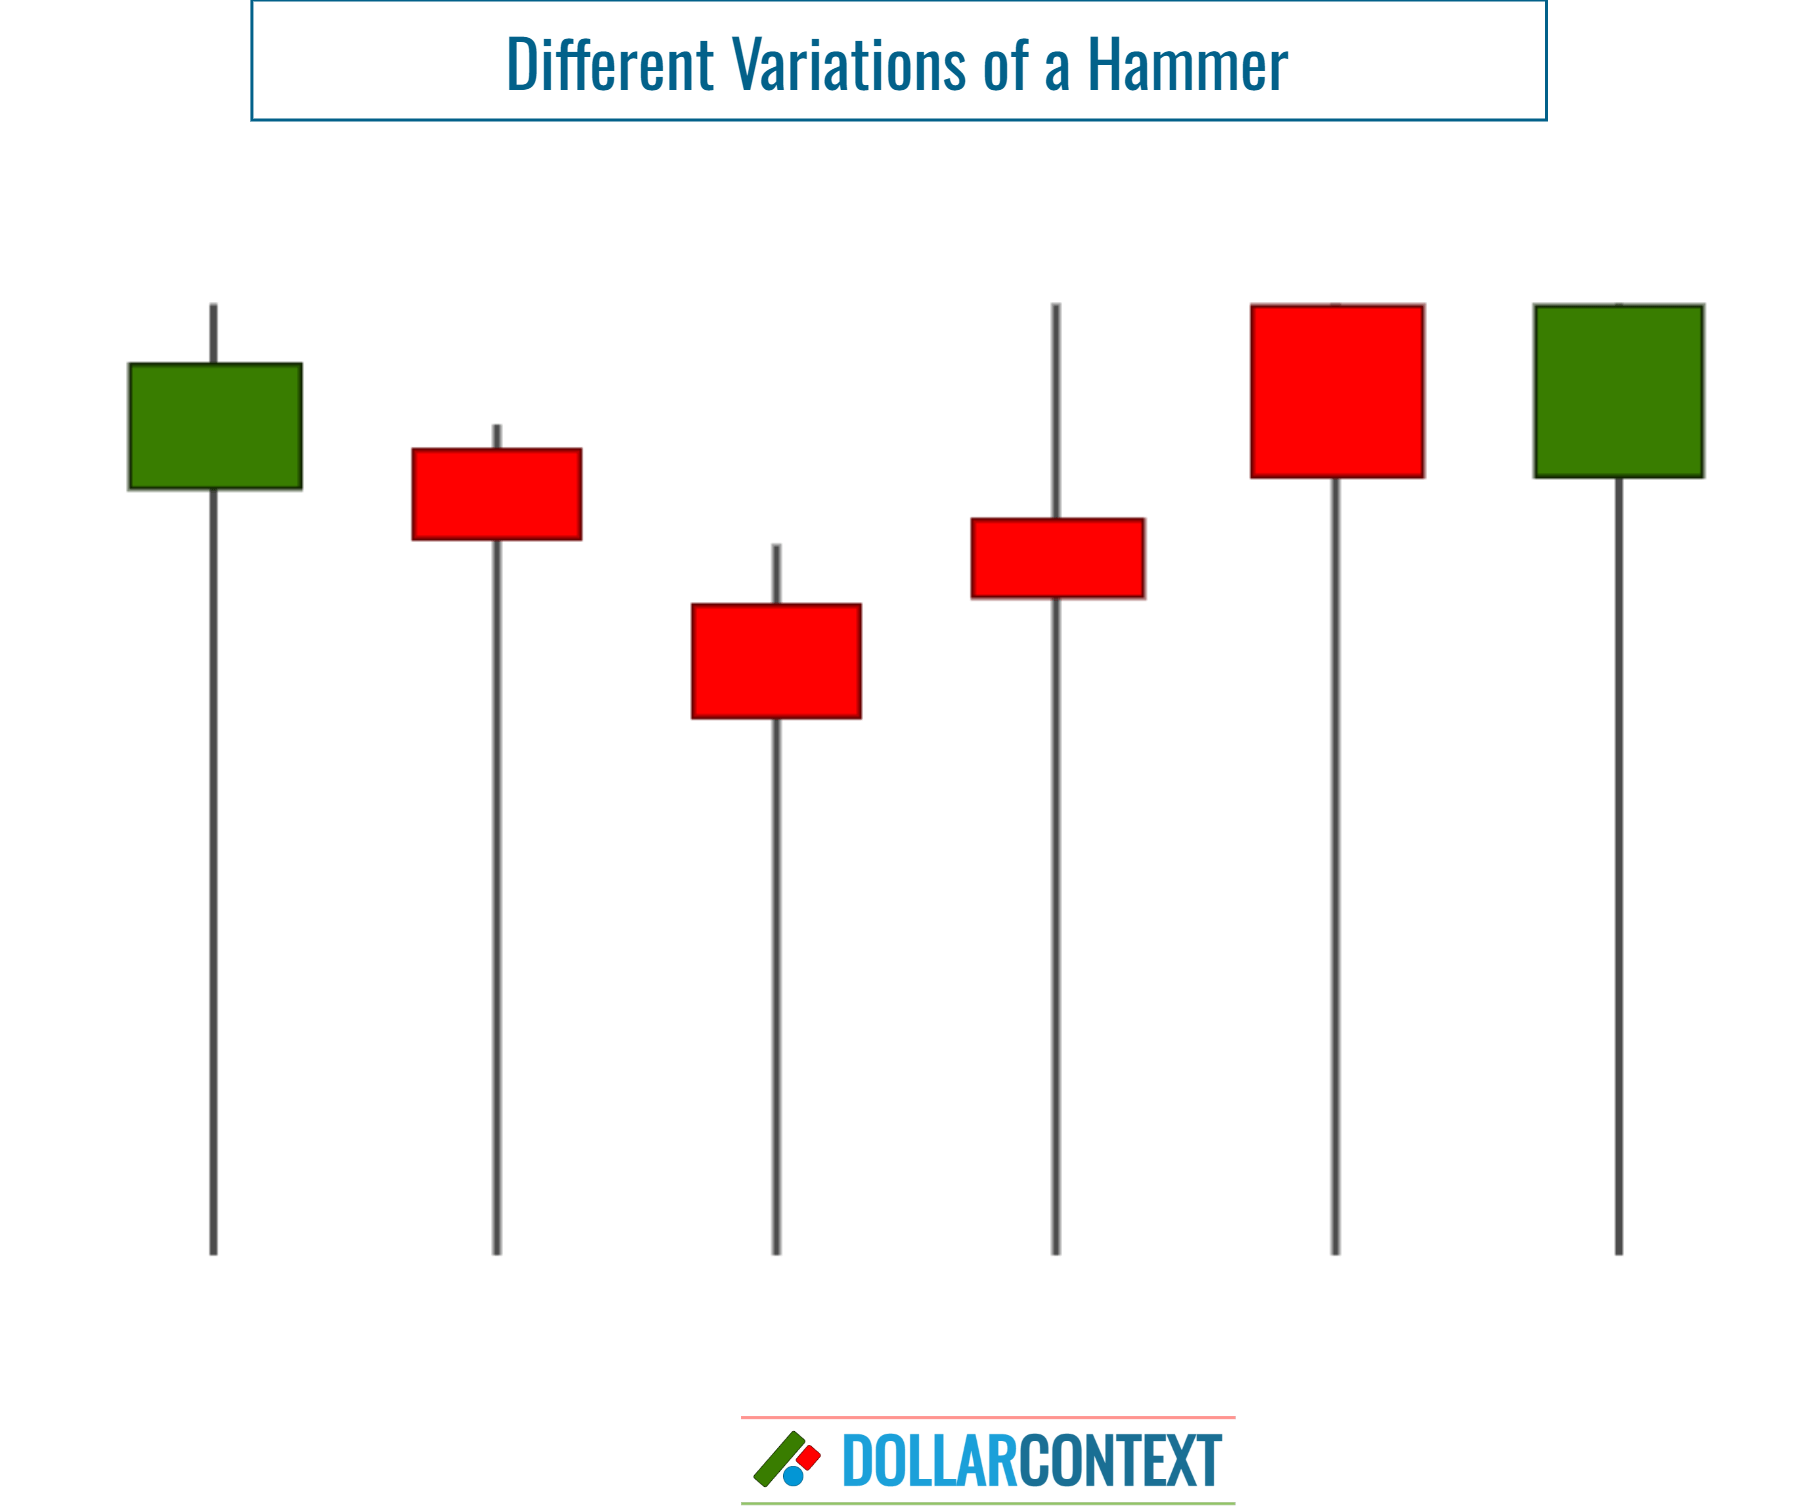
- The Color of the Body is Not Pivotal: The body of a hammer can appear as either red (or black) or green (or white). However, a green/white body conveys a slightly stronger bullish sentiment at the end of the session.
- Small Body: The real body of a hammer is typically small or non-existent.
- Minimal or No Upper Shadow: The hammer pattern should exhibit a tiny or non-existent upper shadow.
A hammer is the opposite of a shooting star pattern. While a hammer emerges after a downtrend, the shooting star typically surfaces after an uptrend.
2. Context
The context in which a hammer appears is just as vital as the candle's form itself. So, after a pronounced or sharp downtrend, this pattern acts as a sign of reversal that can be used to:
- open a long position, or
- close existing short positions in the market.
In general, a hammer-like candle appearing in the course of an uptrend or a narrow sideways movement holds no significance. However, when emerging near the bottom of a wide trading range, it may indicate a rally to the range's top.
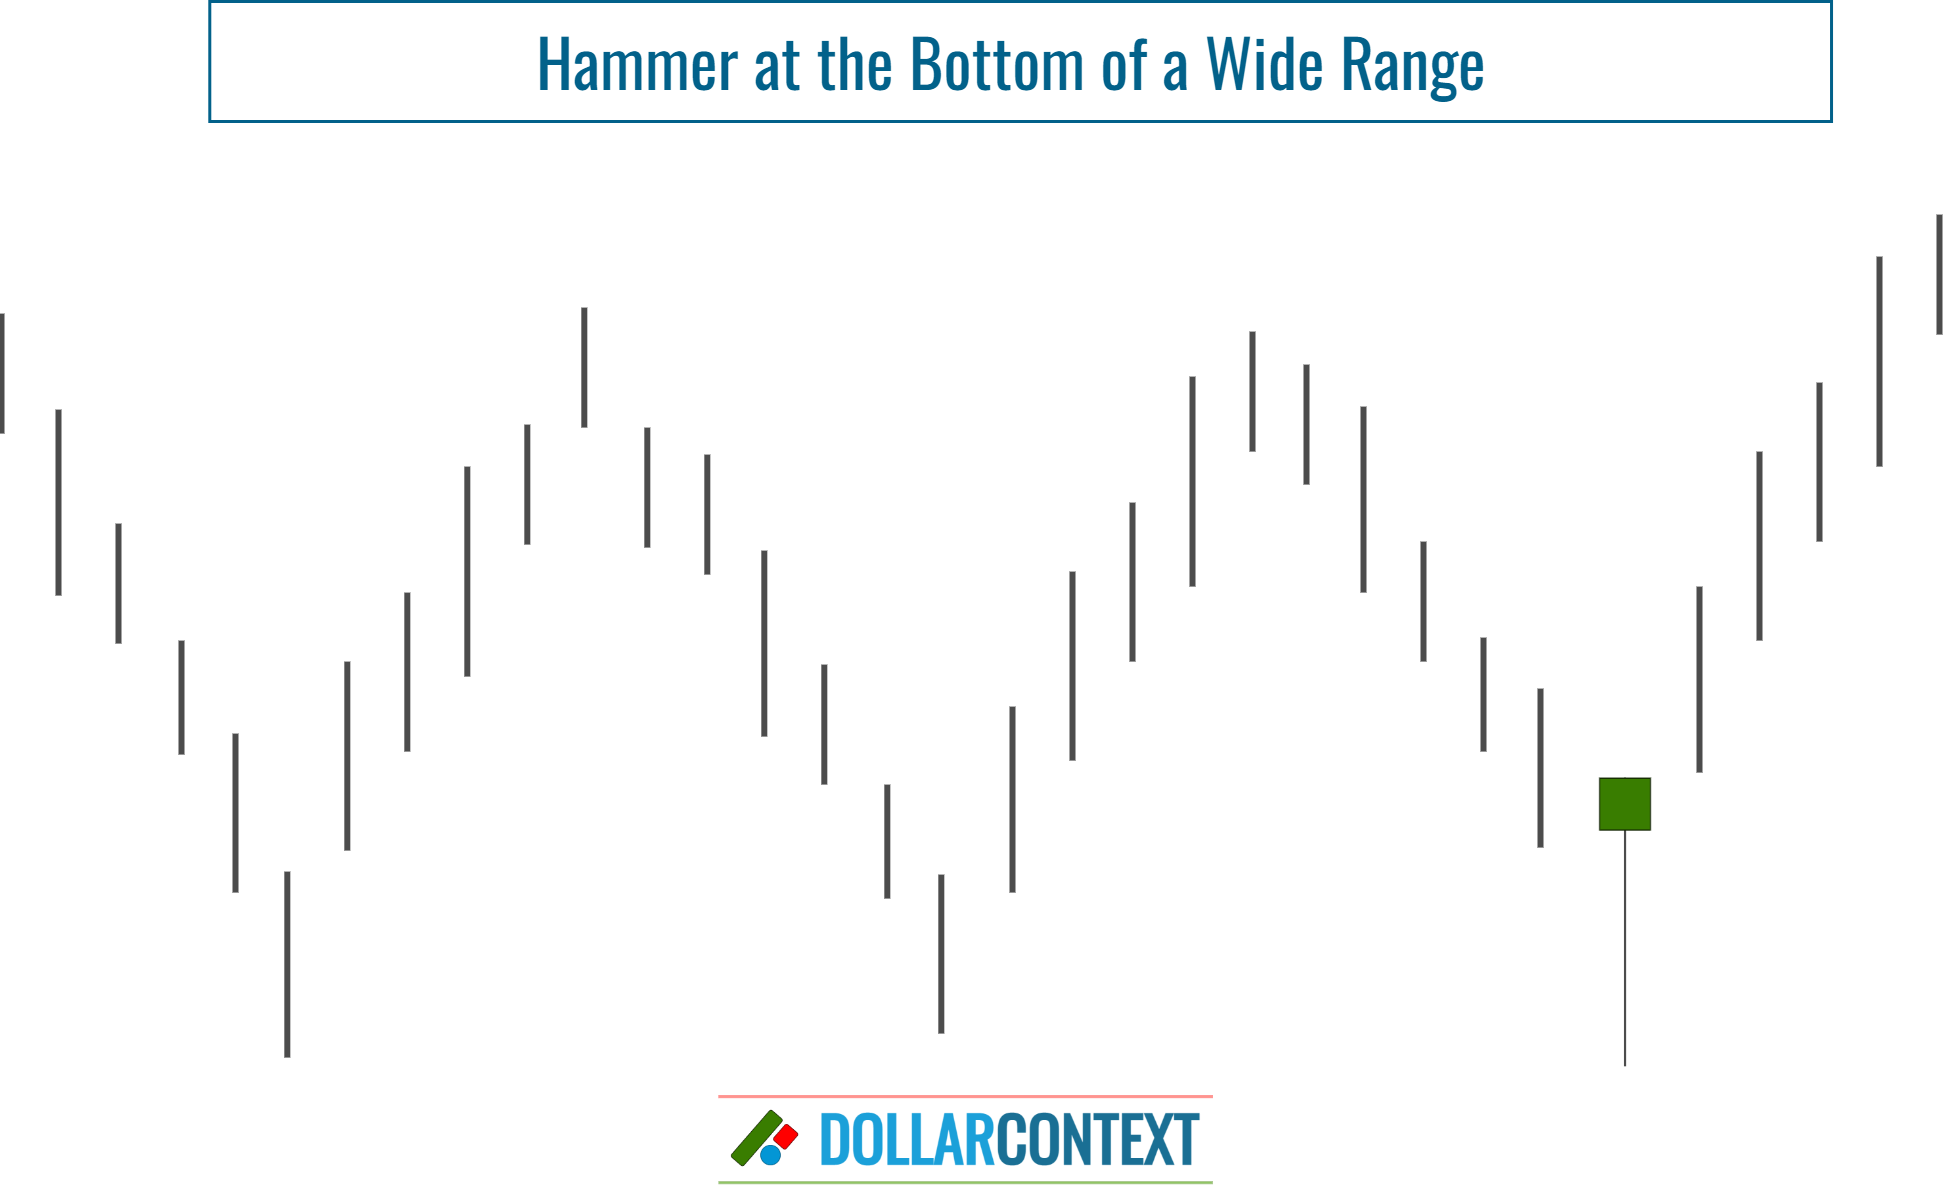
After the appearance of a hammer, the probability of a bullish reversal increases in line with the length and/or steepness of the preceding trend. Why can a hammer signal a reversal near the bottom of a sideways trend? Simply because the pattern surfaces after a downtrend (on a microscale) within the context of a broader sideways movement on a more macroscale price action.
Additionally, the following contextual factors are extremely critical when considering the credibility of a hammer as a bullish indicator:
- Support Zone: If a hammer emerges within a support area, the bullish implications of the pattern intensify extraordinarily.
- Further Candlestick Patterns: Often, a hammer pattern is preceded or followed by other candlestick patterns near the same price range set by the hammer session. This increases the likelihood of a successful reversal (see example 7.3 down below.)
- Relative Size of the Lower Shadow: The length of the lower shadow when compared to the size of the preceding candles is relevant. In this sense, a tiny hammer might be of no consequence.
- Oversold Market: The closer a market gets to being oversold, the greater the likelihood of a trend reversal following a hammer candle.
3. Psychology Behind a Hammer Pattern
The psychology behind a hammer reflects a battle between buyers and sellers. Initially, during the session, sellers push prices significantly lower, suggesting strong bearish sentiment. However, by the close of the period, buyers manage to push the prices back up, closing near the opening price.
This rapid recovery signifies a potential shift in momentum where the buyers have started to take control, hinting that the previous downtrend might be nearing its end. The hammer, therefore, represents a potential turning point where selling pressure is exhausted, and buying interest is reviving.
4. Entry Point
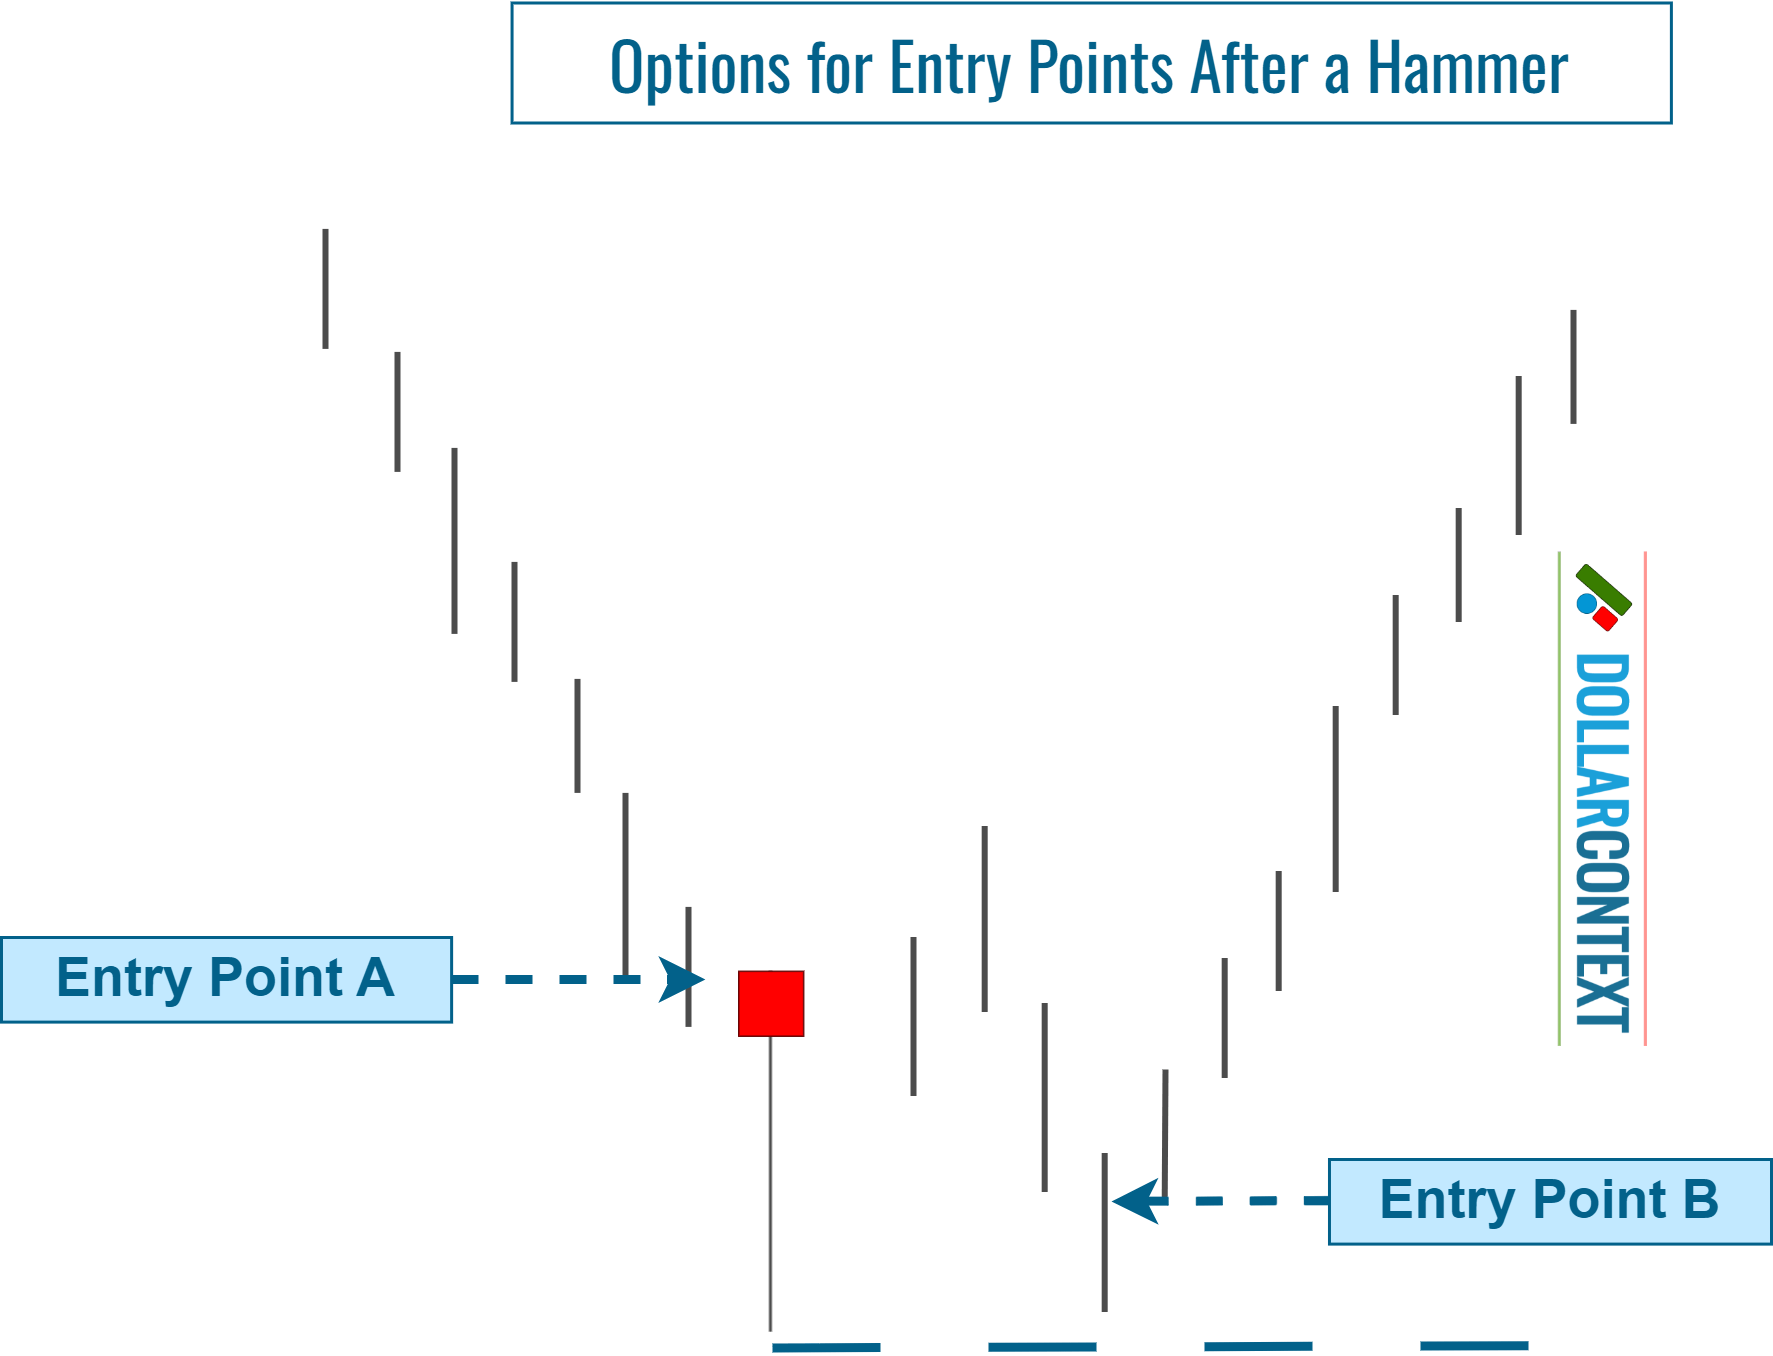
Given that the hammer is most effective following a pronounced downtrend, it's important to recognize that a rally stemming from the hammer might encounter selling pressure in the short term. Thus, the initial upward move could fail, leading the market to retest the support established by the hammer.
Trading upon spotting a hammer hinges on a trader's risk tolerance and trading aggressiveness. Some might choose to dive in right after the hammer's appearance, anticipating that the market may not revisit the hammer's level.
Others might opt for patience, waiting to see if the market returns to the hammer's lows before committing. If the market reaffirms the support established by the hammer, it indicates a sturdier support zone, enhancing the likelihood of an upward move.
A mixed strategy involves making a tentative long entry after observing a hammer, and then increasing the position once the hammer's support is successfully retested.
5. Stop-Loss
As previously noted, the lowest price of a hammer turns into support. You can use this level as a baseline for determining an initial stop-loss.
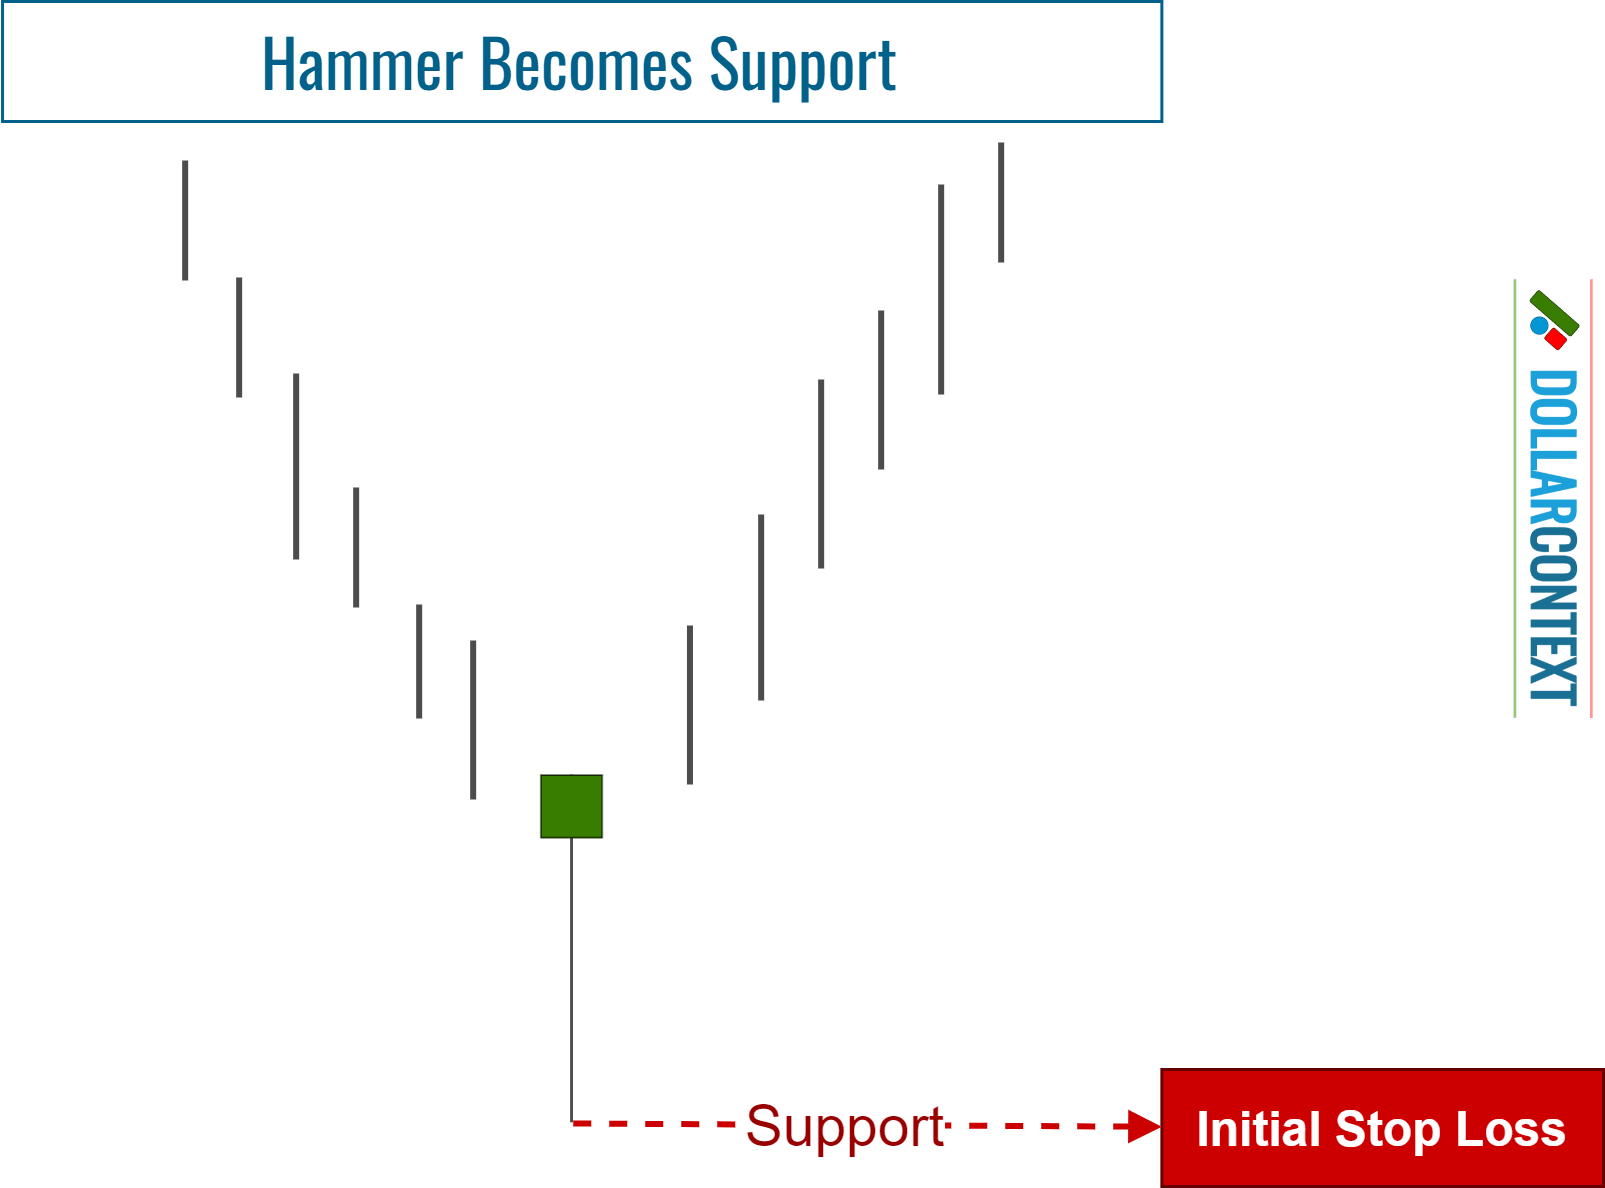
However, to safeguard against being prematurely stopped out during turbulent sessions or due to deceptive breakouts, consider these two extra considerations:
- You can add a cushion to prevent being impacted by springs (false breakouts.)
- Consider a stop on a close below the lows of the hammer, which we recommend.
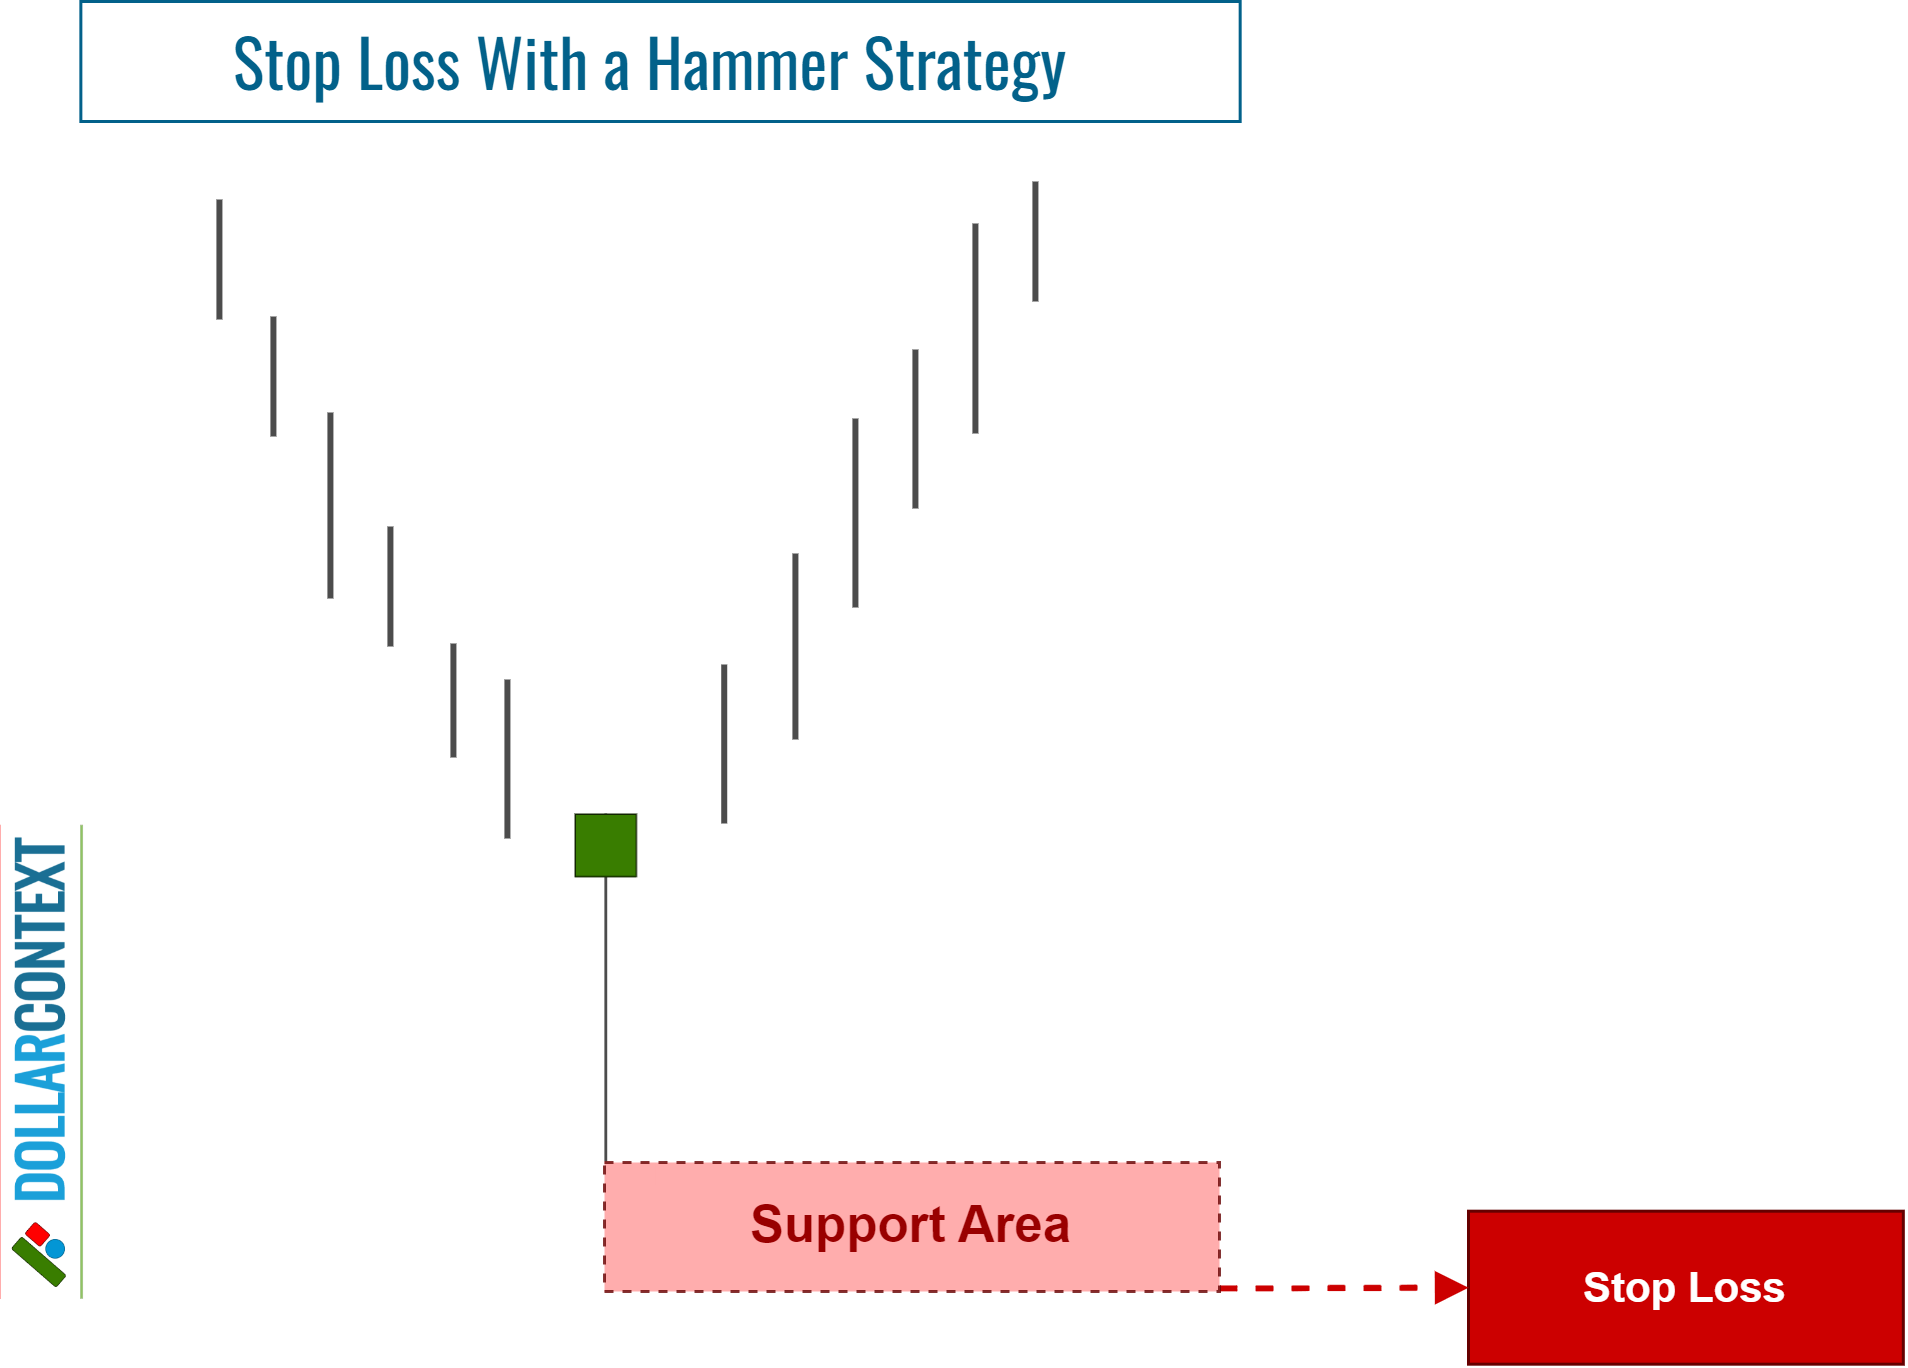
As your trade progresses, you may observe additional candlestick patterns that reinforce the initial support established by the hammer. In such situations, consider adjusting your stop loss to account for the lowest point across these patterns, including the original hammer line.
6. Profit Target
Candlestick patterns usually indicate trend reversals and entry opportunities, but they don't inherently point out profit-taking levels. To determine these, you should turn to other methods, such as classic chart patterns, Fibonacci retracements and projections, or moving averages.
That said, if you're in a favorable long position triggered by the appearance of a hammer, and a new bearish candlestick pattern surfaces, you might take this new pattern as a signal to exit the hammer trade.
7. Examples
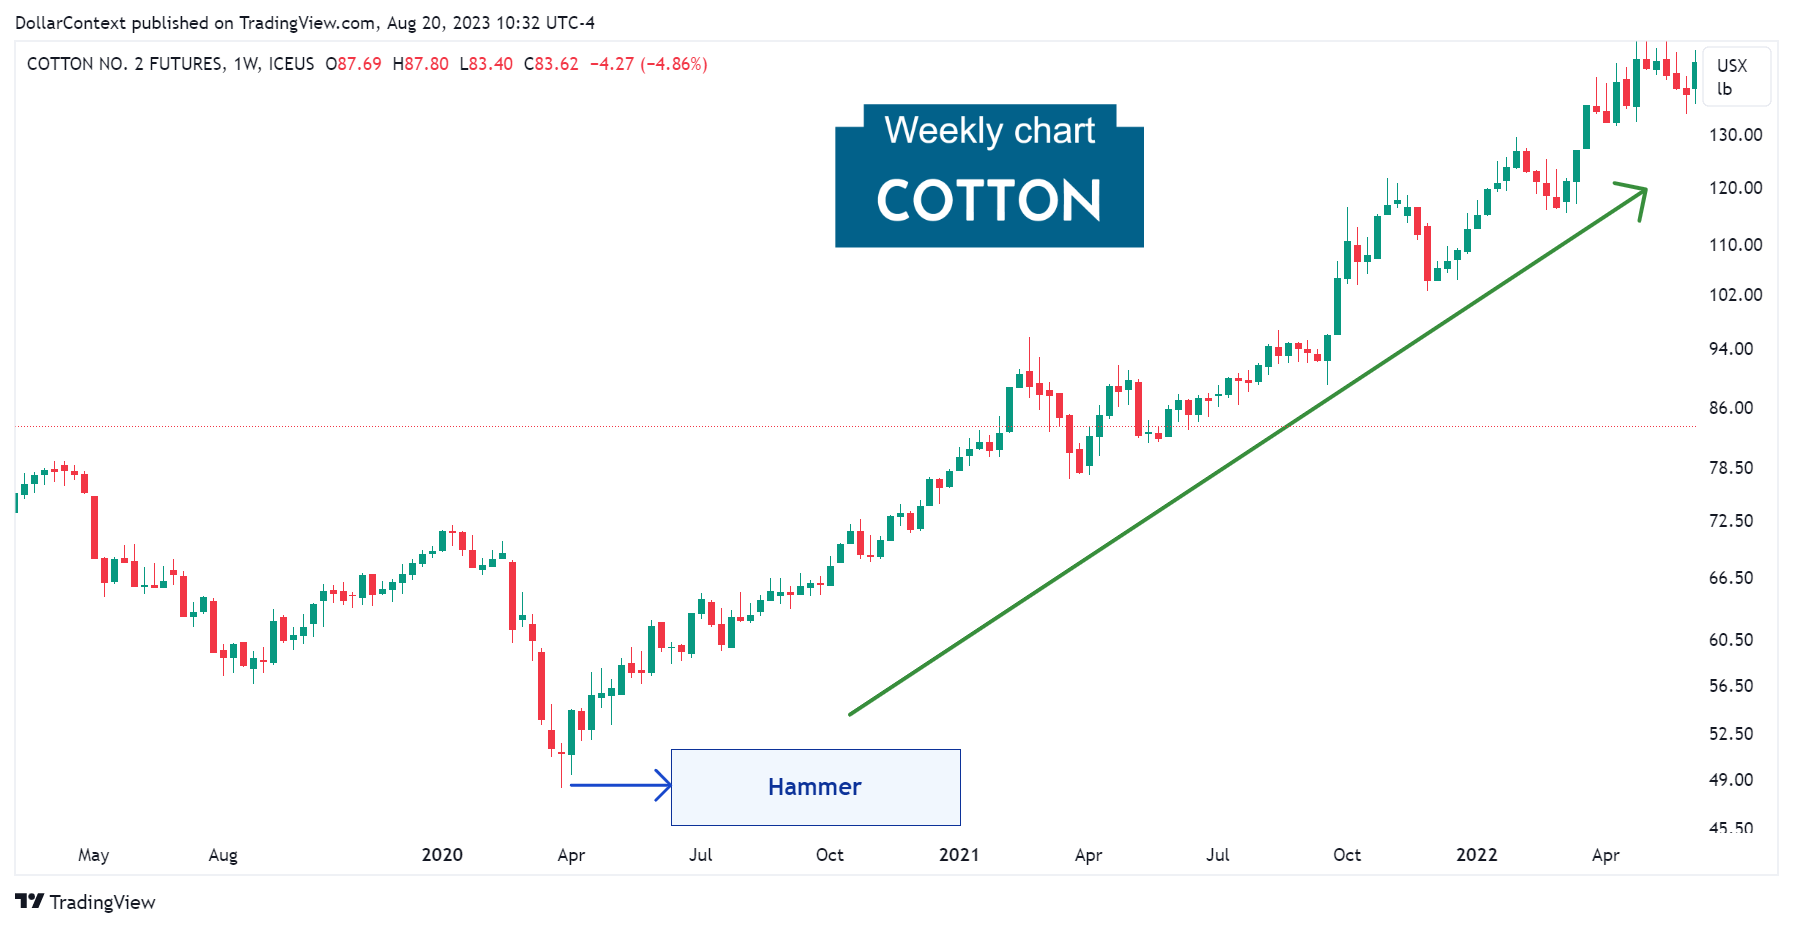
7.1 Cotton
In late March 2020, the cotton futures market revealed a hammer after a prolonged downtrend (not fully shown in the chart.) Observe how the session after the hammer effectively revisited the hammer's price range before embarking on a consistent upward trajectory.
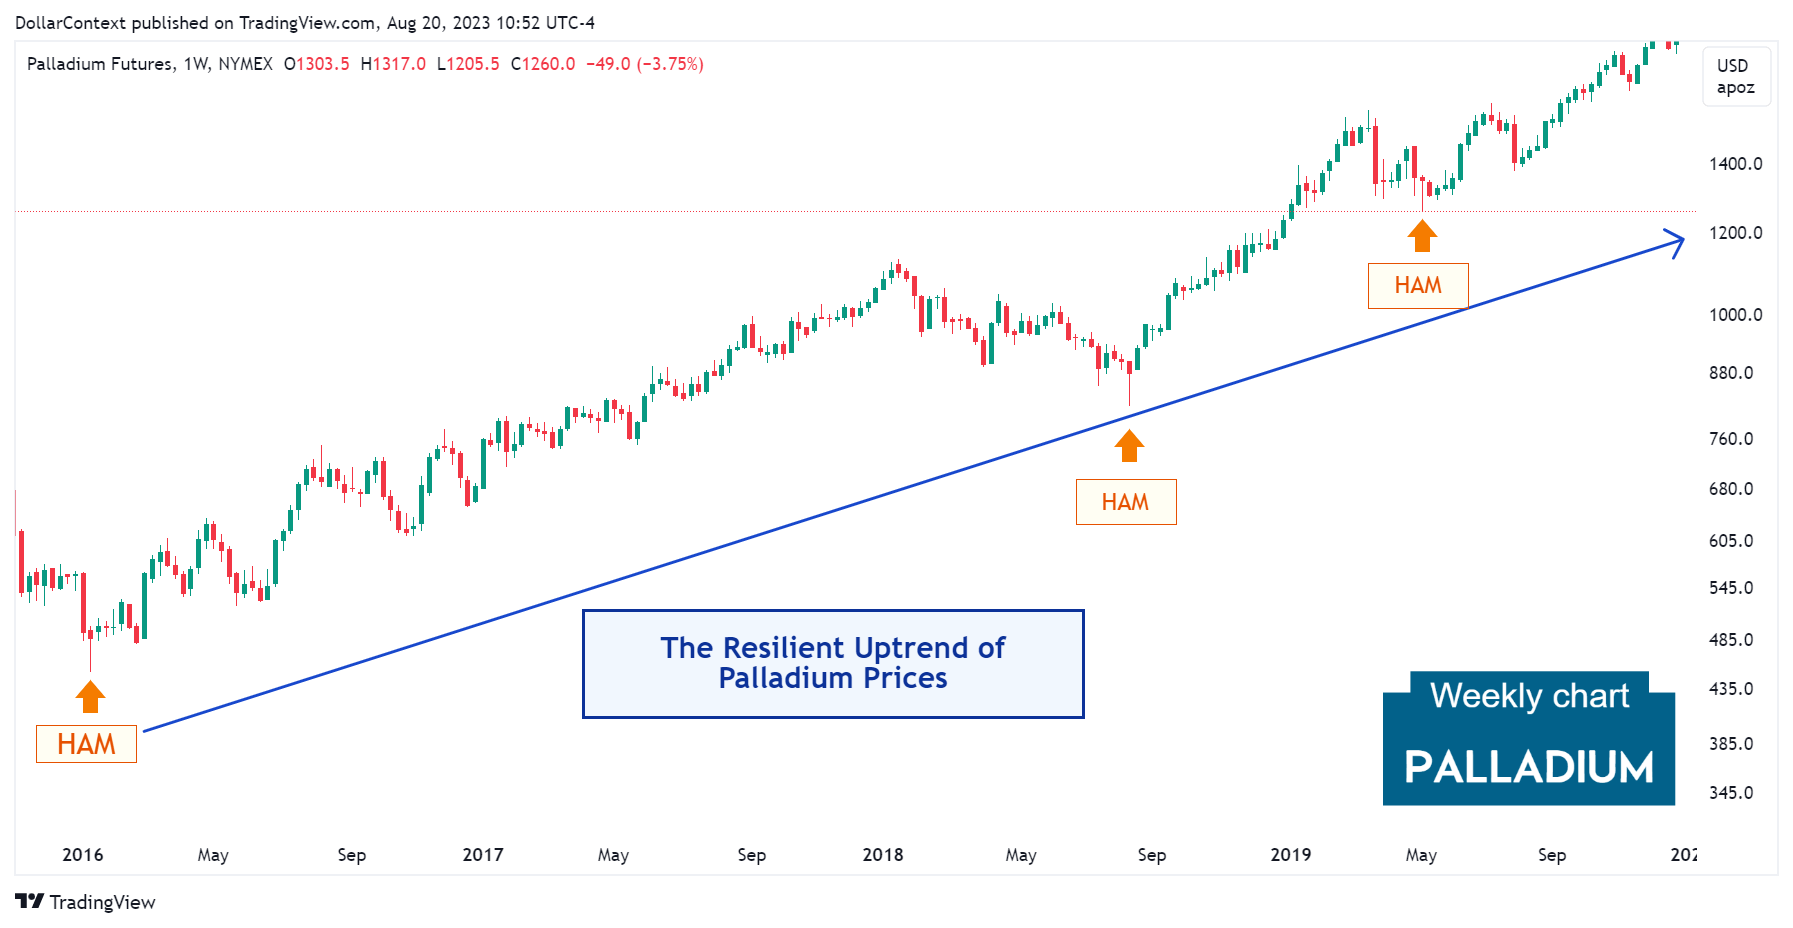
7.2 Palladium
In January 2016, the palladium market displayed a hammer pattern before initiating a significant uptrend. Observe that during the upward trend, two additional hammers (in August 2018 and May 2019) appeared, accurately signaling the conclusion of their respective corrections. The three of them are marked as "HAM" on the chart.
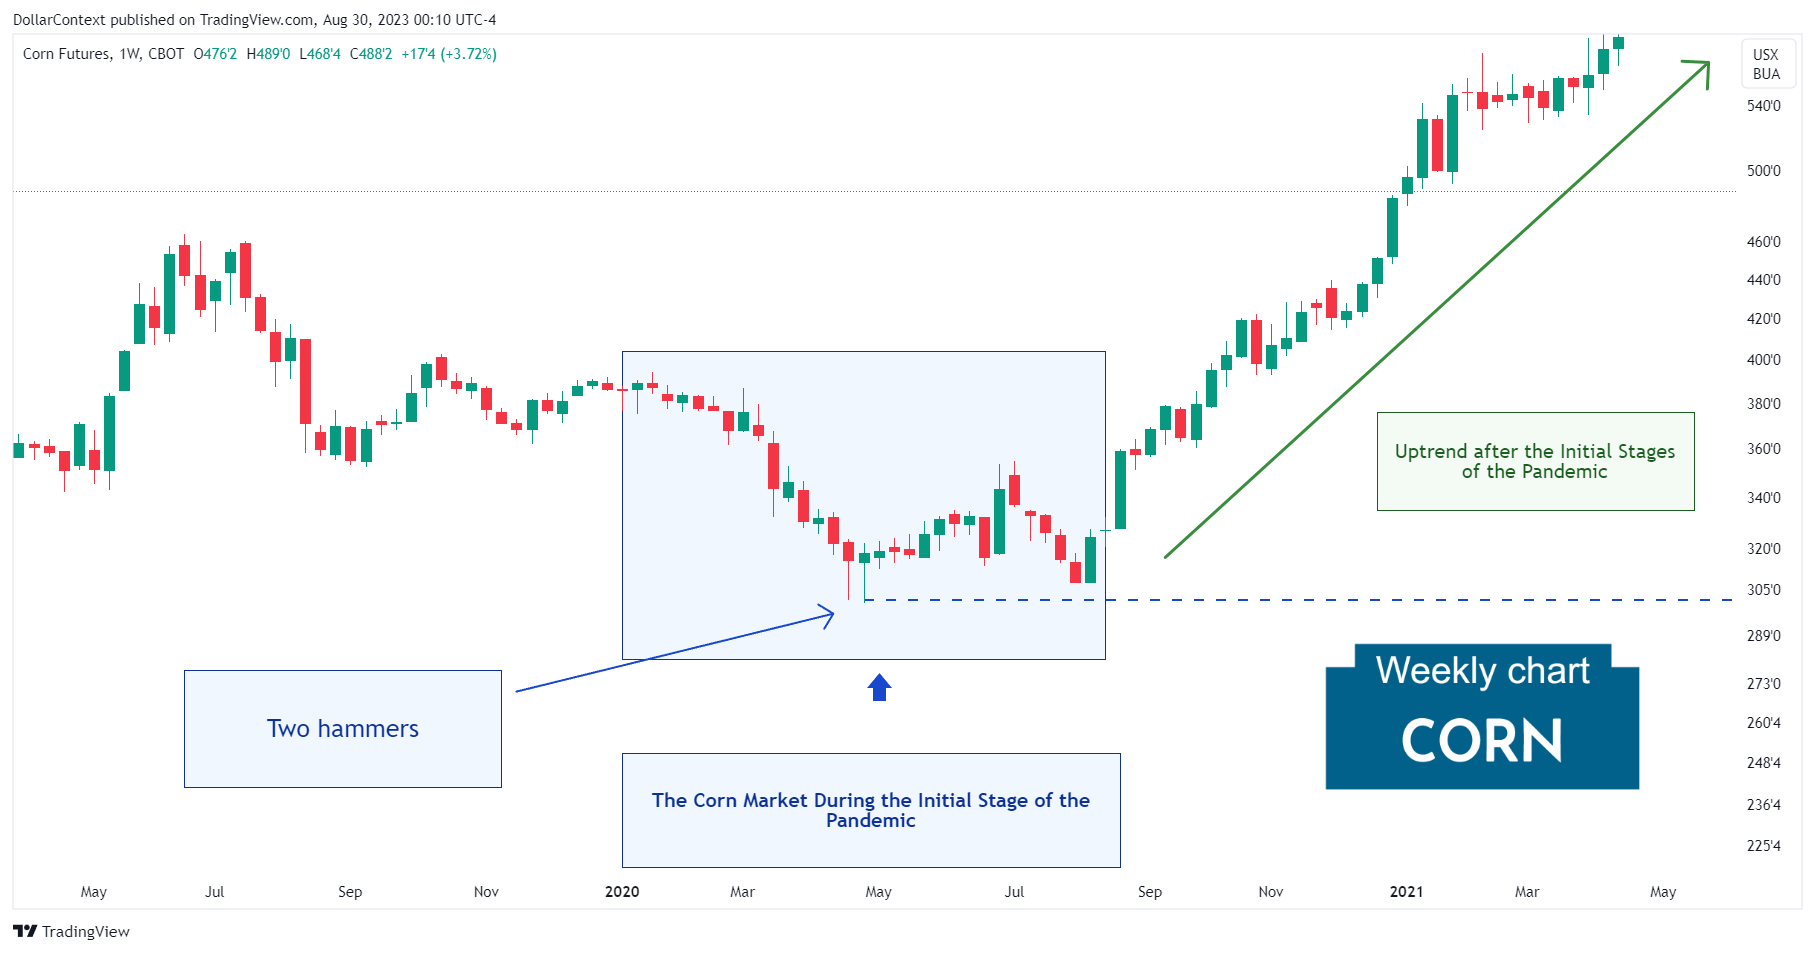
7.3 Corn Futures
The following chart shows how the clustering of candlestick patterns, in this case two consecutive hammers, reinforces each other and strengthens their bullish implications.
Also, note how the price range of both patterns serve as support, which was successfully tested in August 2020.
7.4 More Examples
- Case Study 0004: Hammer After Extended Downtrend (Gold)
- Case Study 0020: Hammer and Piercing Pattern (AUD/USD)
- Case Study 0028: Hammer and Long Lower Shadows (Natural Gas)


