The Psychology Behind a Hammer
In this post we cover the psychological implications of a hammer pattern within the domain of Japanese candlestick charts.


A hammer is a candlestick pattern that holds specific psychological implications for market participants. It typically appears after a downward price movement and signifies a potential trend reversal.
Here are the psychological implications behind this pattern:
- Initial Selling Pressure: At the beginning of the candle's formation, there is a surge of selling pressure, resulting in the price moving significantly lower. This downward movement represents the dominance of bearish sentiment, as sellers believe the price should decline further.
- Intriguing Buyers: As the price drops, it captures the attention of buyers who perceive the lower price as an opportunity. These buyers are often traders who believe the asset is undervalued and that a potential reversal is at hand.
- Intra-session Reversal Attempt: During the candle's formation, buyers begin to step in and push the price back up. This rally signifies a struggle between bullish and bearish forces and reflects the buyers' attempts to reverse the downtrend.
- Long Lower Shadow: The defining feature of a hammer is its long lower shadow, which illustrates how far the price dropped during the session. This shadow symbolizes the initial dominance of sellers, who managed to push the price down significantly.
- Bullish Resurgence: The most critical psychological aspect of a hammer is the closing price. If the closing price is higher than the opening price, it indicates a bullish resurgence during the session. This suggests that buyers gained control by the end of the period.
- Shift in Sentiment: The appearance of a hammer showcases a noteworthy shift in market sentiment. The decline in price initially attracted sellers, but the buying pressure that followed highlights the emergence of bullish sentiment, hinting at a potential reversal or at least a pause in the downward movement.
In essence, the psychology behind a hammer pattern encapsulates the narrative of a market temporarily overrun by sellers, only for buyers to regain control and spark a potential reversal. The pattern reflects the ebb and flow of emotions and decision-making among market participants as they assess the value and potential direction of an asset's price.
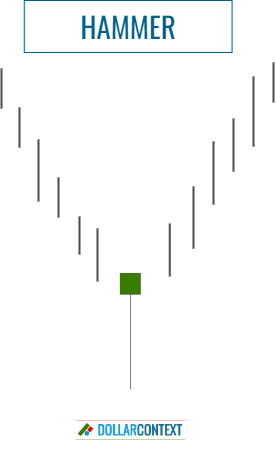
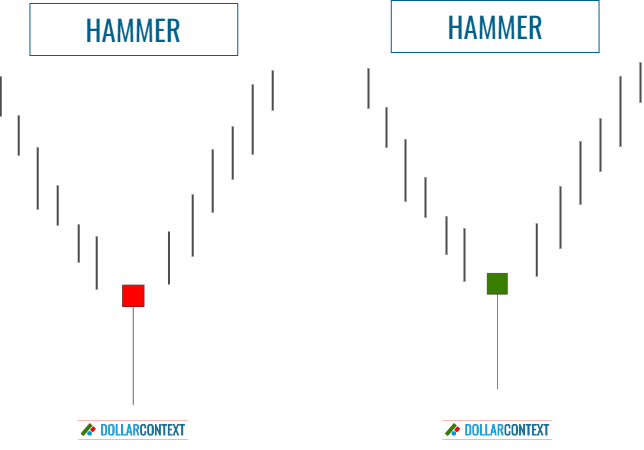
While a white/green real body is generally considered more bullish, a hammer's real body can be either white/green or black/red.
Frequently, hammers establish or validate support zones, contributing to their importance. This aspect strengthens the psychological dimension of the pattern, as traders interpret the support level as a crucial juncture where buyers have intervened, and it can serve as a protective stop.
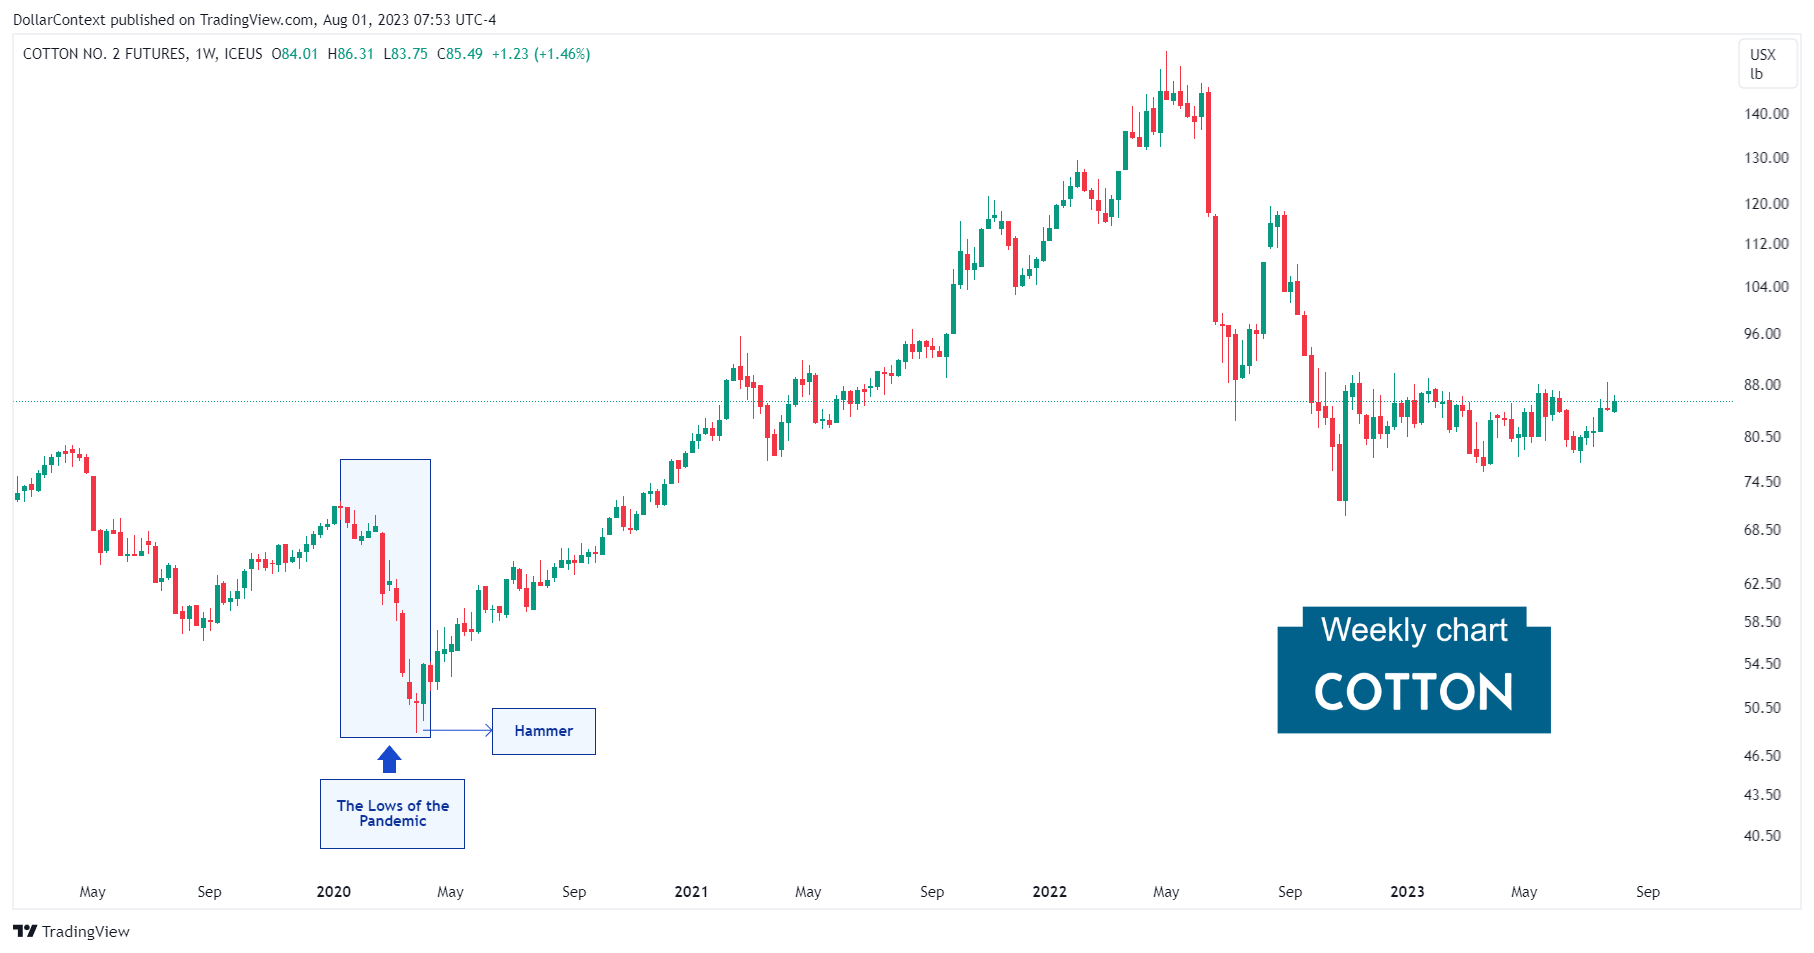
Bear in mind that the shape of a hammer is as important as the context in which this pattern arises. A hammer is a bullish reversal indicator, implying that there should be a preceding downtrend that the pattern seeks to reverse.
The provided example highlights the significance of a hammer as a reversal indicator. Observe the change in market sentiment within the cotton market following the emergence of this pattern, leading to a noticeable uptrend thereafter.