How to Identify a Hammer Pattern
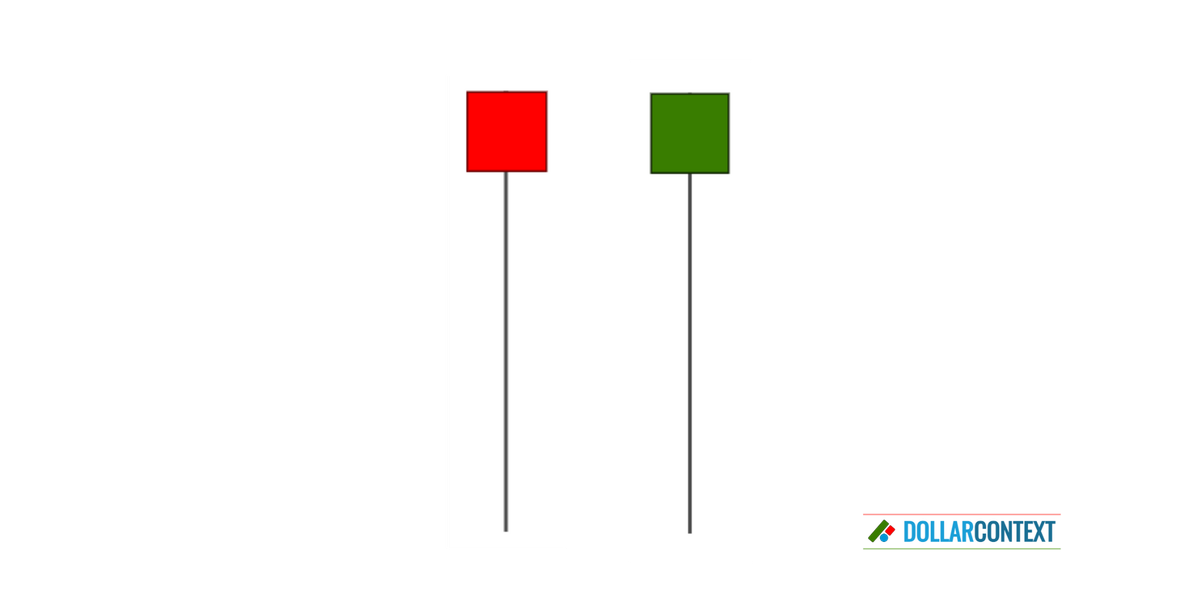
The hammer pattern consists of a candle with a small real body at the upper end of the session and a long lower shadow.
This article is part of the Hammer candlestick pattern tutorial series. For the complete guide, see the Hammer Candlestick Pattern — Complete Guide.
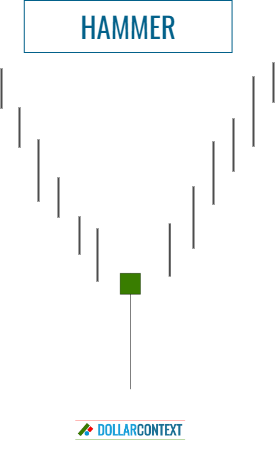
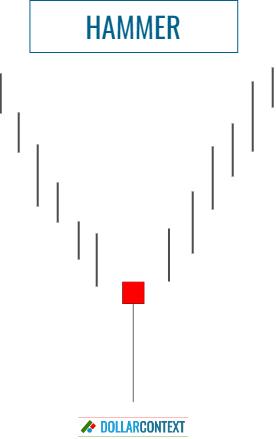
In Japanese candlestick analysis, a hammer is a bullish reversal pattern that comes after a downtrend and indicates a possible shift towards an upward trend. The following attributes characterize a hammer:
- Small Real Body: A hammer has a small real body at the upper end of the candle. This body can be either red (or black) or green (or white), but a green/white body is considered slightly more bullish.
- Long Lower Shadow: This candle line has a long lower shadow that is at least three times the size of its real body. This protracted lower shadow of a hammer represents psychologically a failure by the bears to sustain lower prices, with the price pushed back up to close near the high of the session.
- Extremely Short or Absent Lower Shadow: The body should have minimal or no lower shadow above it.
- Preceded by a Downturn: A hammer symbolizes a positive sign that indicates a possible trend change to the upside. Therefor, for it to be meaningful, it must appear after a robust or well-established downtrend.
- Relative Size of the Candlestick: The general size of a hammer, basically determined by the length of its real body and lower shadow, should be significant in comparison to most of the preceding sessions.
According to the author Steve Nison, the term "hammer" originates from the concept that the market is "forging a foundation." This implies that the bottom is so robust, it withstands attempts to breach it, similar to a solid structure that is robust or durable enough to withstand the impact of a hammer.
As stated above, a hammer can have a black or red body as well. In fact, the context in which this pattern emerges is usually more relevant than the color of the real body itself.
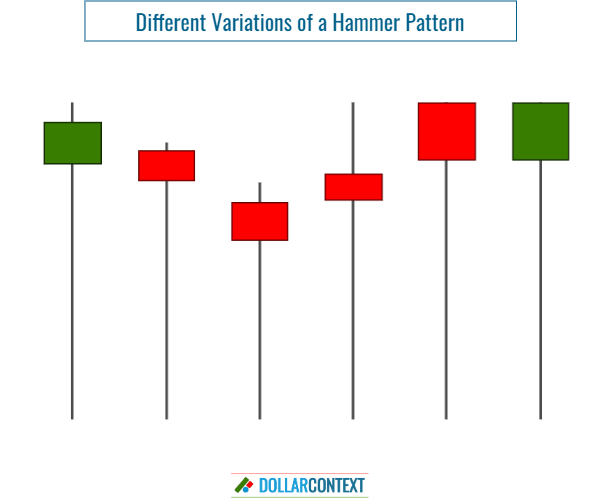
The hammer models depicted above showcase the 'ideal' forms of this pattern. However, variations that might not perfectly fit these ideal characteristics can still be classified as hammers and serve as effective bullish indicators in some situations. These include instances where the lower shadow is slightly shorter, the real body is a bit larger, or the upper shadow is marginally longer. Generally, though, it's preferable if the lower shadow is longer, the real body is smaller, and the upper shadow is minimized or nonexistent.
A hammer is essentially the inverse of a shooting star in candlestick charting. While a hammer indicates a bullish reversal following a downtrend with its small upper body and long lower shadow, a shooting star suggests a bearish reversal after an uptrend, characterized by a small lower body and a long upper shadow.
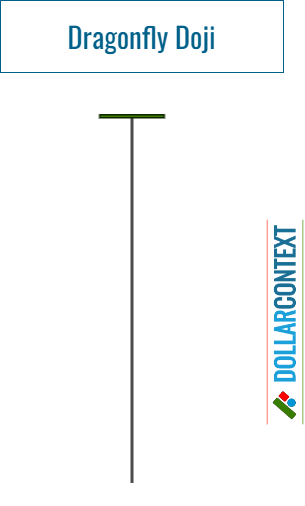
If the open, close, and high prices of a hammer are all at the same level or very close, the pattern is usually called "dragonfly doji". This pattern resembles a "T" shape and looks like a dragonfly, hence its name.
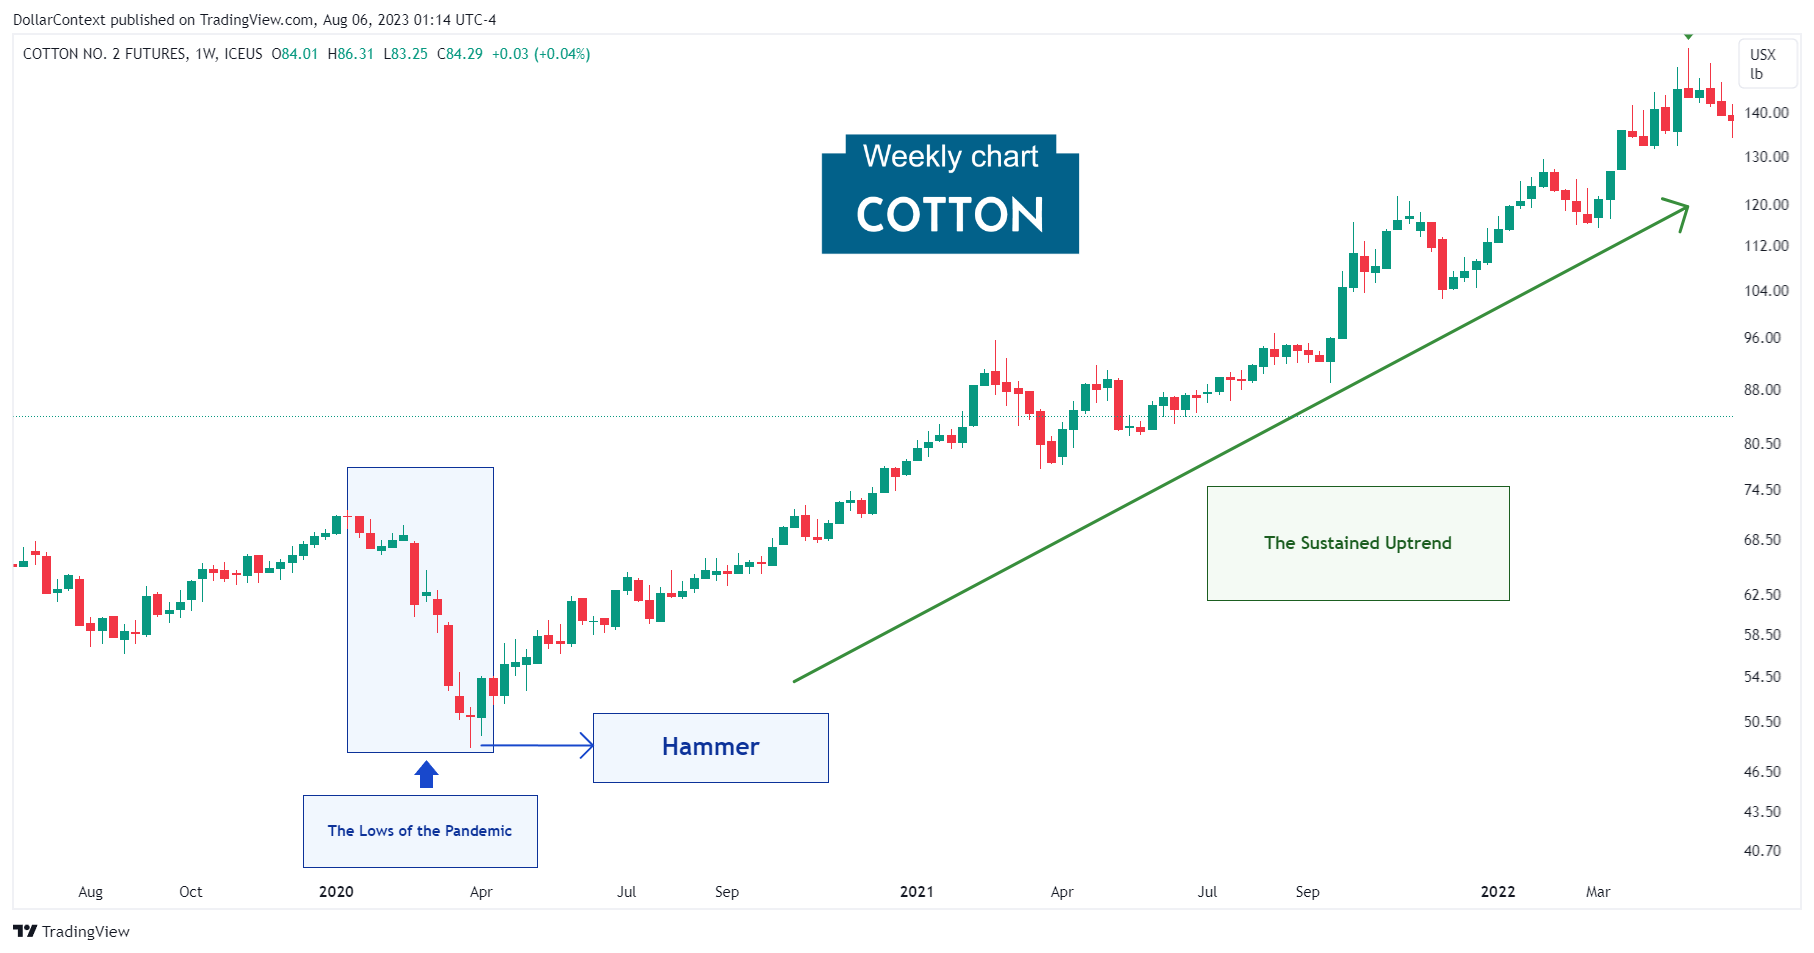
The following cotton futures chart displays a hammer pattern at the close of March 2020, which correctly signaled a bullish shift. Note the clear downward trend leading up to the pattern, followed by the robust and expansive rally that ensued.