Using the Hammer Pattern to Identify Support
A hammer creates a support area or confirms the credibility of a previously identified support zone.

Within the domain of Japanese technical analysis, a hammer is a single-candle pattern featuring an elongated lower shadow and a condensed real body positioned close to the session's highest point. This pattern can function as an indicator, suggesting the possibility of a reversal in the ongoing downtrend.
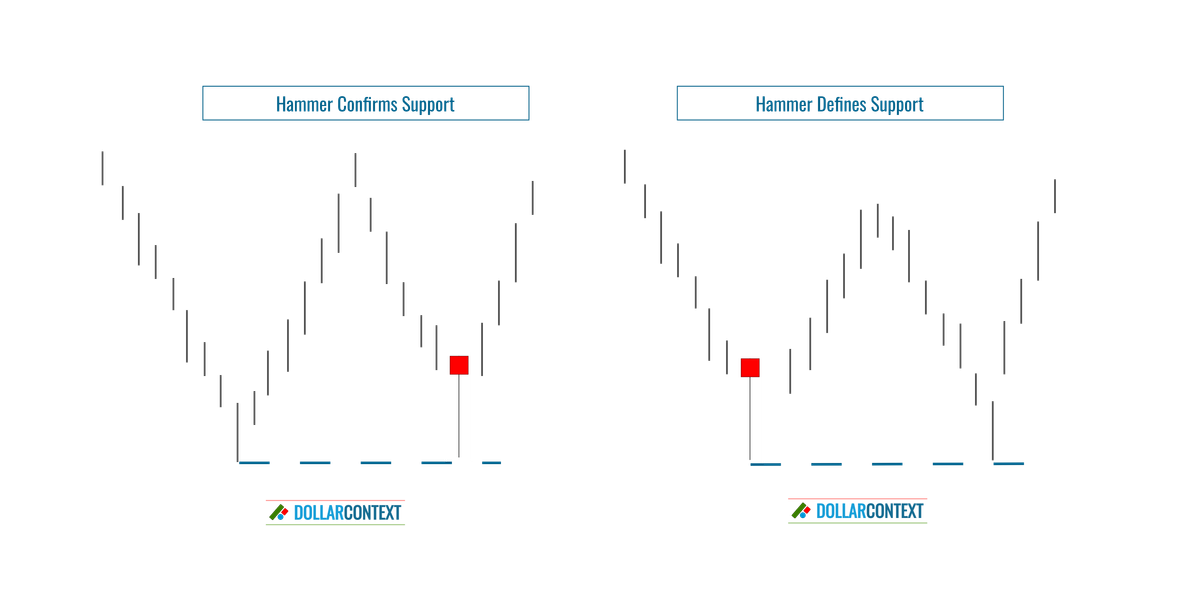
The price range associated with a hammer often transforms into a support zone. Specifically, the lowest point of this candle line either establishes or strengthens a support level. In this context, two distinct scenarios can be differentiated:
- When a hammer surfaces within a previously established support zone, it effectively reinforces this support.
- When a hammer appears at a new low, it defines a new support area.
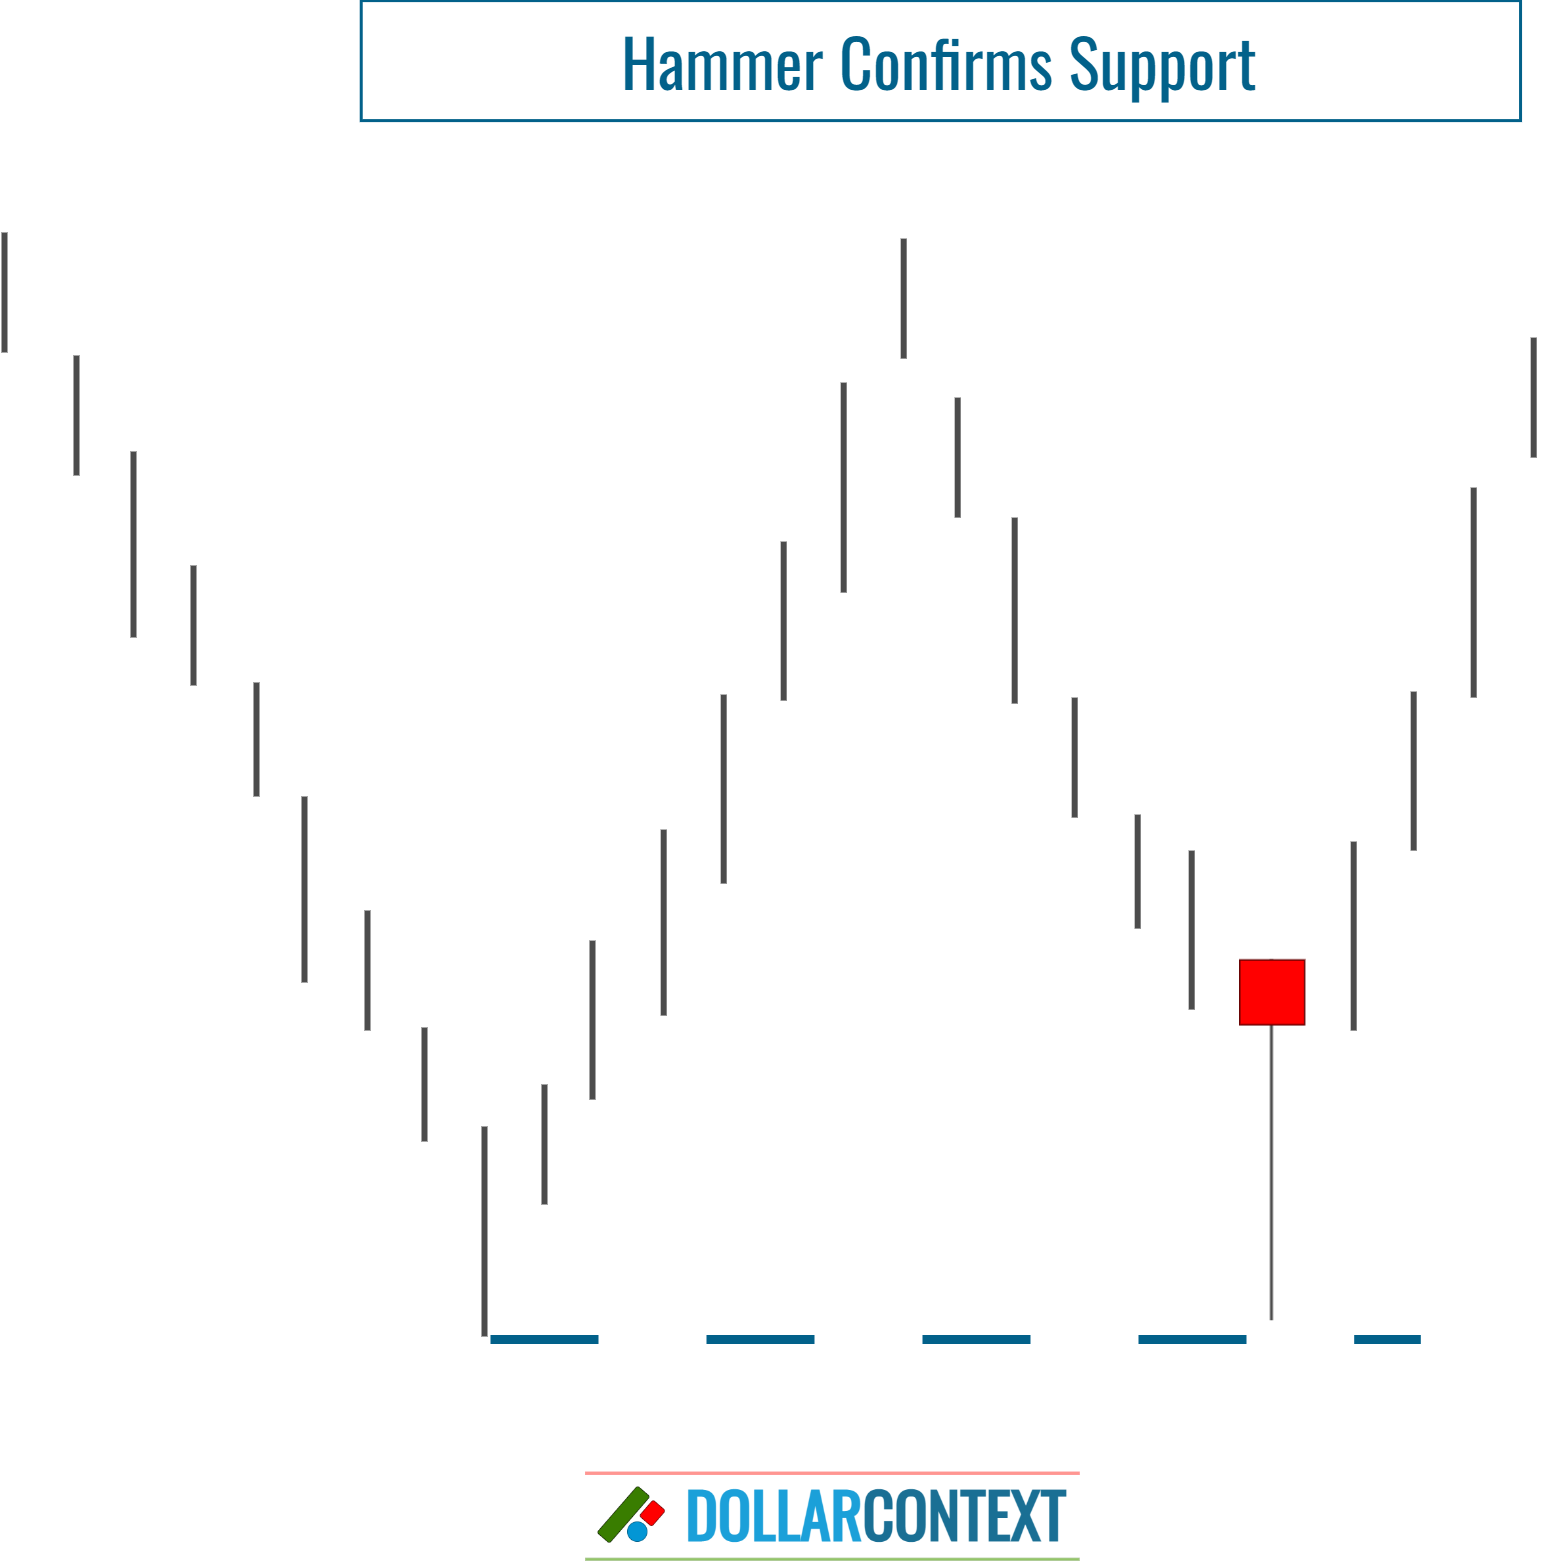
1. Hammer Confirms Support
If this pattern emerges in a support zone that can be recognized beforehand, the hammer enhances the credibility of that support and increases the likelihood of a successful trend reversal.
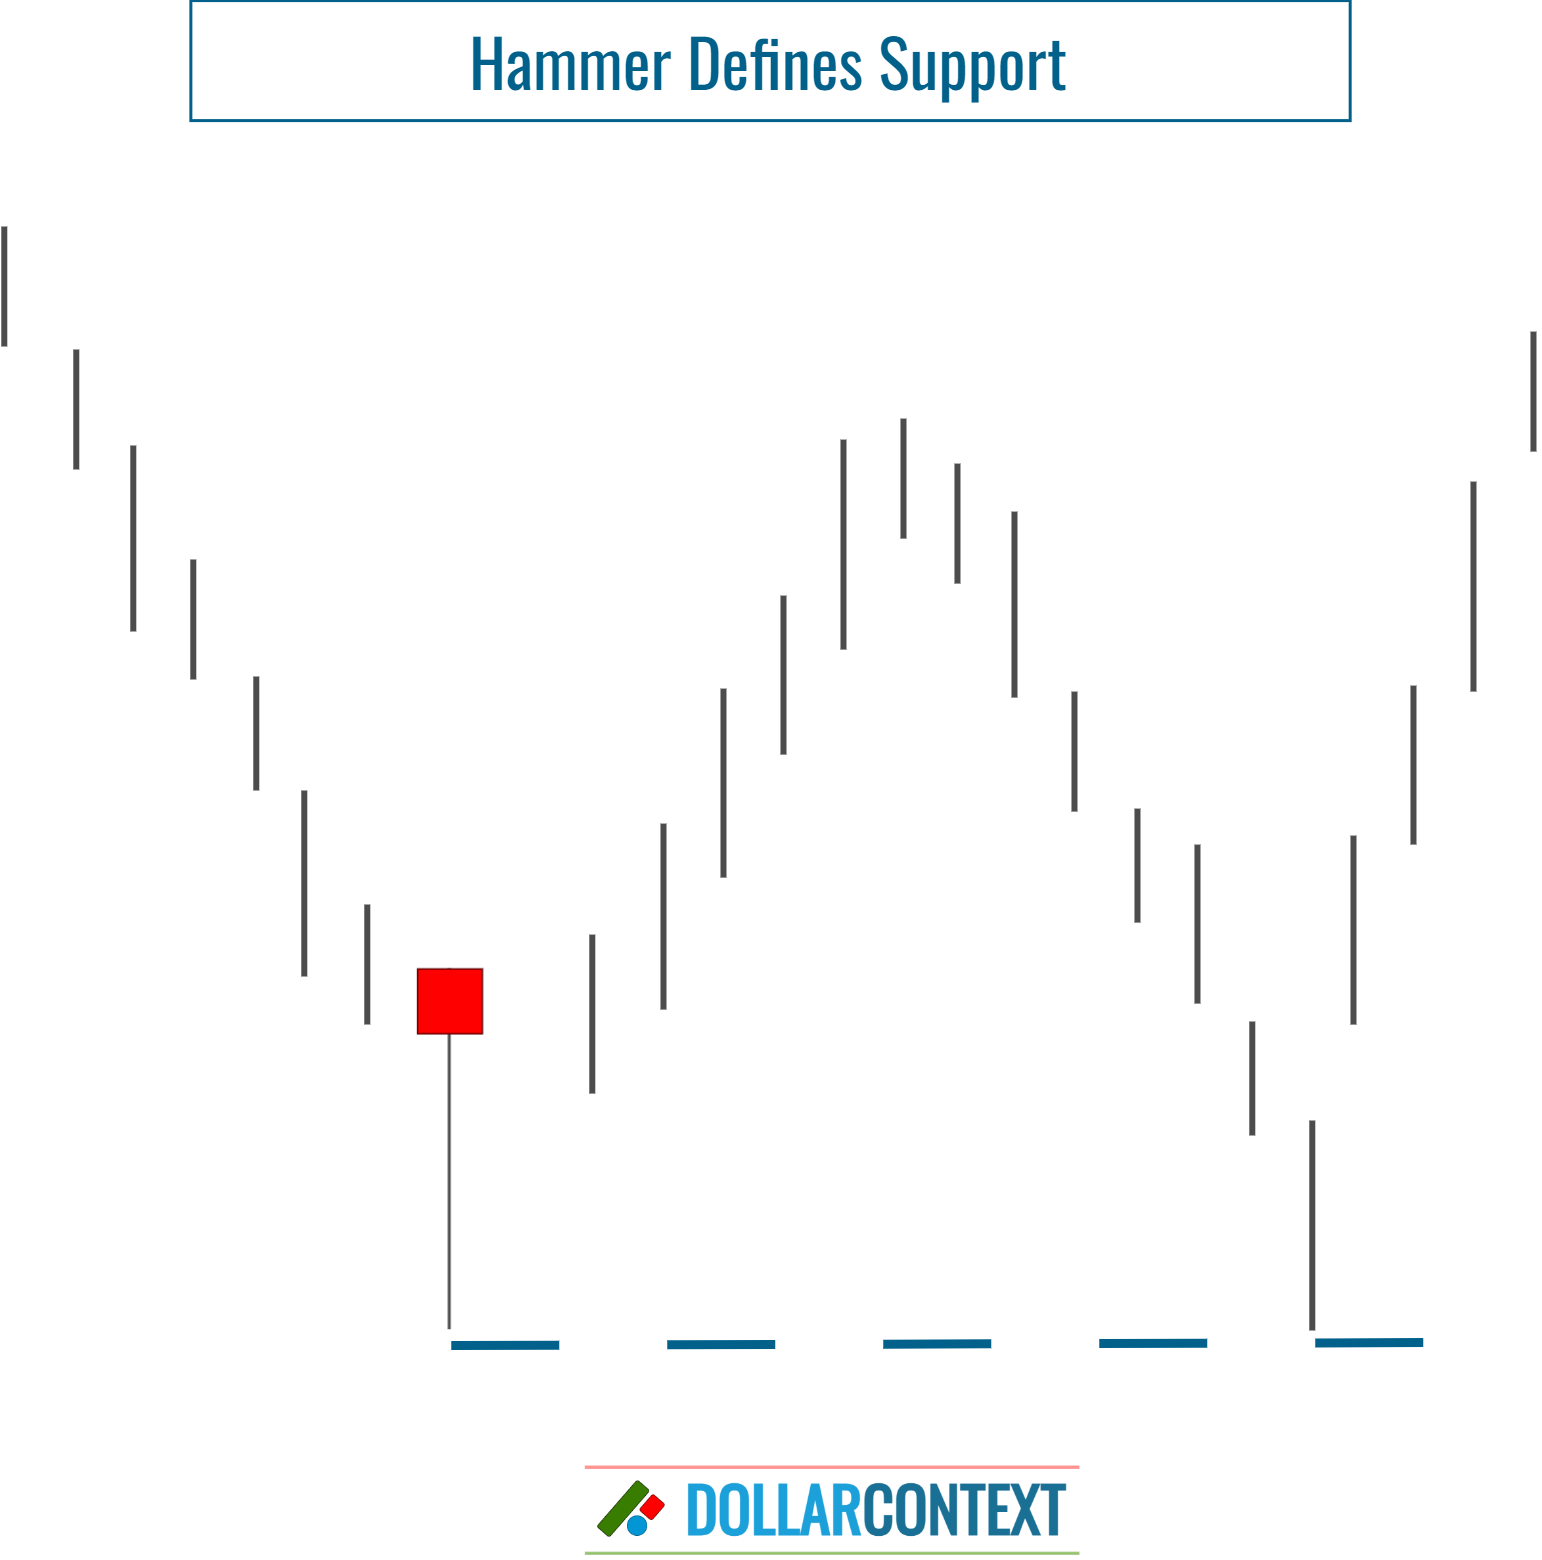
2. Hammer Creates Support
If the hammer sets a new low, it defines a new support area, which can be tested in the future.
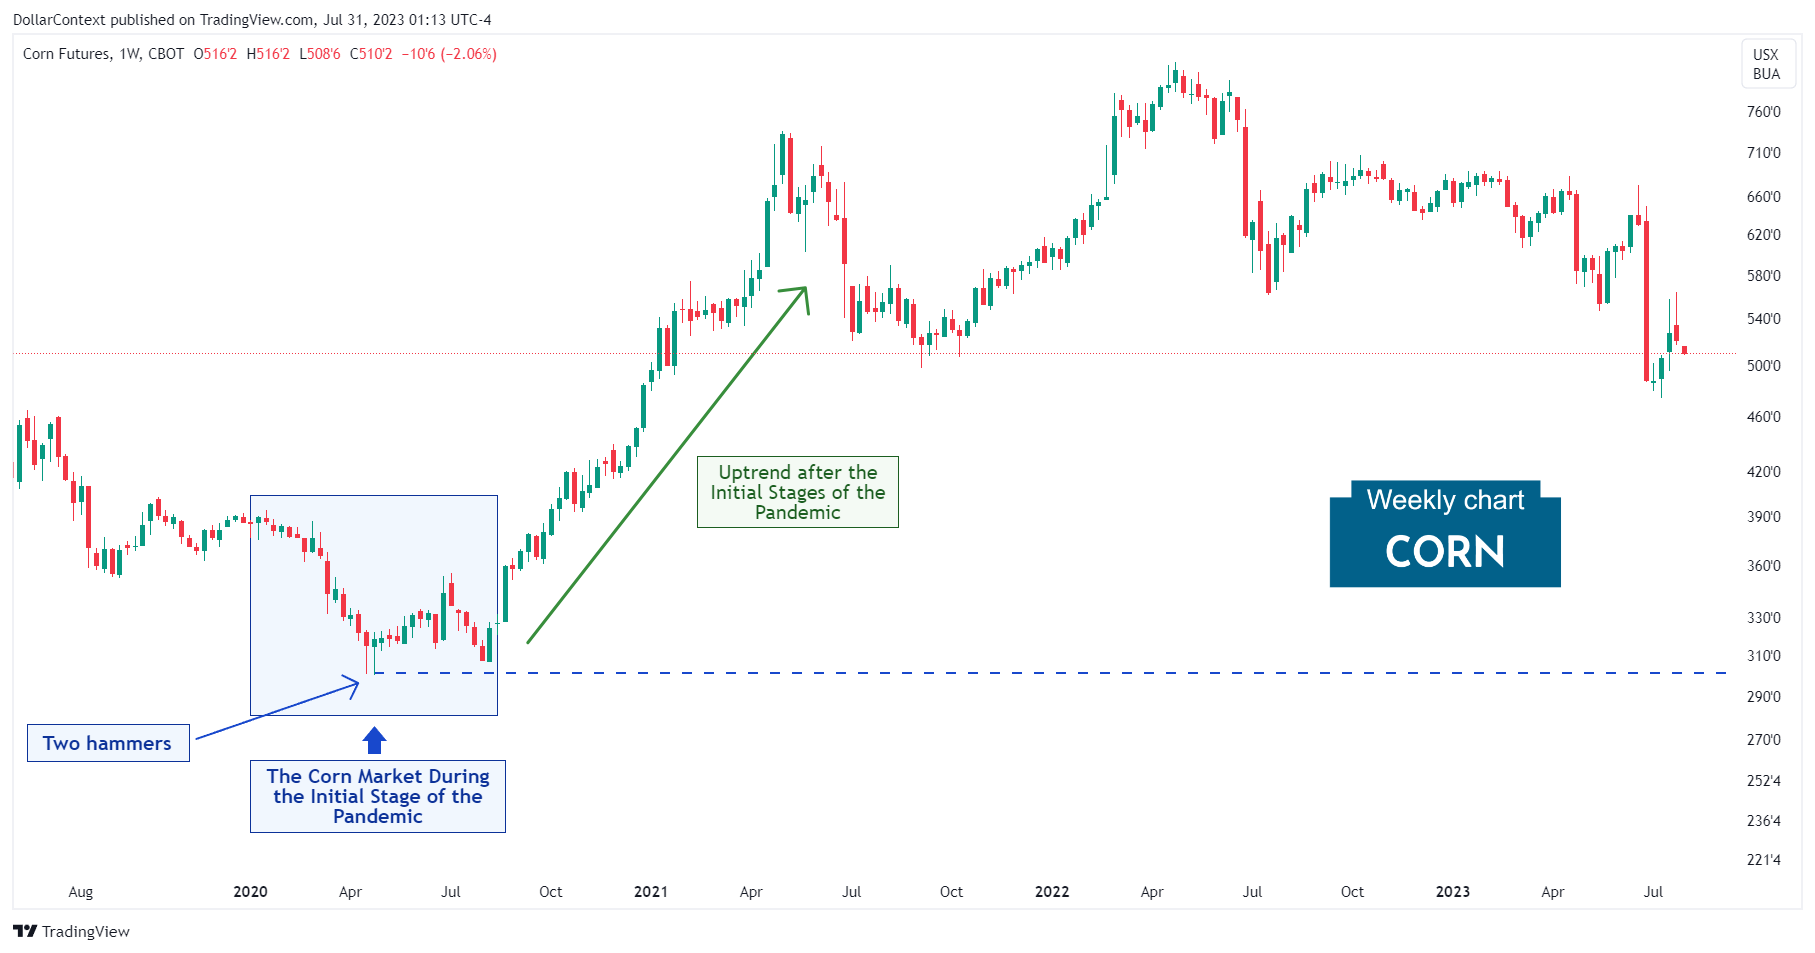
In April 2020, the weekly chart of the corn market displayed two consecutive hammers. Observe how the support region established by these patterns was effectively tested in the latter part of the year, leading to a notable uptrend.
Remember, being a reversal signal, a hammer candle psychologically reflects a potential shift in market sentiment.
3. Breakout of the Support Level
Similar to all forms of technical analysis, it's crucial to have a specific price level where you reassess your initial strategy, particularly within the framework of a support level established by a hammer pattern.
If a session closes clearly below the support set by a hammer, there is a likelihood that the market will persist in its downward path. Keep in mind, however, that this is not always the case.
4. False Breakouts
A breach of a support level is often seen as a potential trading signal, suggesting that the price may continue in the direction of the breakout. Nevertheless, it's not unusual for the market to defy these projections. Instead of maintaining momentum in the same direction, it occasionally reverses and retraces its movement back within the previous range.
In order to minimize the risk of being stopped out while employing a hammer strategy, you can follow these guidelines:
- Establish your stop-loss based on the closing price of a session, rather than relying on intra-session price fluctuations.
- Consider incorporating a margin of safety (buffer) into your initial stop-loss level with a hammer.
- Keep in mind that the credibility of a breakout considerably weakens when one or more candlestick patterns emerge around the initial support level established by the hammer.
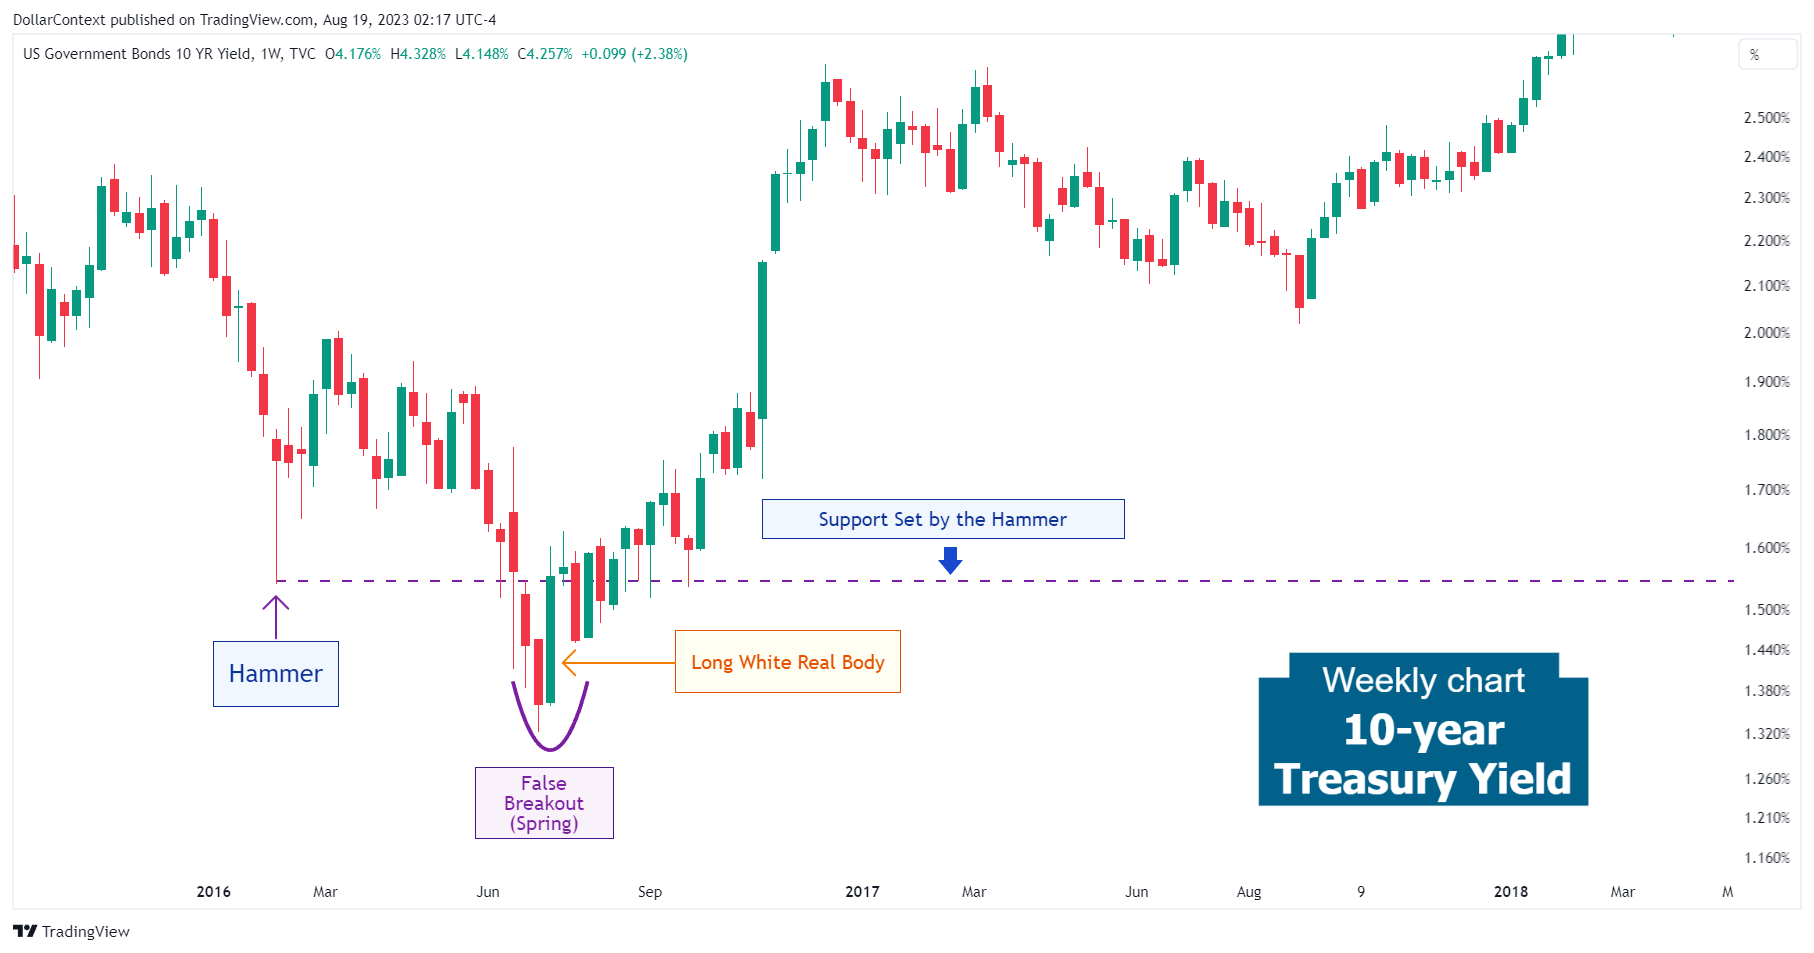
The chart depicting the 10-year treasury yield clearly demonstrates how perplexing the initial breakout of a support level, established by a hammer candle, can be. Observe that after breaking through the lows set by the hammer, the price action swiftly recovered, as indicated by a long white real body. Subsequently, it stabilized above this region before beginning a significant new uptrend. Such downward false breakouts are known as springs.