High-Wave Candle: How to Set Your Stop-loss
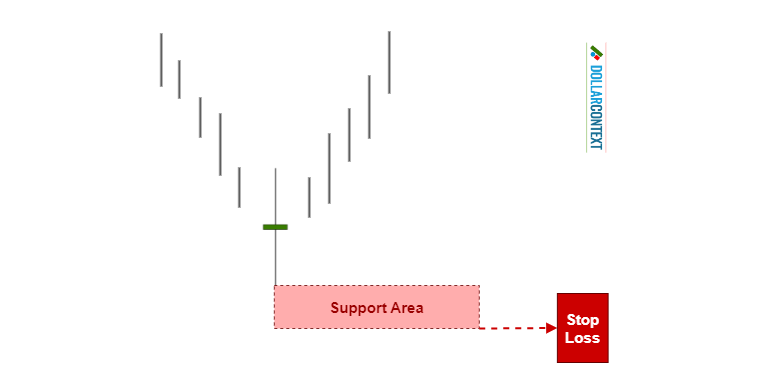
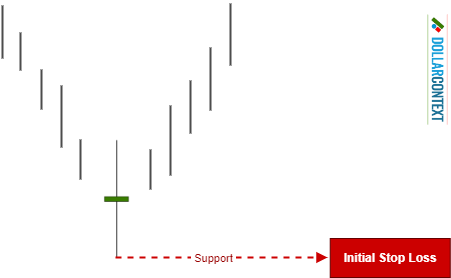
After a downtrend, the lowest price reached during the high-wave’s session sets up a support level.
This article is part of the High-Wave candlestick pattern tutorial series. For the complete guide, see the High-Wave Candlestick Pattern — Complete Guide.
Candlestick patterns in general, and high-wave candles in particular, help traders make more informed decisions about when to enter trades. When using candlestick techniques, setting an appropriate stop-loss is crucial for managing risk.
Here's a step-by-step guide on how to place your stop-loss after the emergence of a high-wave candle:
1. Correct Identification
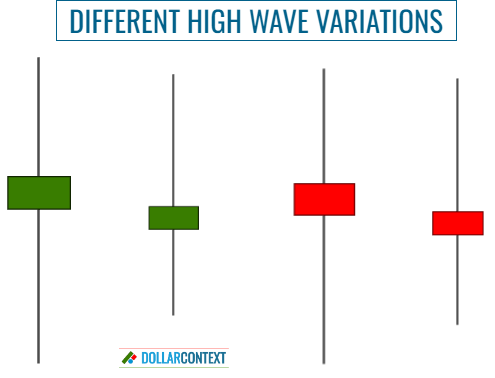
Make sure you correctly identify the high-wave candle on your chart. This type of candle has unusually long shadows and frequently, but not always, a diminutive real body.
2. Verify the Prior Trend
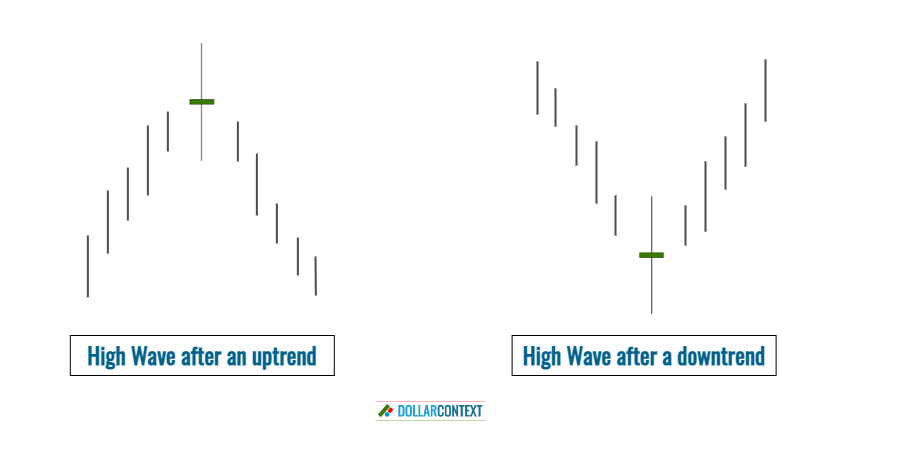
Psychologically, a high-wave candle reflects volatility, equilibrium, and indecision in the market. It is a reversal indicator, and as such, should have an uptrend or downtrend to reverse.
If the market is trading sideways, the high-wave is echoing, on a microscale, the indecision reflected on a more macro scale by the market's lateral movement.
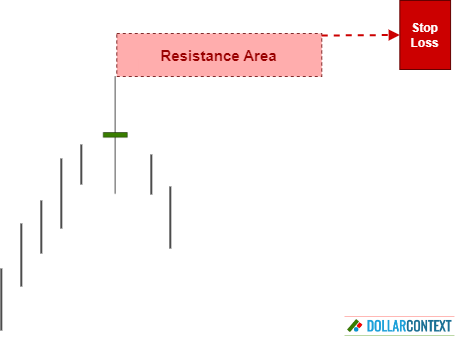
3. Identify the Initial Stop-loss Level (Support/Resistance)
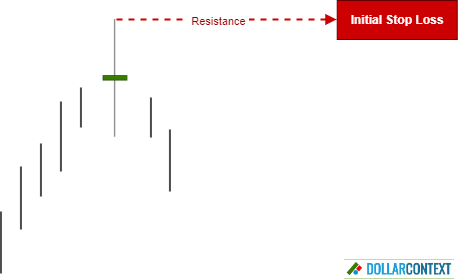
The highest price reached during the candle’s session sets up a resistance area (after an uptrend). When using high-waves as reversal indicators, this resistance level represents your initial stop-loss.
Following the same logic after a downtrend, the lows of the line should become support, and therefore your preliminary stop-loss level.
4. Consider Adding a Buffer
Depending on market volatility, risk management, and other market conditions, you can add a buffer to prevent being stopped out due to false breakouts.
5. Is Your Stop Based on the Close?
A stop triggered on a close occurs when the stop-loss level is breached at the closing price, rather than being solely dependent on the intra-session price action.
Determine whether to place your stop on a close above the resistance level (or below the support level). When using candlestick charts, a stop on a close is generally recommended.
6. Monitor the Trade
Continuously monitor the market and your position to ensure it remains in line with your trading plan:
- Adjust your stop-loss level if necessary. Market conditions have the potential to fluctuate. For example, as the trade progresses, additional candlestick patterns may emerge, further reinforcing the initially established resistance/support area. In such a scenario, you have the option to make slight adjustments to your stop-loss level to align with the new market structure.
- In case of favorable price movements, consider trailing your stop-loss to lock in profits and manage risk.
- Stay disciplined. Avoid emotional decisions, even if the market is volatile.


