
Visual Characteristics of the Morning Star Pattern
In this article, we'll explore the layout of a morning star pattern in Japanese candlestick analysis and how to identify this bullish reversal indicator.

In this post, we'll explore the layout of the morning star pattern in Japanese candlestick analysis and explain how to recognize this reversal indicator.
The Basic Shape of a Morning Star
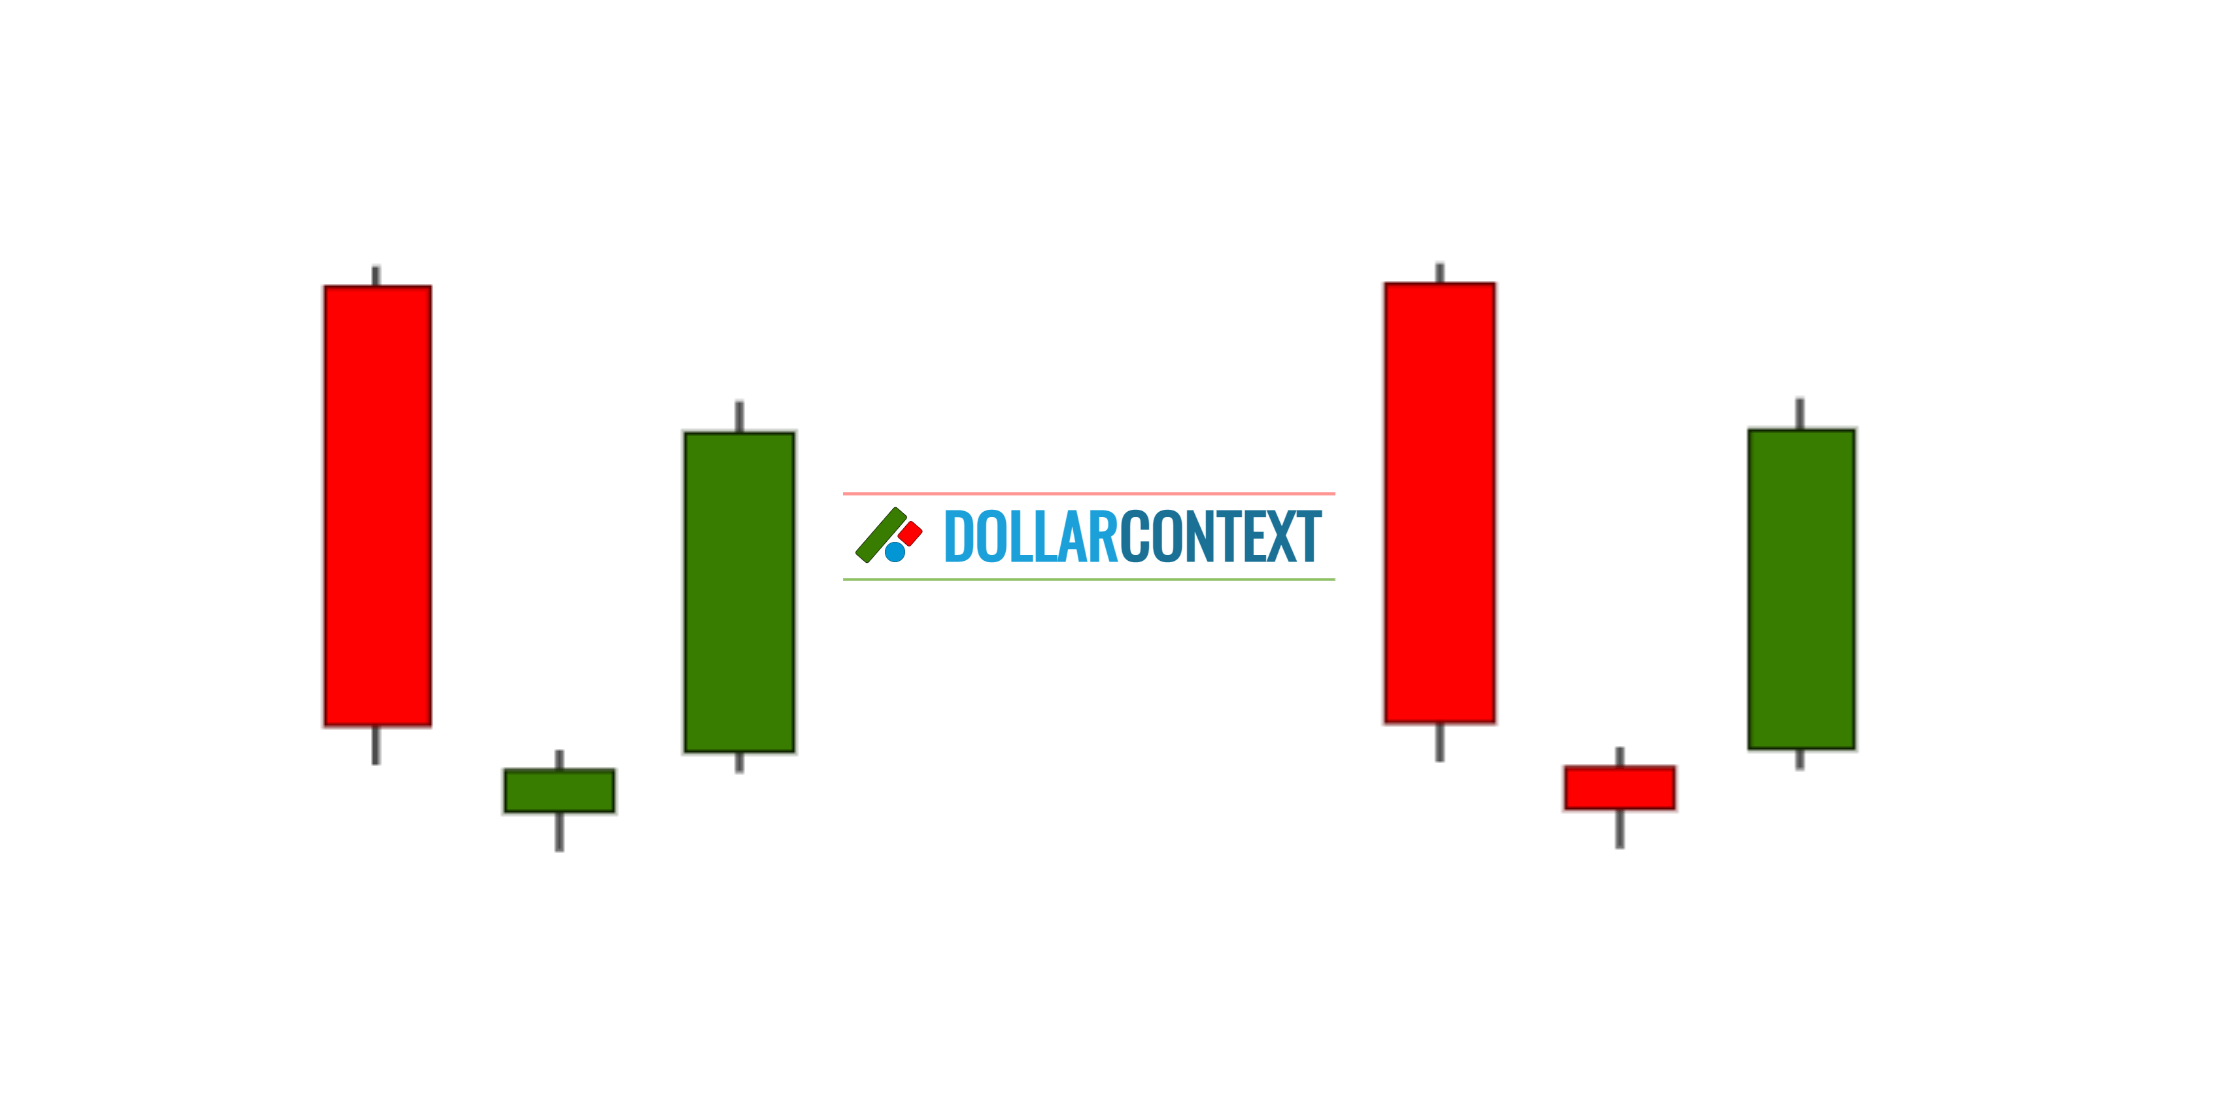
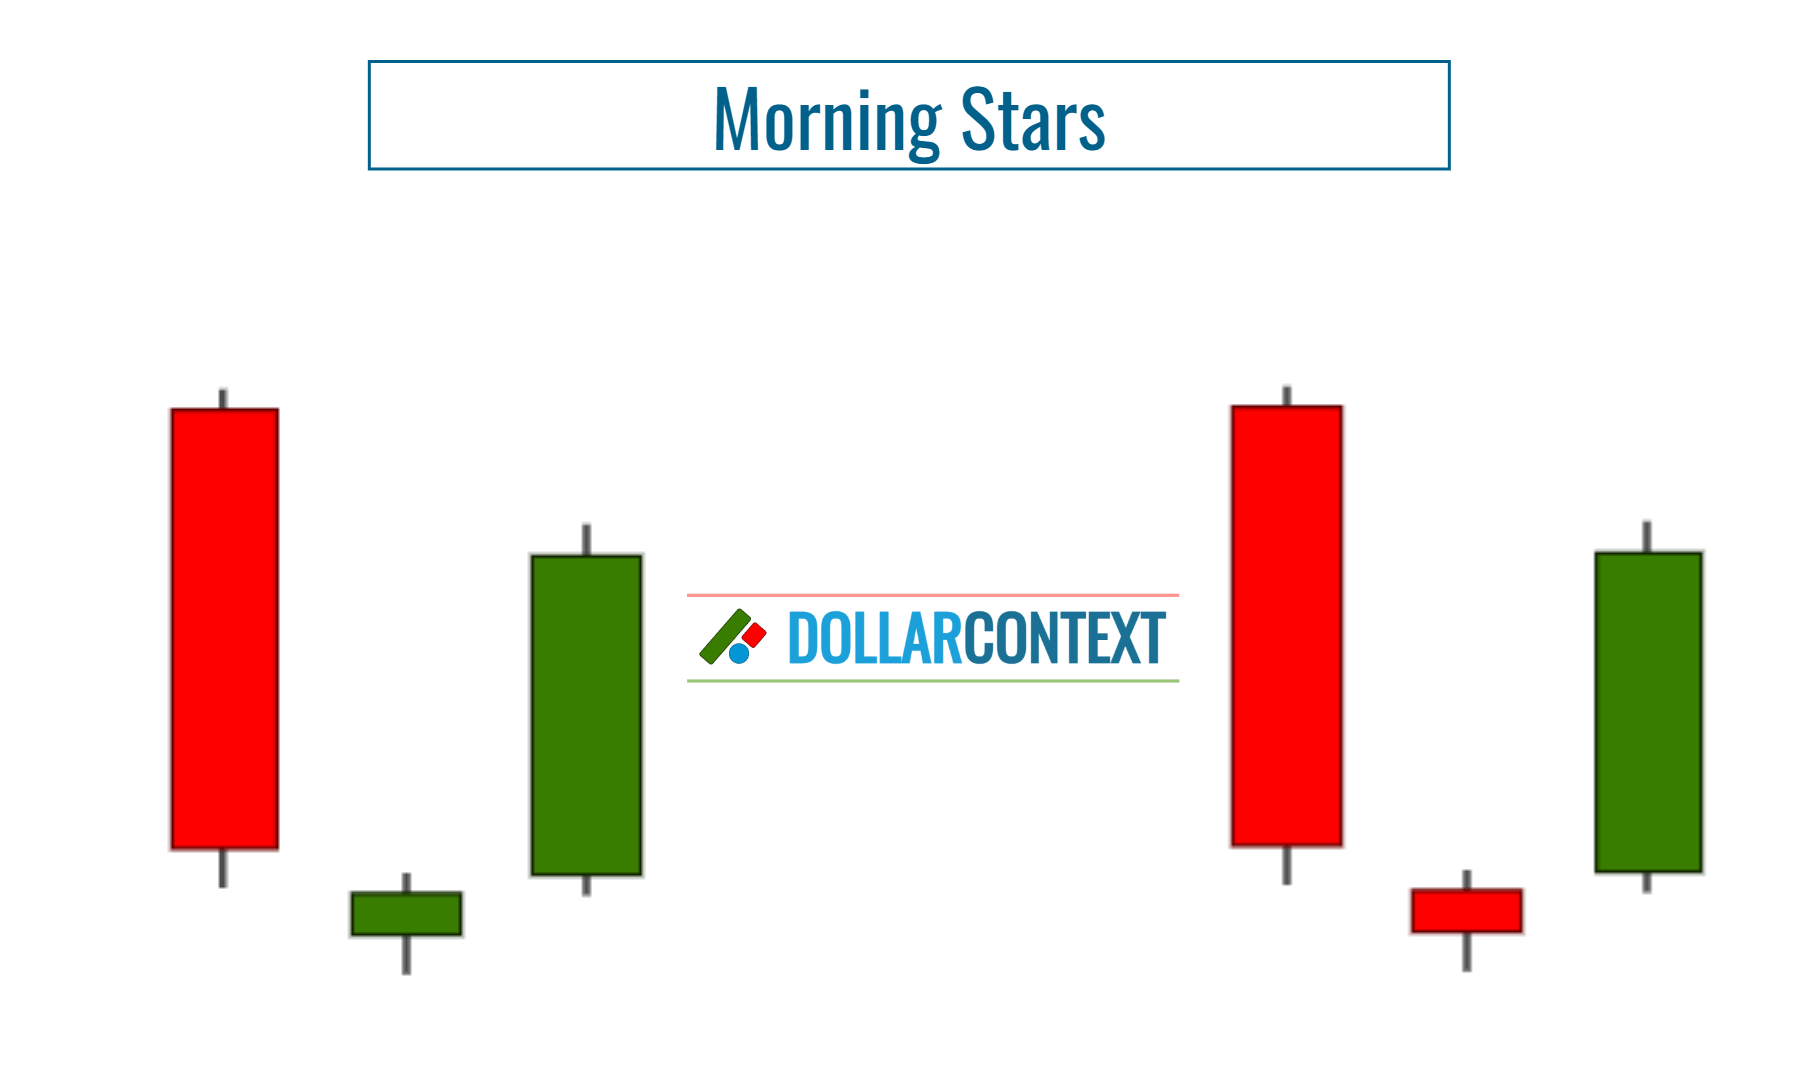
The morning star is a bullish reversal pattern that typically occurs at the end of a downtrend. It consists of three candlesticks:
- First Candle: A long bearish (red) candle that signifies a continuation of the preceding downtrend.
- Second Candle: This is a small-bodied candlestick (also called a "star"), similar to a doji or a spinning top. This candle gaps down from the close of the first candle, indicating hesitation and a potential change in market sentiment.
- Third Candle: A strong bullish (green) candlestick that closes well into the body of the first candle, preferably more than halfway. Potentially, this candle implies a bottom reversal and the beginning of a new uptrend.
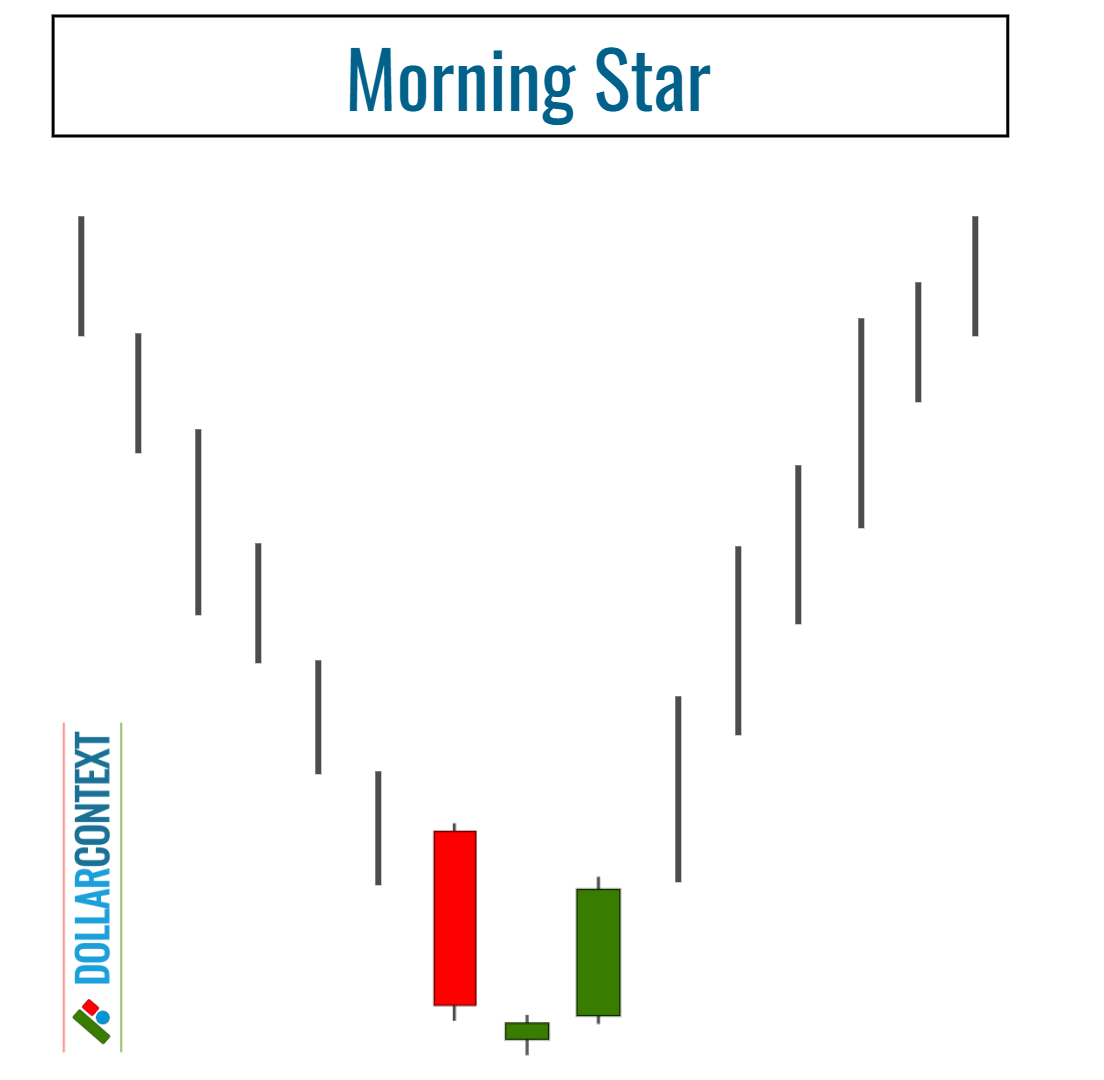
The overall shape of the morning star resembles a beacon of light in the chart, signaling the dawn of a bullish reversal after a period of market decline. The pattern effectively captures the shift from bearish to bullish sentiment and is considered a reliable indicator of an impending uptrend.
The star (the second candlestick of the morning star) can be green or red.
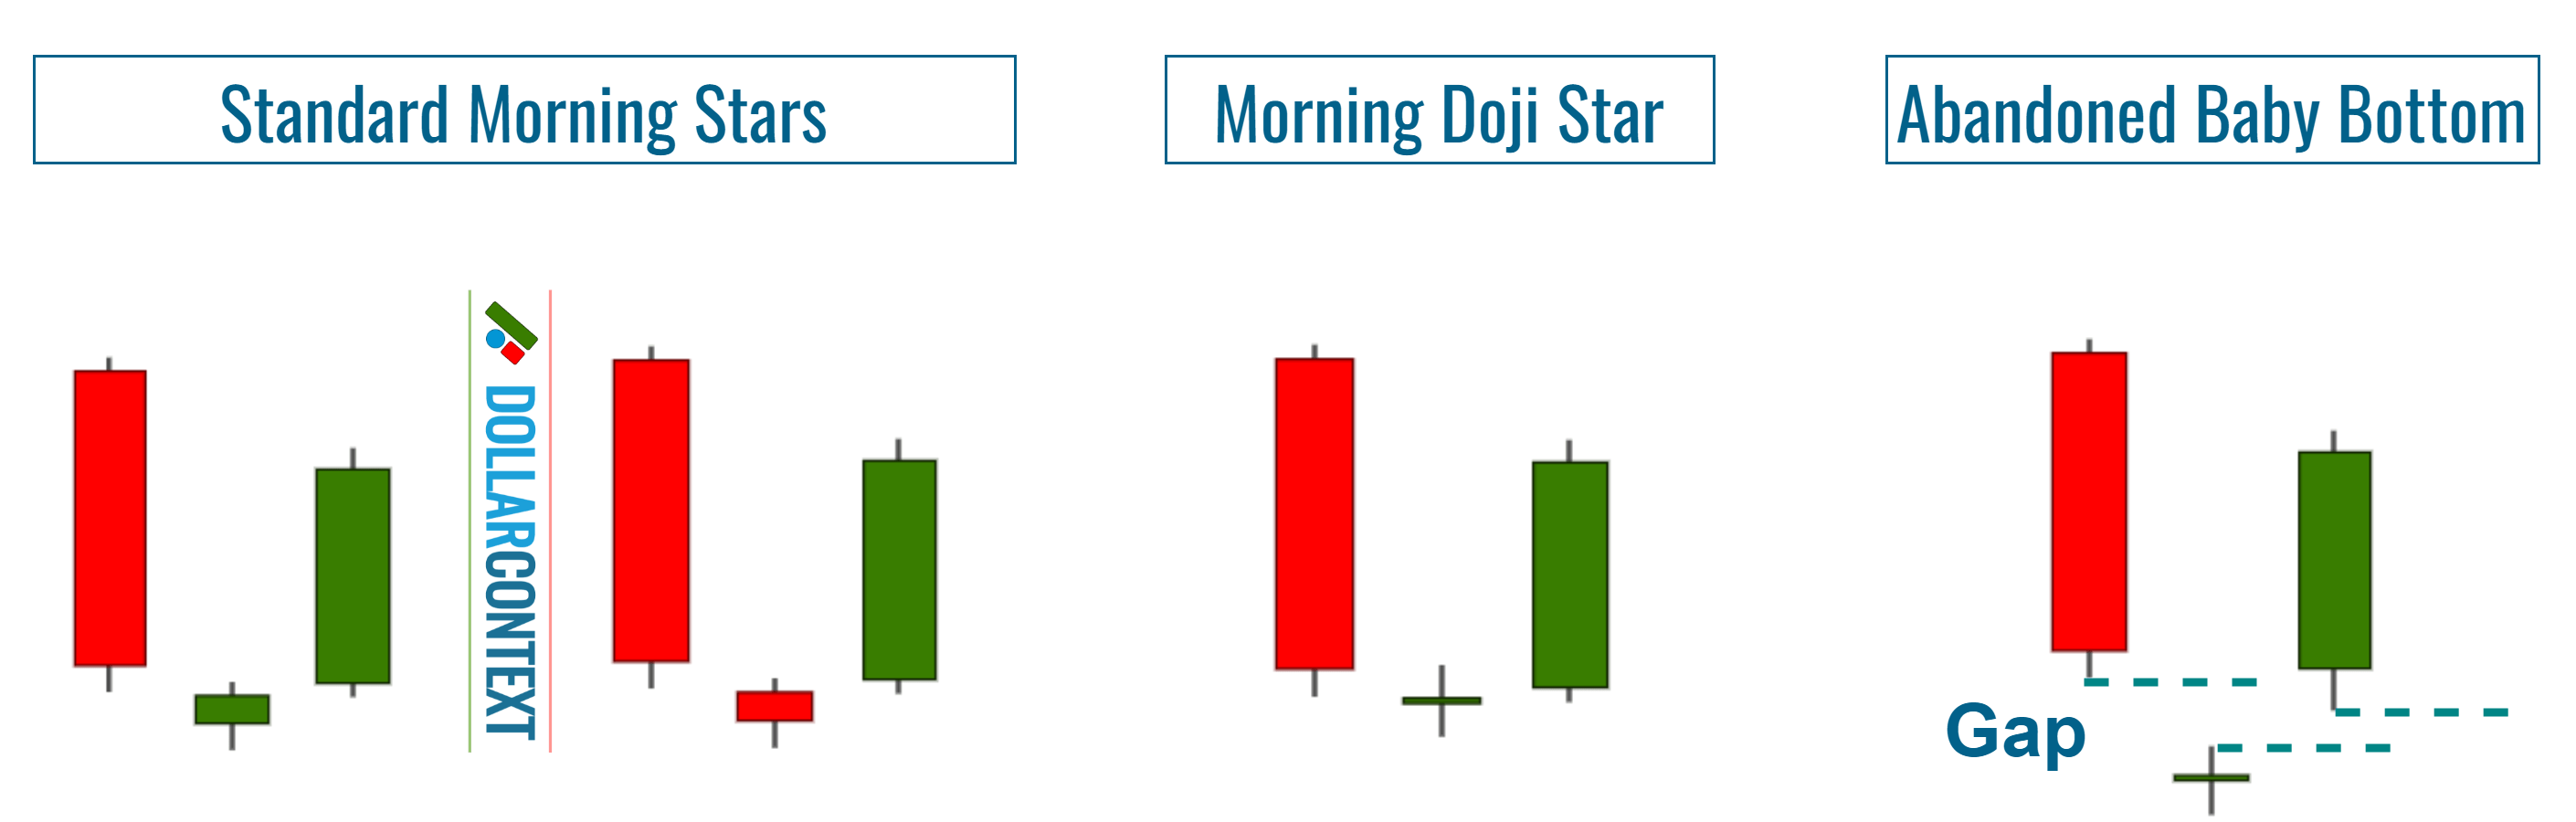
Morning Doji Star and Abandoned Baby Bottom
Morning Doji Star: If the second candle of the morning star is a doji instead of a small real body, then the pattern is expressly referred to as a "morning doji star."
Abandoned Baby Bottom: If a doji with a downward gap (meaning the shadows don't overlap) is followed by an upward-gapping green candlestick whose shadows also don't touch, this formation is recognized as an important bottom reversal signal, commonly known as "abandoned baby bottom."
Factors that Increase the Likelihood of a Reversal
Additional factors that increase the likelihood of a morning star acting as a strong bottom reversal are:
- Sizes of the First and Third Candles: If the morning star pattern starts with a conspicuously long red body and the third candlestick penetrates deep into the body of the first, it suggests that the momentum of the preceding downtrend is diminishing.
- Previous Market Trend: When a morning star appears following an extended or steep market downtrend, it indicates that the market is overstretched and potentially ripe for a reversal.
- Support Zones: If the morning star pattern appears within a key support area, the odds of a bullish reversal increase.
- Forming a Spring: A spring occurs when the price of an asset temporarily breaks below a support level, leading traders to believe a breakout is in progress. However, the price quickly reverses and moves back above the support. When the sessions that include the spring form a morning star, the likelihood of a bullish reversal increases notably.
- Additional Candlestick Patterns: The presence of other bullish patterns in proximity to the price range of the morning star heightens the probability of a market turnaround.


