Morning Star: Similarities and Differences With Other Candlestick Patterns
The configuration of the morning star has resemblances to other candlestick patterns, including the hammer, the tower bottom, and the doji.
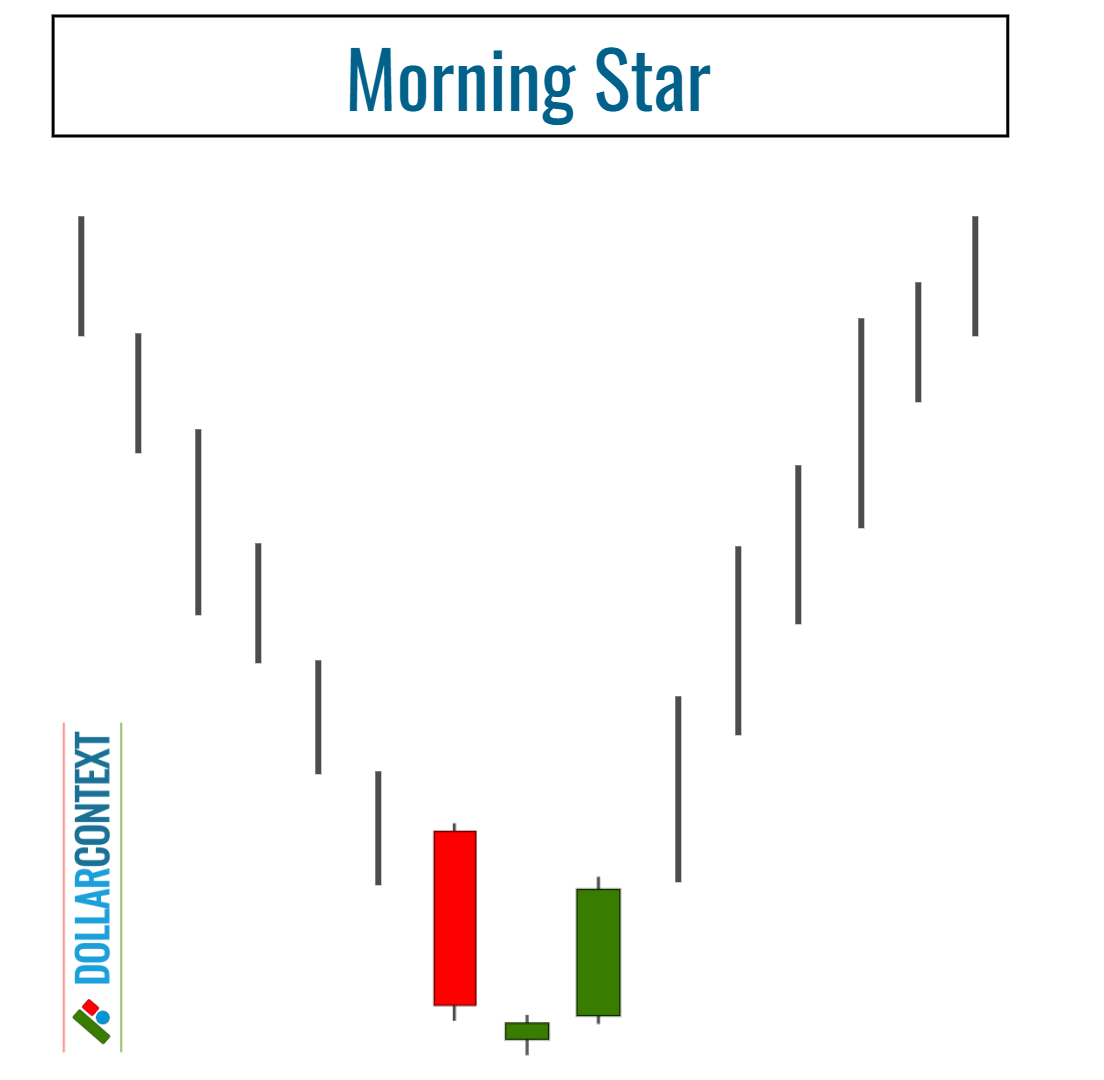
In candlestick charting, the morning star pattern stands out as an important and widely used indicator. This trio of candles starts with a large red candle, signaling strong selling interest, followed by a smaller candle that gaps lower, and finishes with a tall green candle that penetrates deeply into the territory of the first red candle.
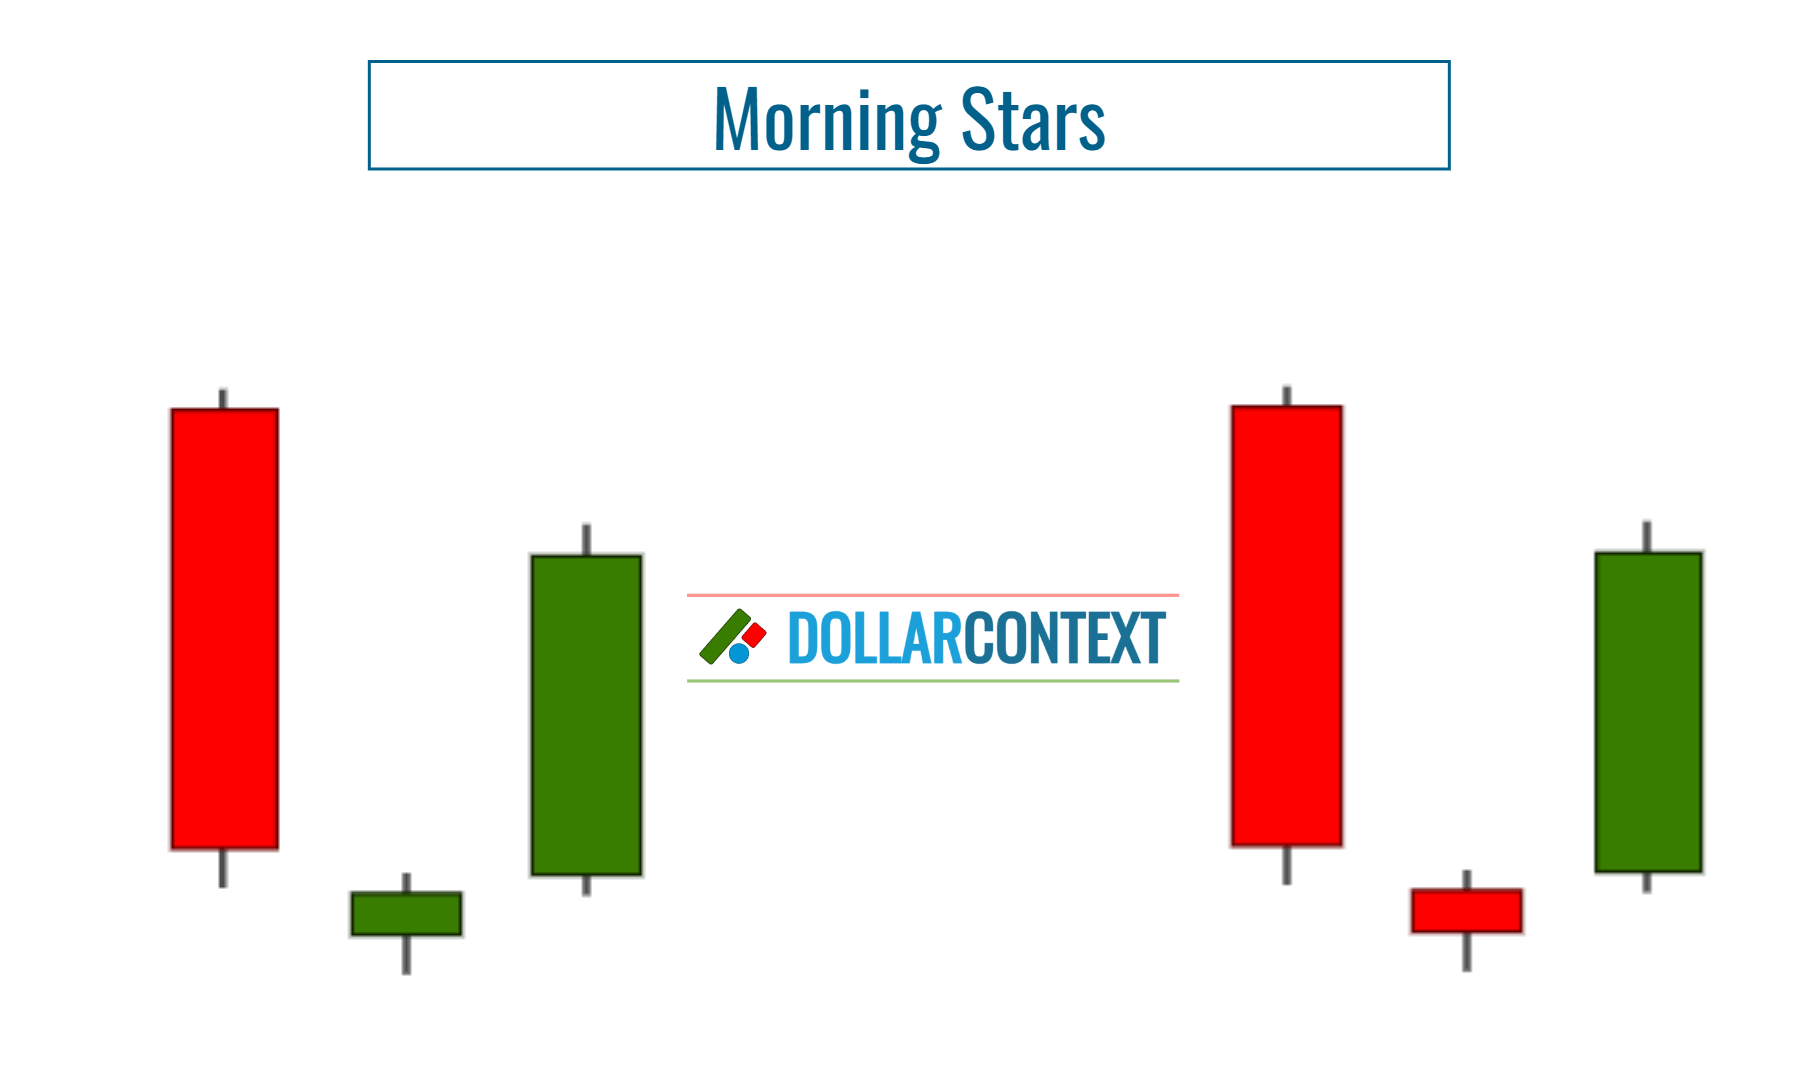
This configuration is often interpreted as a sign that the market's bearish momentum may be waning, setting the stage for a potential bullish reversal.
Differences and Similarities with Other Patterns
The morning star pattern is similar to a group of related candlestick configurations, including:
- Hammer
- Tower Bottom
- Doji
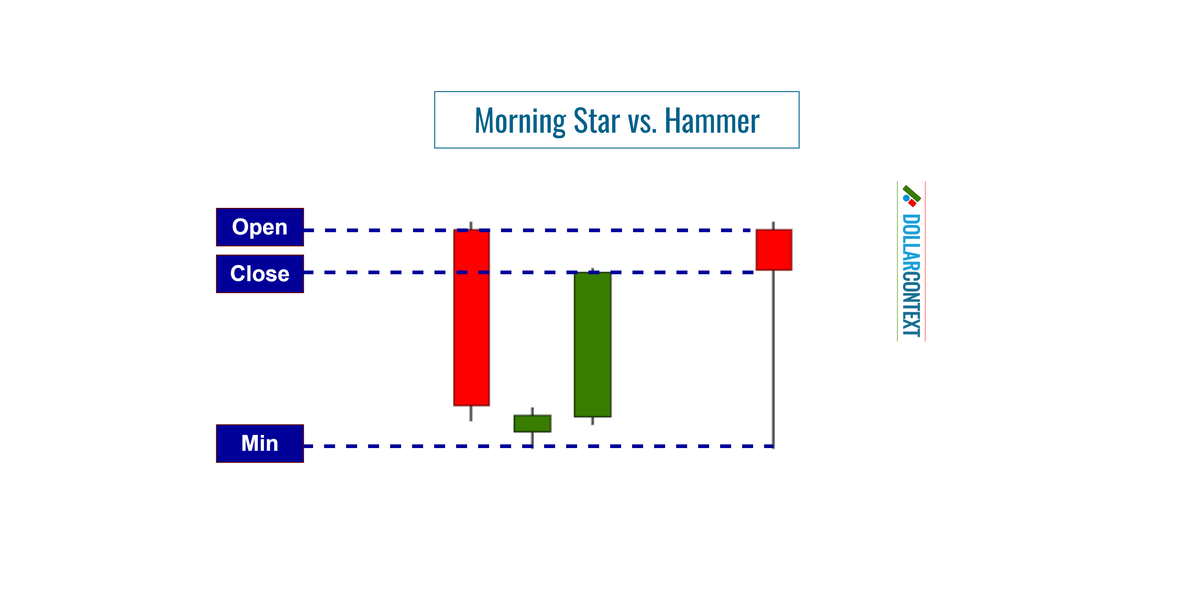
1. Morning Star vs. Hammer
When the three candles of a morning star are observed as a combined shape, ignoring the gaps between them, they can look similar to a hammer pattern. The hammer typically has a small body at the upper end of the trading range and a long lower shadow that indicates a failed attempt to push the price lower.
The visual resemblance stems from the combined length of the candles creating a long "shadow" that would be characteristic of a hammer's long lower wick.
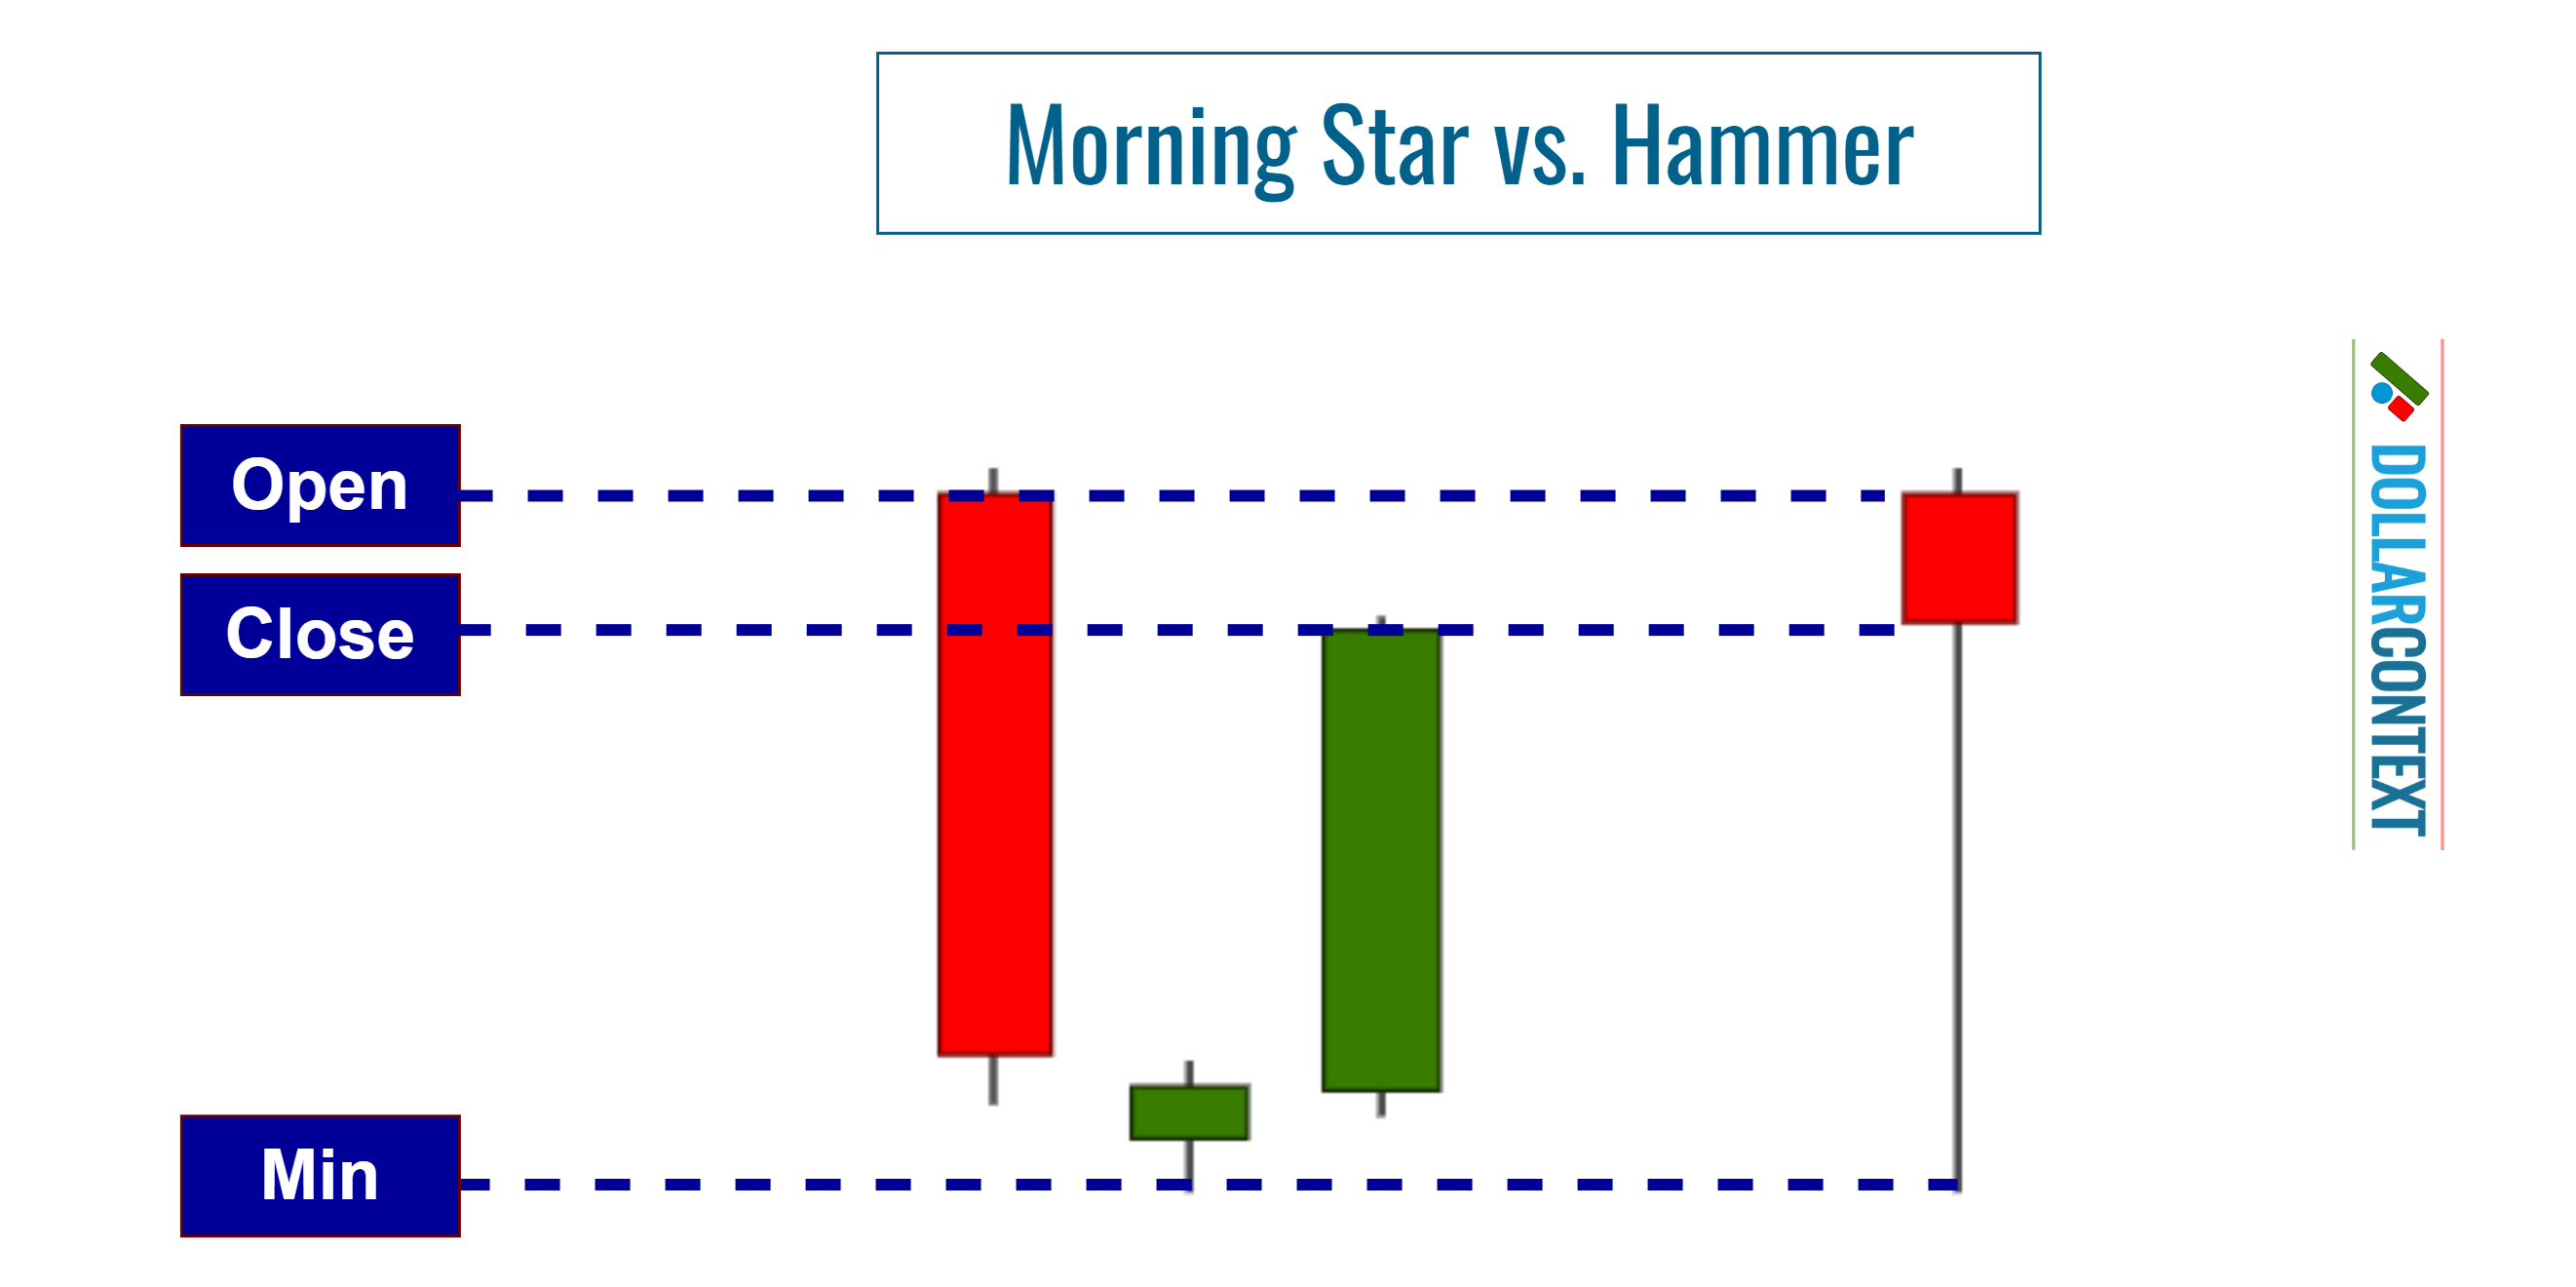
Similarities: Both patterns denote buying pressure at low levels and the inability of the sellers to sustain the low prices.
Differences: Some variations of the morning star pattern cannot be interpreted as, or converted into, a hammer pattern.
2. Morning Star vs. Tower Bottom
A tower bottom is a bullish reversal pattern. It is characterized by a sharp decline in price, reflected by one or more large red candlesticks, followed by a consolidation period with smaller candles. This is then followed by a sharp rise, mirrored by one or more large green candlesticks.
The pattern is named for its resemblance to two towering structures, with the first and last candles of the formation standing tall like the towers of a fortress.
The tower bottom pattern can be viewed as a variant of the morning star. Both patterns exhibit a similar structure consisting of an initial strong bearish move, followed by indecision, and culminating in a decisive bullish turn.
Note that the lull period of a tower bottom can be viewed as the second session of a morning star.
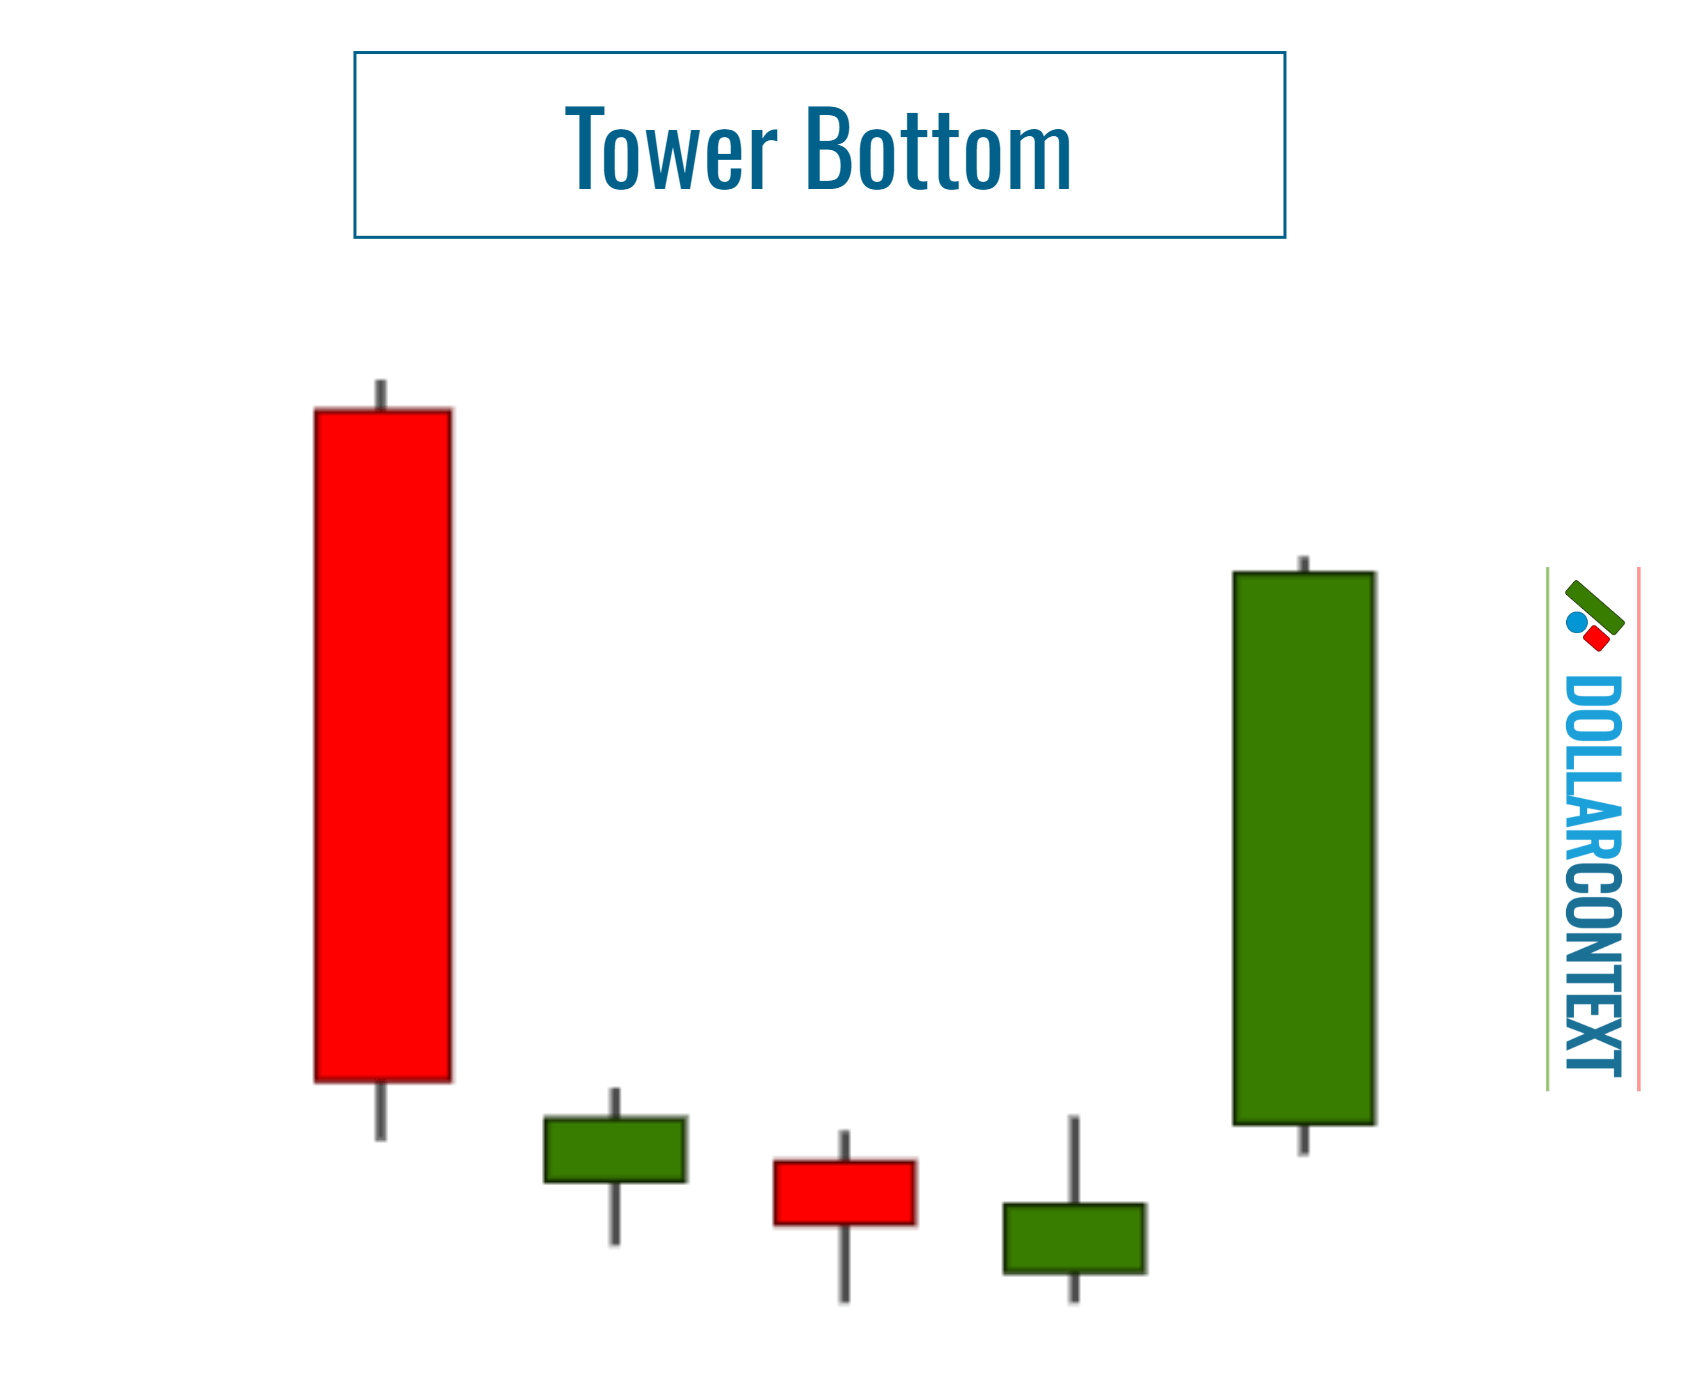
Similarities: Both configurations indicate initial selling momentum and a phase of uncertainty that concludes with a bullish reversal.
Differences: The period of uncertainty within the tower bottom pattern extends over a longer duration compared to that in the morning star formation.
3. Morning Star vs. Doji
A doji, in technical analysis, is a candlestick pattern suggesting market indecision. It is characterized by a candle with virtually the same opening and closing price, resulting in a tiny or nonexistent body. The lengths of its upper and lower shadows can vary. This pattern indicates a balance between buying and selling pressure.
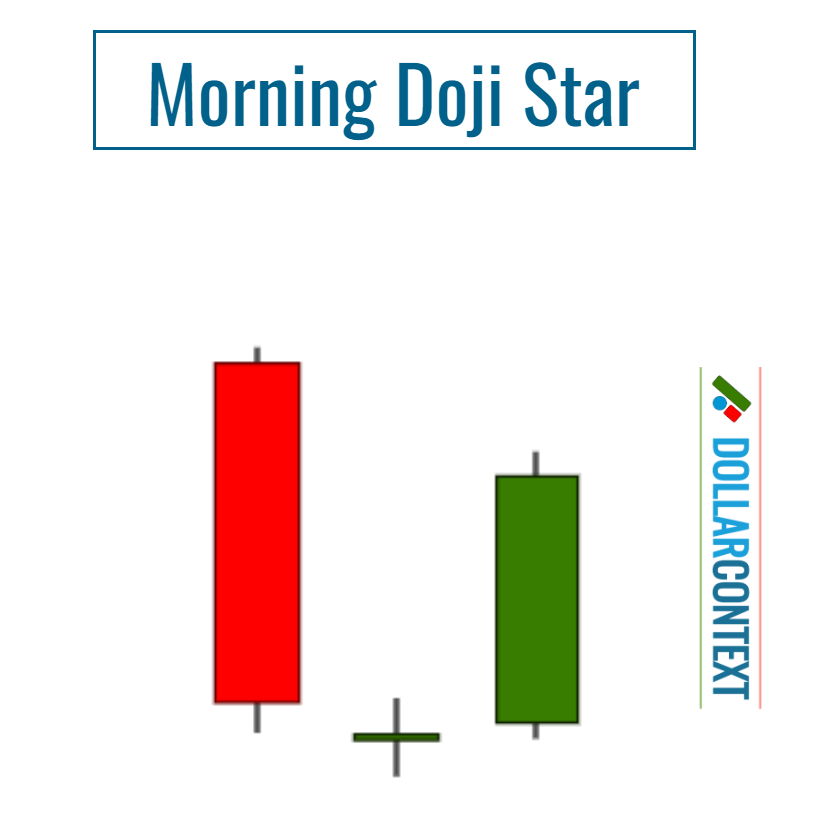
A doji or a near-doji candle can also be part of the morning star pattern when it serves as the second candle in the three-candle formation. This makes the reversal signal of the morning star even stronger, as the doji enhances the indecision or struggle between buyers and sellers. This formation is called morning doji star.
If a doji appears after a downward price gap (where its shadows do not overlap the previous candle) and is succeeded by a green candlestick that gaps upward (its shadows also not overlapping), it represents a potent bottom reversal signal. This particular formation is known as "abandoned baby bottom," which is a notably rare occurrence in the market.
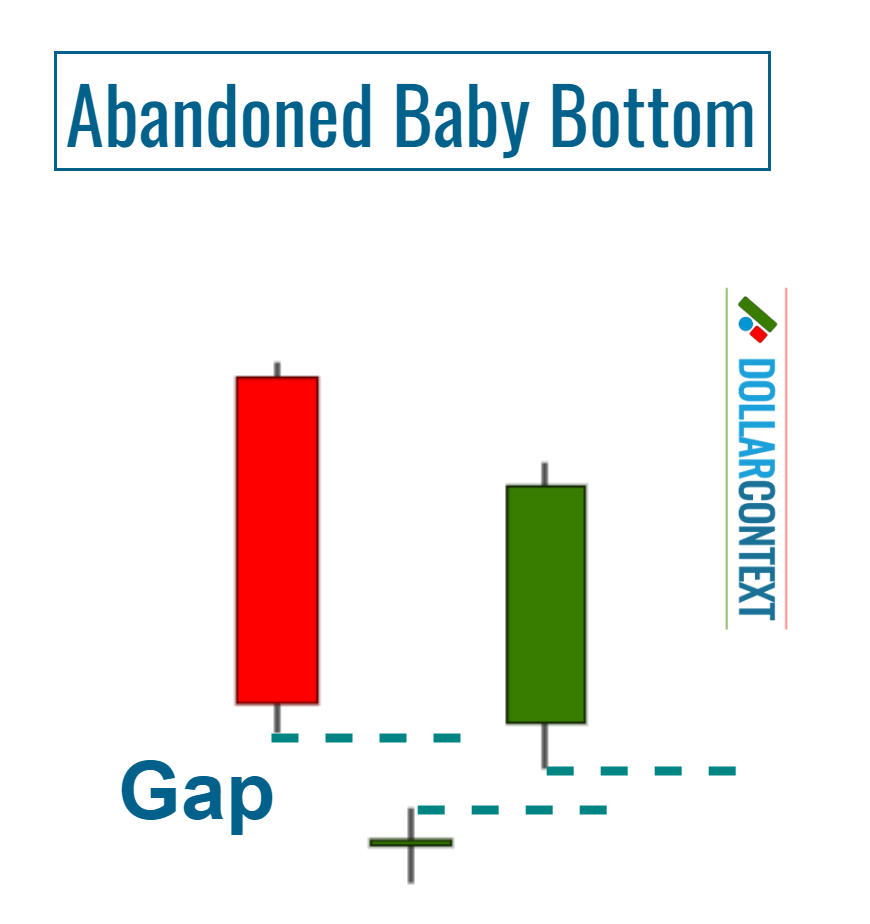
Both the morning doji star and the abandoned baby bottom are subtypes of the morning star pattern.
A doji session is particularly relevant when emerging after a tall red candle, like in the case of the morning doji star.
Similarities: Both the doji and the small candle in the morning star pattern suggest market indecision. The small candle of the morning star, particularly if it's a doji, reflects a slowdown in the previous trend's momentum.
Differences: The main difference is that a doji is considered a single candlestick pattern that can be ambiguous on its own, requiring further validation from subsequent candles. In contrast, the morning star is a multi-candlestick pattern that provides a more complete narrative of potential shifting market sentiment. We'll add here that while the classic morning star pattern includes a small-bodied candle, which can be a doji, indicating indecision, not all variations of the pattern will feature a candle of this type.


