
Using the Morning Star Pattern to Identify Key Support Levels
After a downtrend, the price range associated with a morning star pattern becomes support.

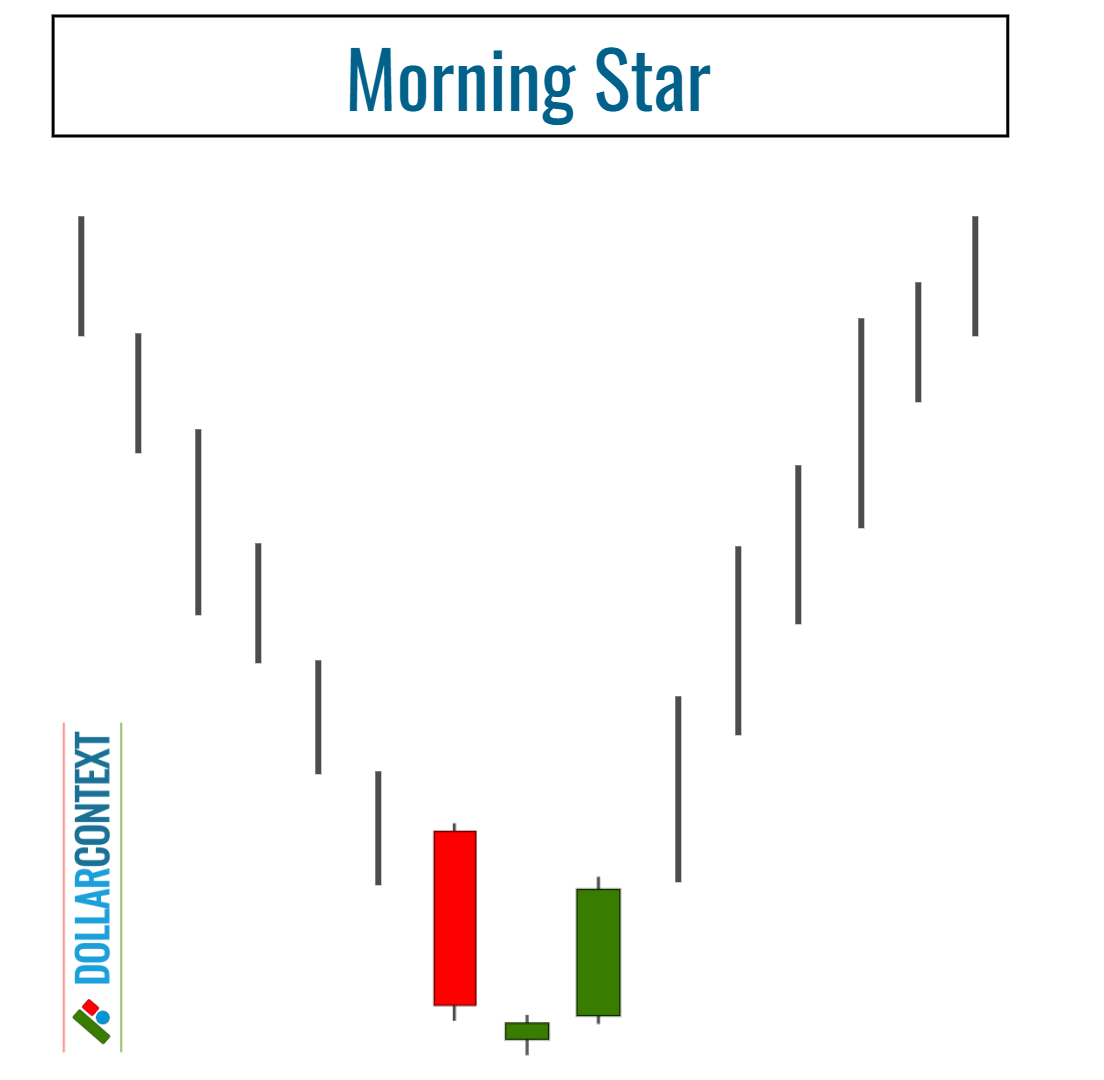
Serving as an indicator of a bullish reversal, the morning star manifests at the end of a downtrend. This pattern is formed by three key candlesticks:
- A substantial bearish (red) candle, which shows robust selling activity.
- A candle with a small body (either bullish or bearish), denoting market uncertainty and hinting at a potential loss of downward momentum. Ideally, this candle should not overlap with the real body of the initial bearish (red) candle.
- A lengthy bullish (green) candle, which materializes the reversal by displaying strong buying interest. The third candle typically closes well within the territory of the initial red candle that forms part of the pattern.
Within this framework, we can identify two distinct scenarios:
- When a morning star emerges within an already defined support zone, it serves to strengthen or validate the existing support.
- If a morning star appears at a fresh low, it establishes a new support zone.
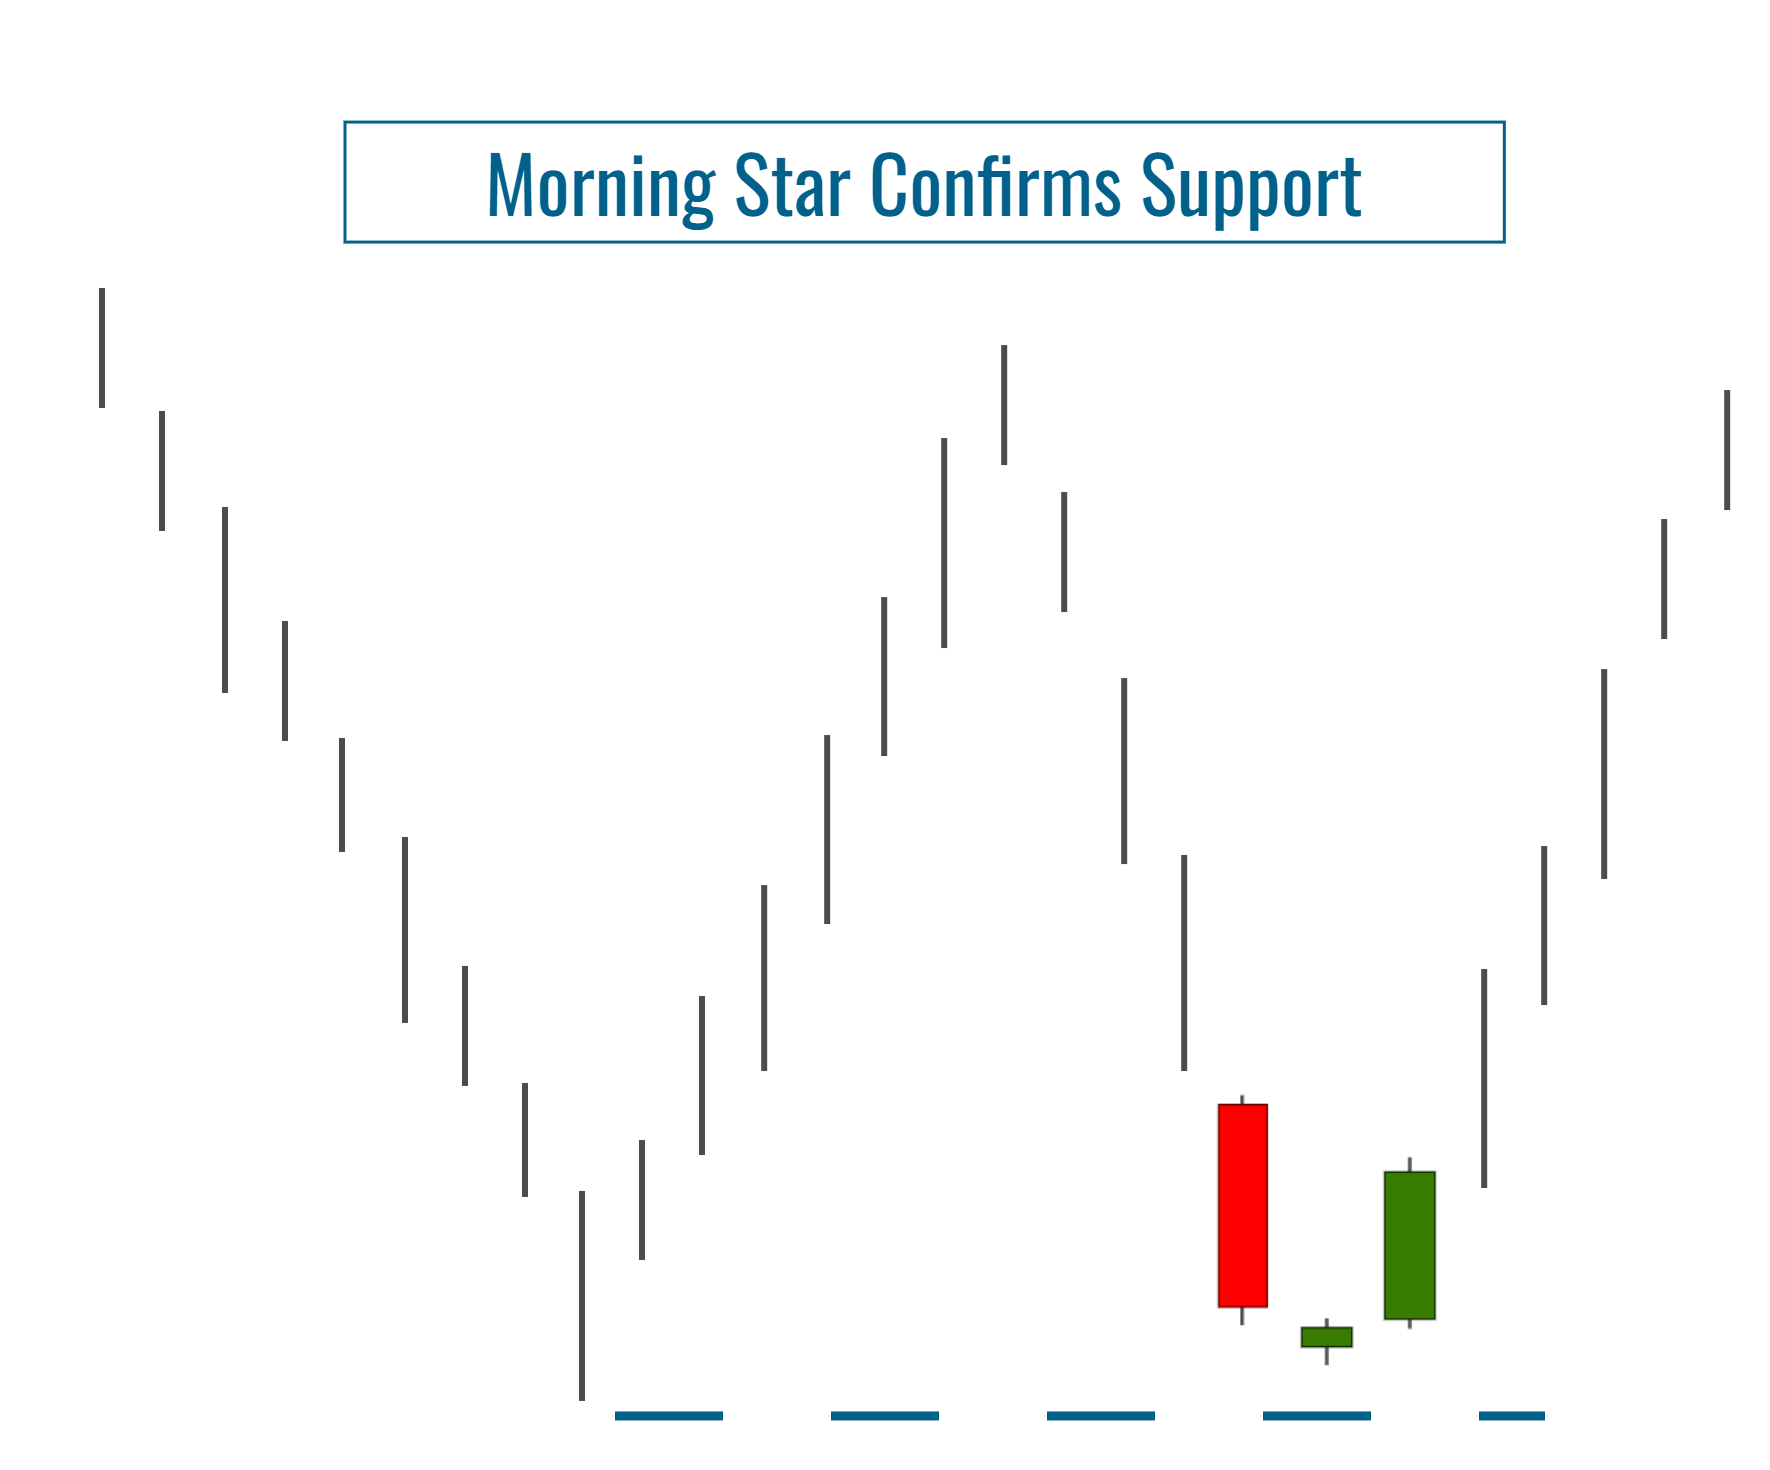
1. Morning Star Confirms Support
When a morning star appears within a previously defined support area, it reinforces the credibility of that support, increasing the probability of a bullish trend reversal.
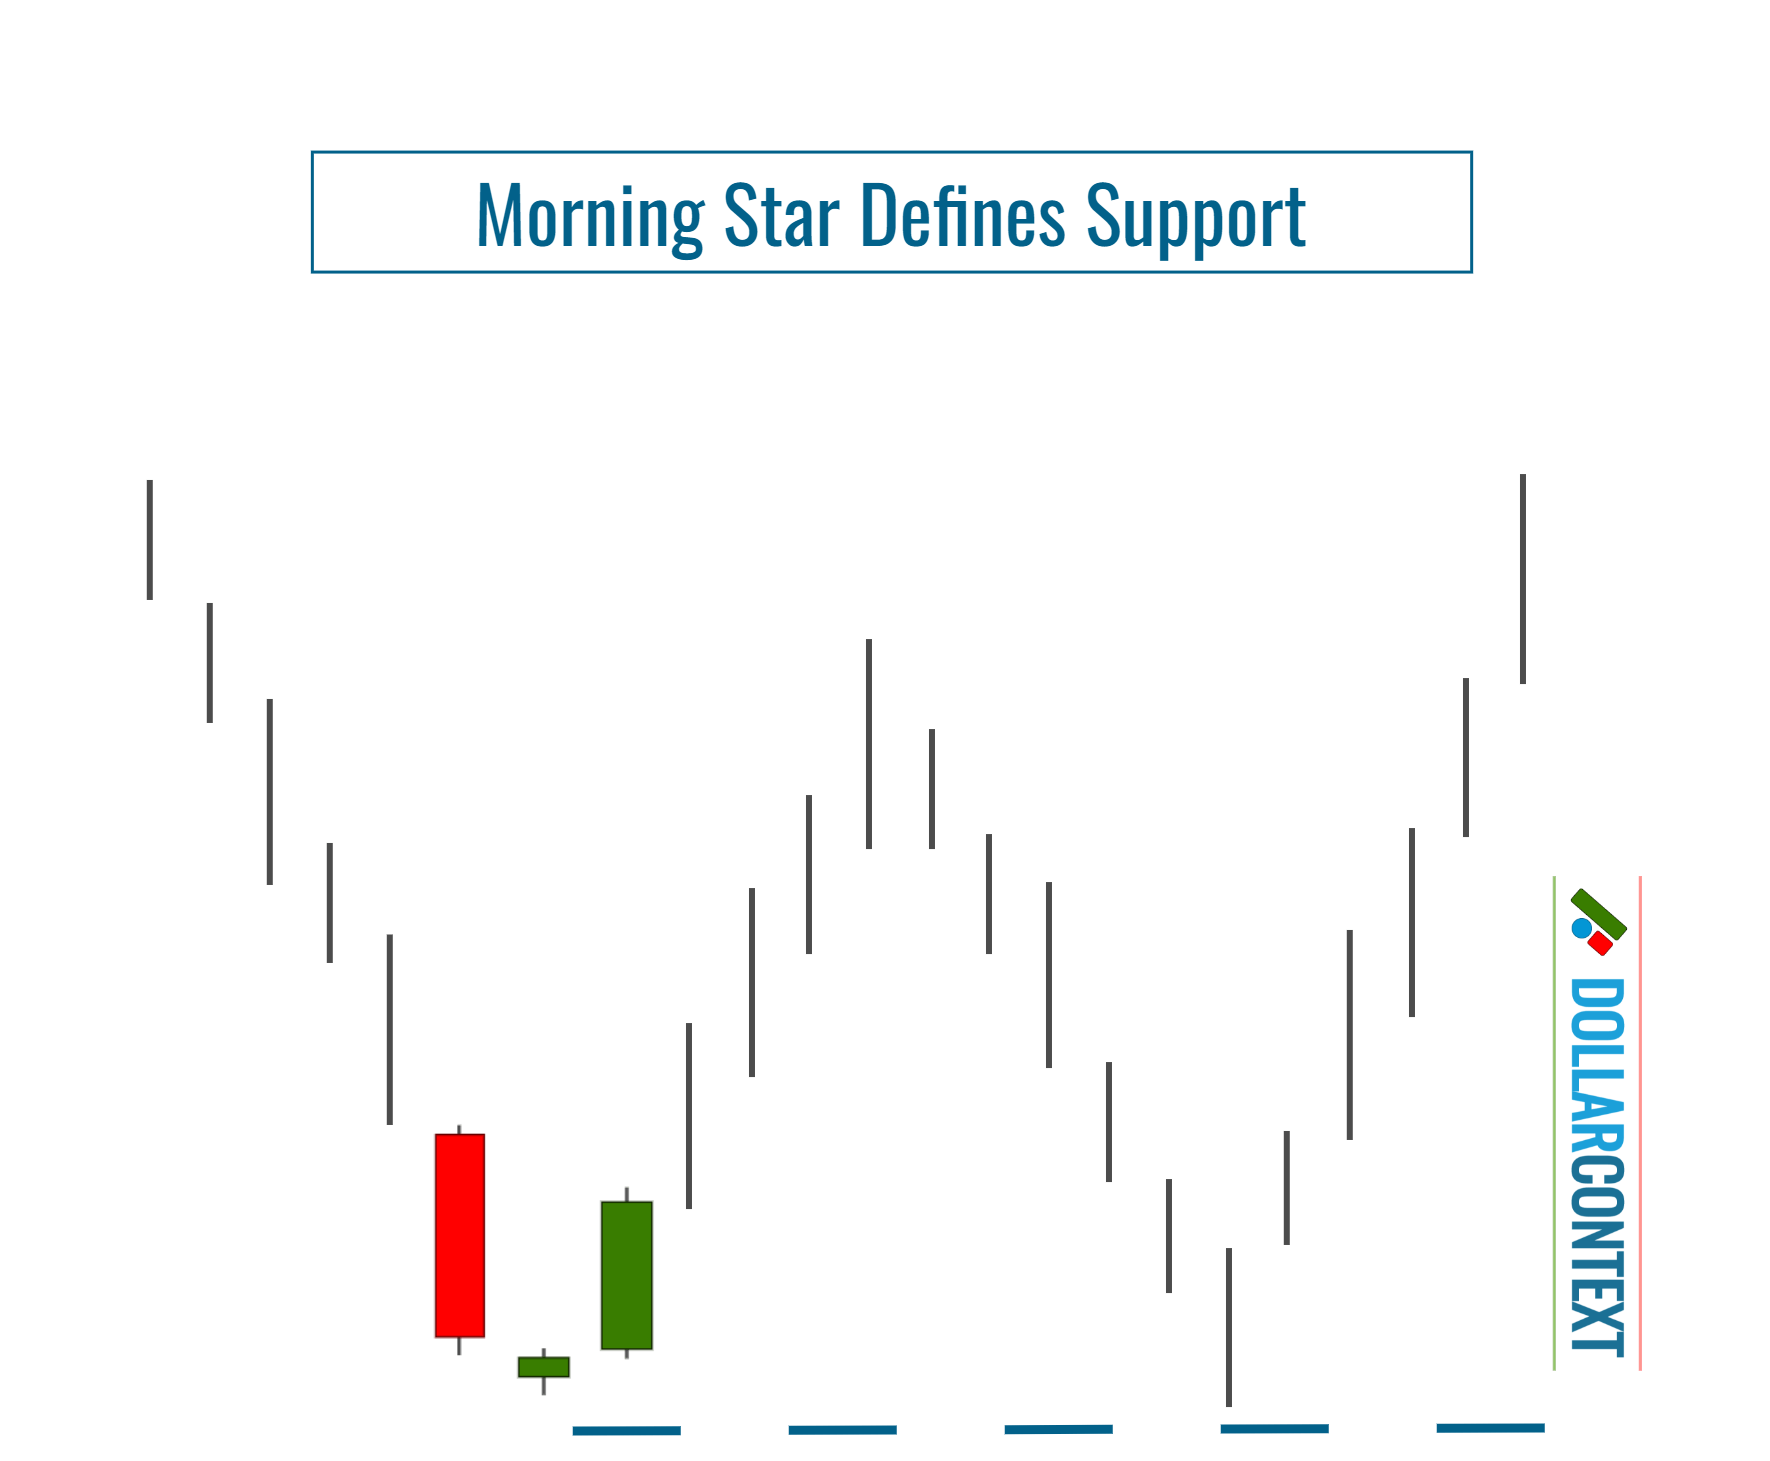
2. Morning Star Defines New Support
If a morning star creates a new low, it sets up a fresh support zone that may be tested in the future.
3. Breakout of the Support Area
When entering a trade guided by the morning star, it's crucial to determine a particular price level at which you'll reevaluate your initial strategy. This identified price can act as the initial stop-loss for your morning star-based approach.
If a trading session clearly exceeds the support level set by the morning star, the market is likely to continue its prior downtrend. However, as elaborated in the following section, exceptions do exist.
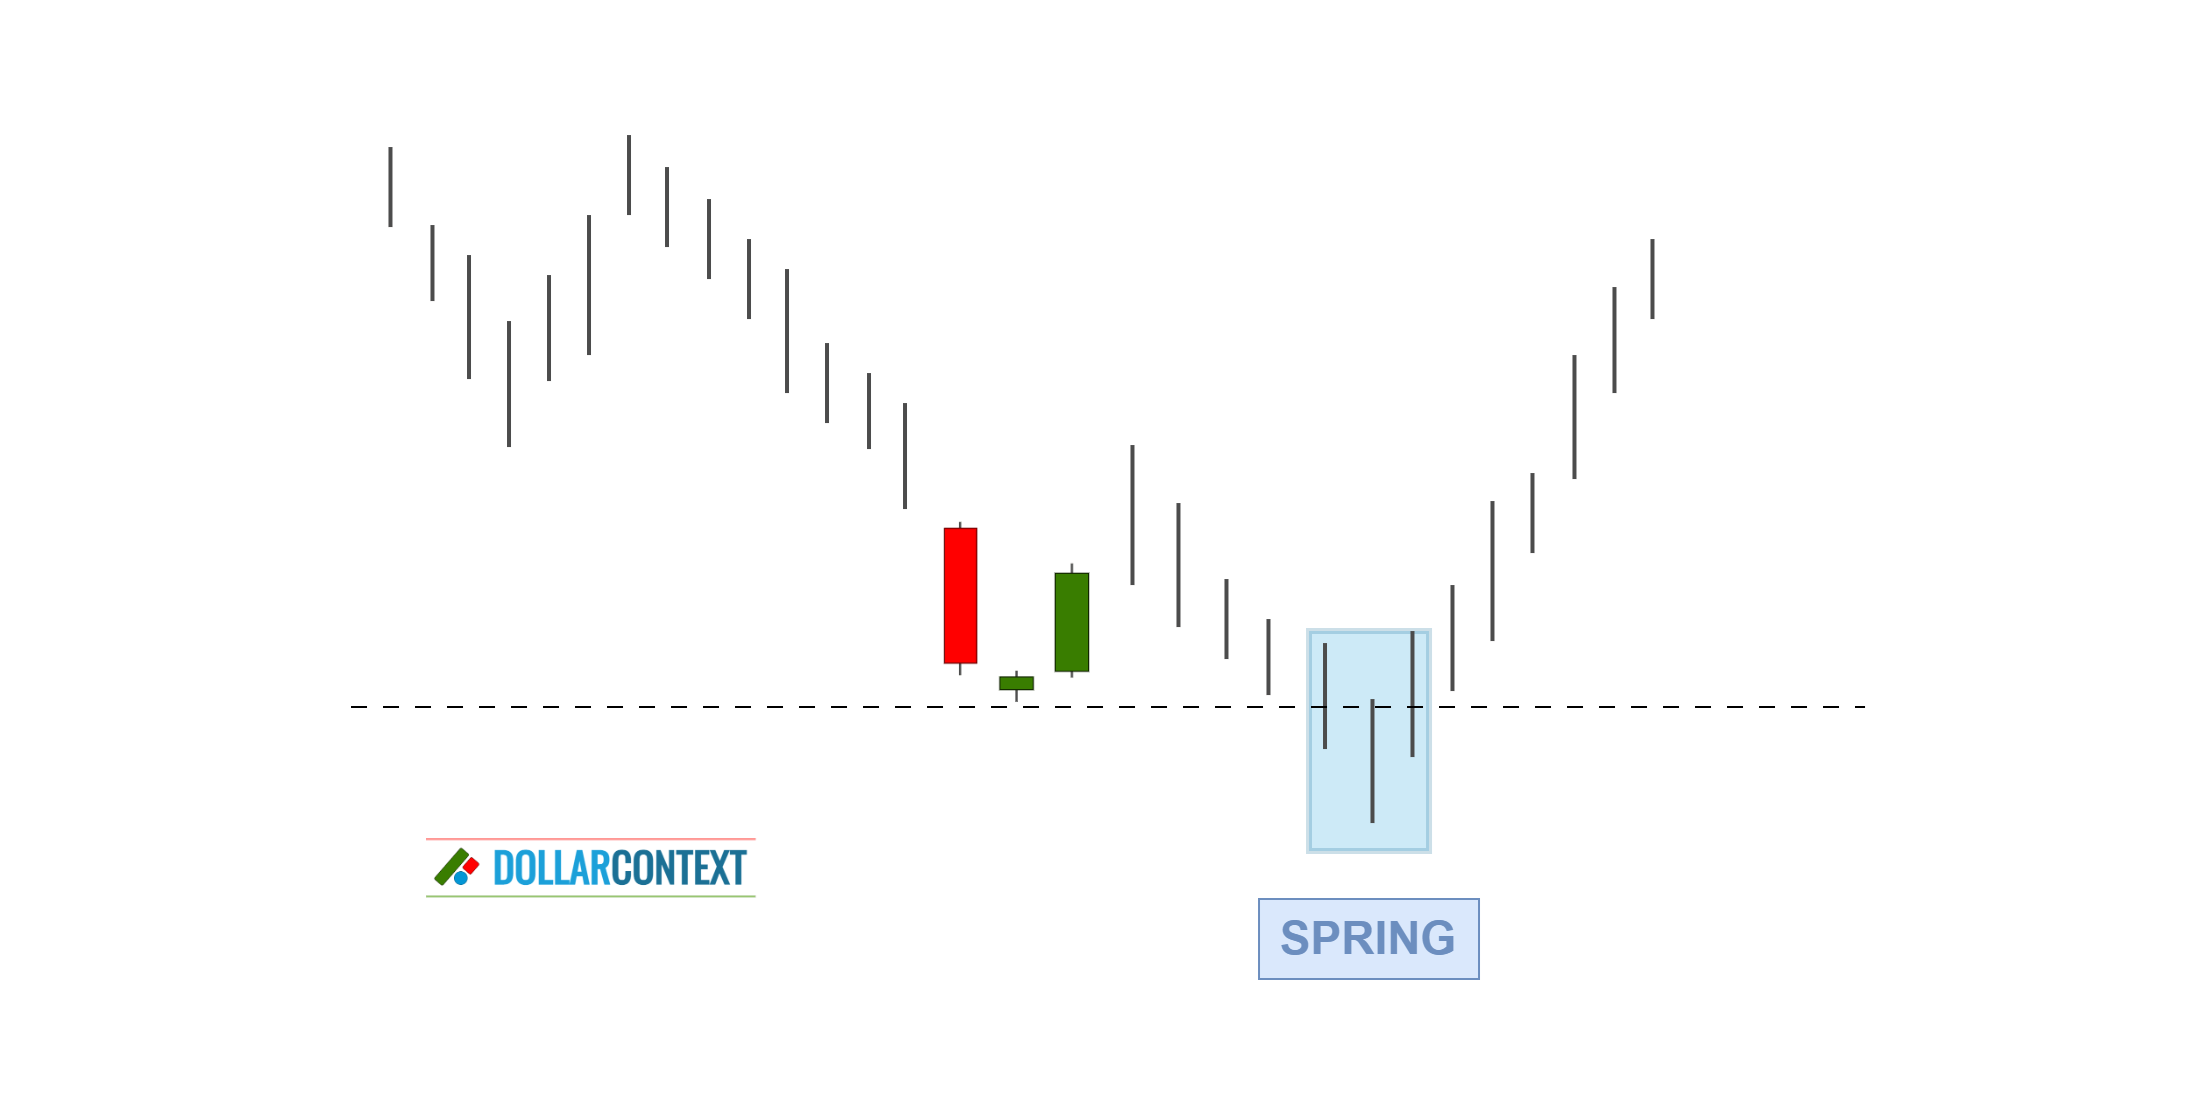
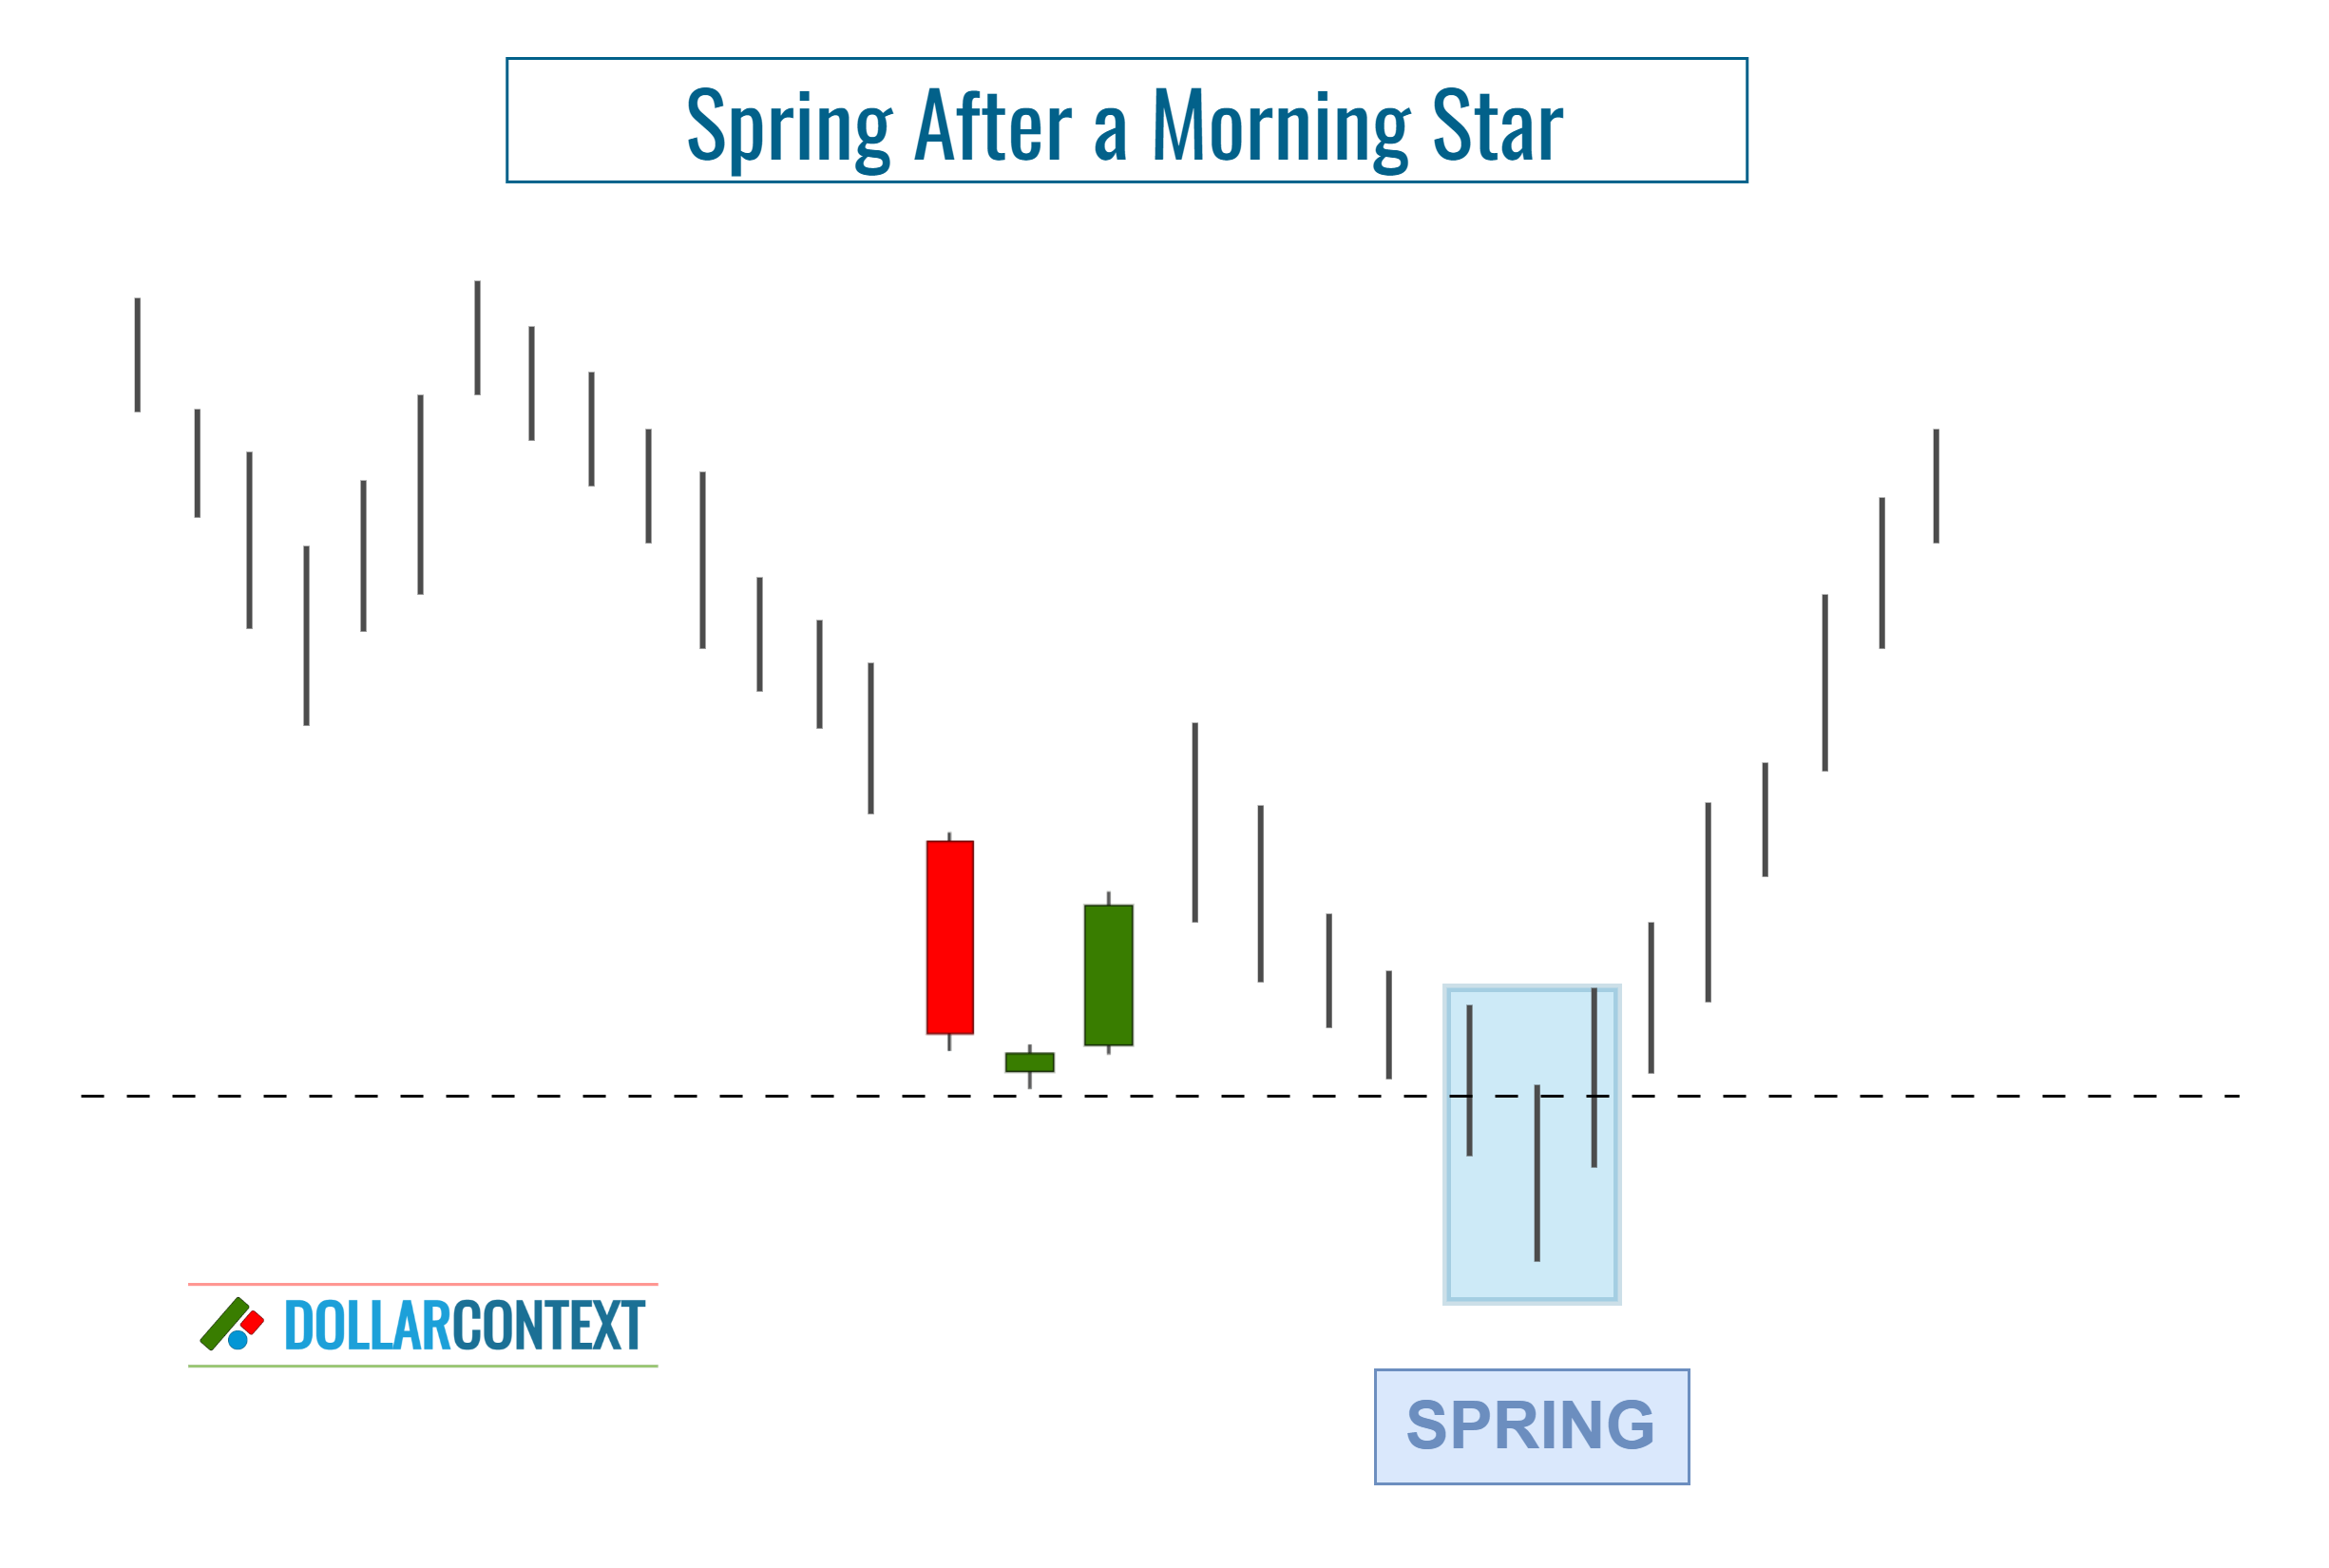
4. False Breakouts
When a support level is broken, many traders view it as an indicator that the price may further move in the direction of the breakout. However, markets sometimes act against those expectations. Rather than maintaining the existing downtrend, they might reverse course and return to their previous range. This occurrence is often referred to as a "false breakout" or a "spring".
To reduce the likelihood of a false breakout, take into account these recommendations:
- Set your stop-loss based on the session's closing price, instead of reacting to intraday price movements.
- Think about adding a buffer zone to your preset stop-loss level.
- When subsequent bullish candlestick patterns further validate the support level set by a morning star, the chances of an authentic breakout greatly decrease.


