
Morning Star Variations: Concept and Interpretation
Variations of the morning star pattern that may not perfectly align with the ideal form can still be valid, given certain market conditions.

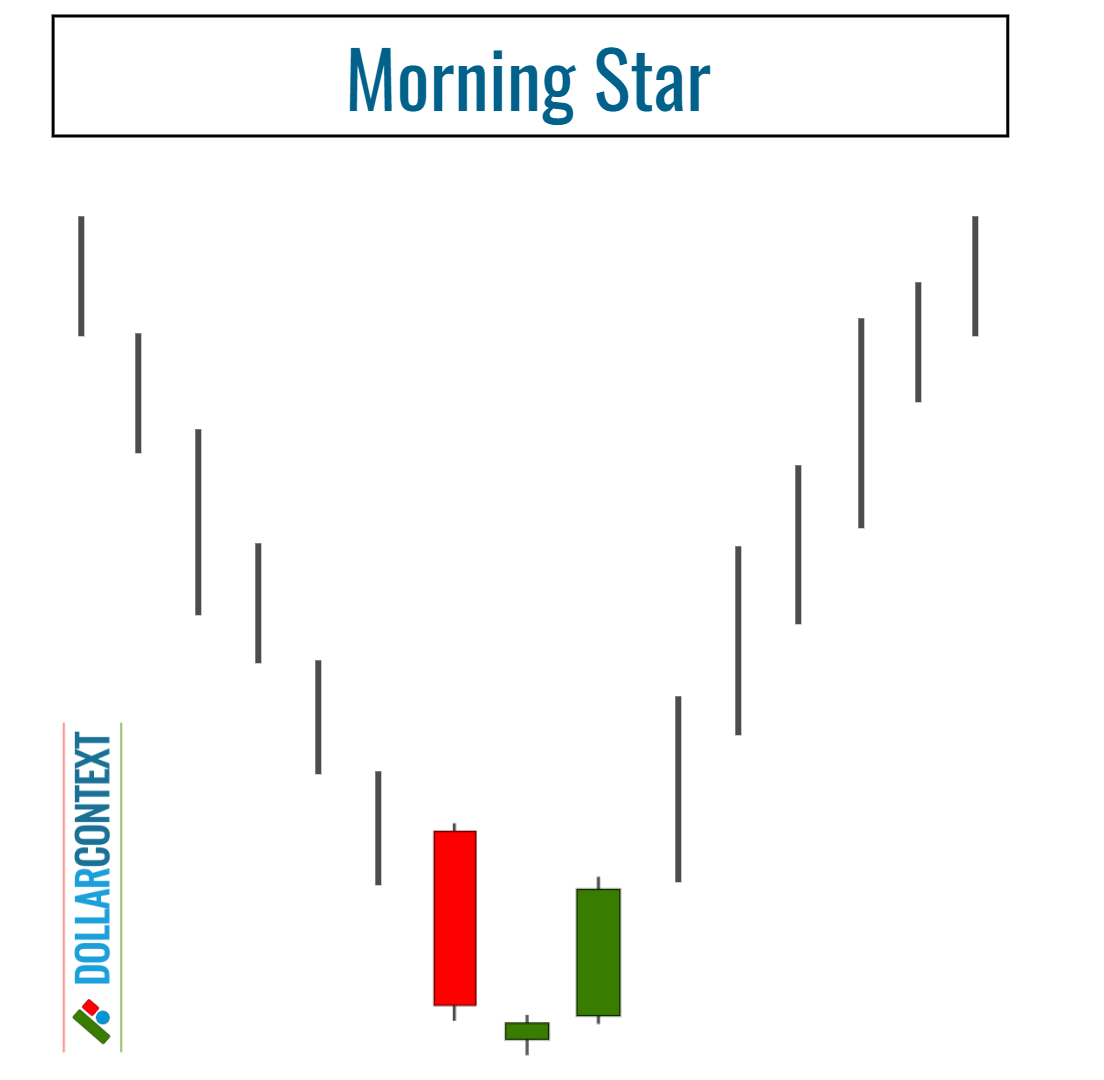
In Japanese candlestick charting, the ideal or textbook version of a morning star pattern is represented by three candlesticks with the following characteristics:
- The first candle has a long red body and a small or non-existent lower wick, indicating strong selling pressure.
- The second candle has a small body that gaps below the closing price of the first candle, indicating a continuation of the downtrend but with decreasing momentum. The real body of the second candle can be bullish (green) or bearish (red).
- The third candle is a bullish one, with a large body and little to no upper shadow. Ideally, this candle should open above the close of the second candlestick and close well into the body of the first, confirming a potential bullish reversal.
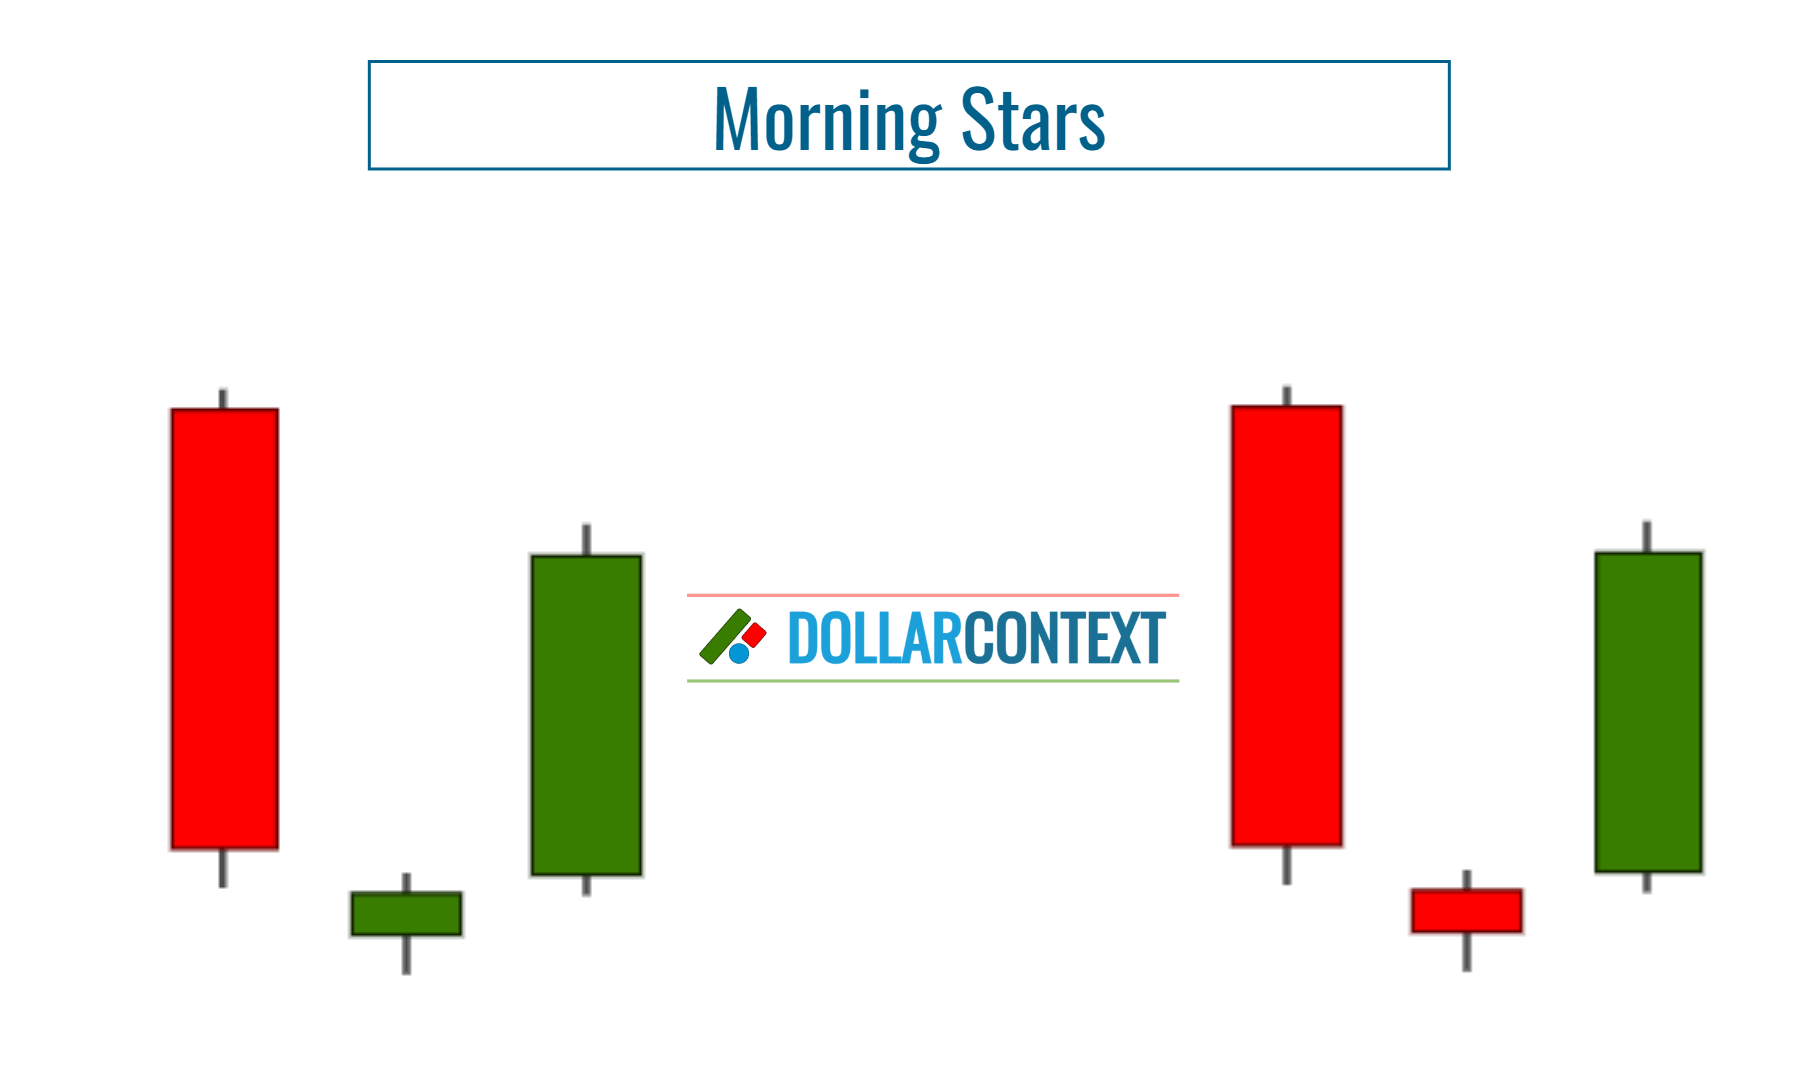
Since the morning star pattern is considered a bullish reversal pattern, it should arise after a downtrend. Traders often use this technique as a buy signal or as an opportunity to close short positions.
What Is a Morning Star Variation?
The criteria outlined before depict the classic version of the morning star pattern. However, in real-world trading, variations that may not perfectly align with the standard form can still be valid, given certain market conditions.
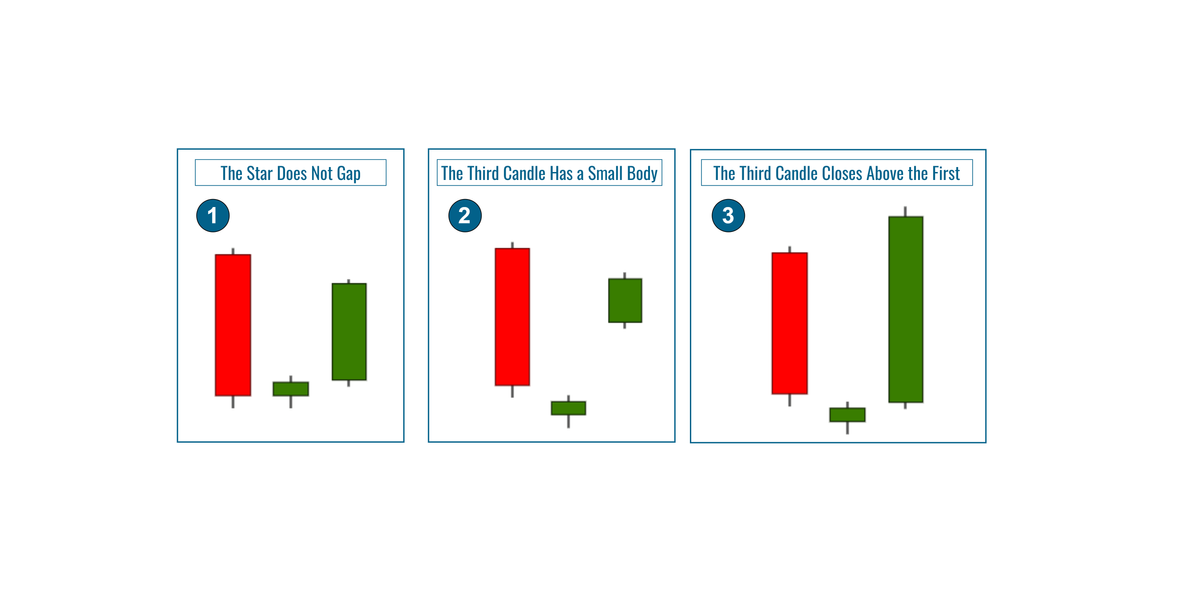
These are the most common variations of the morning star pattern:
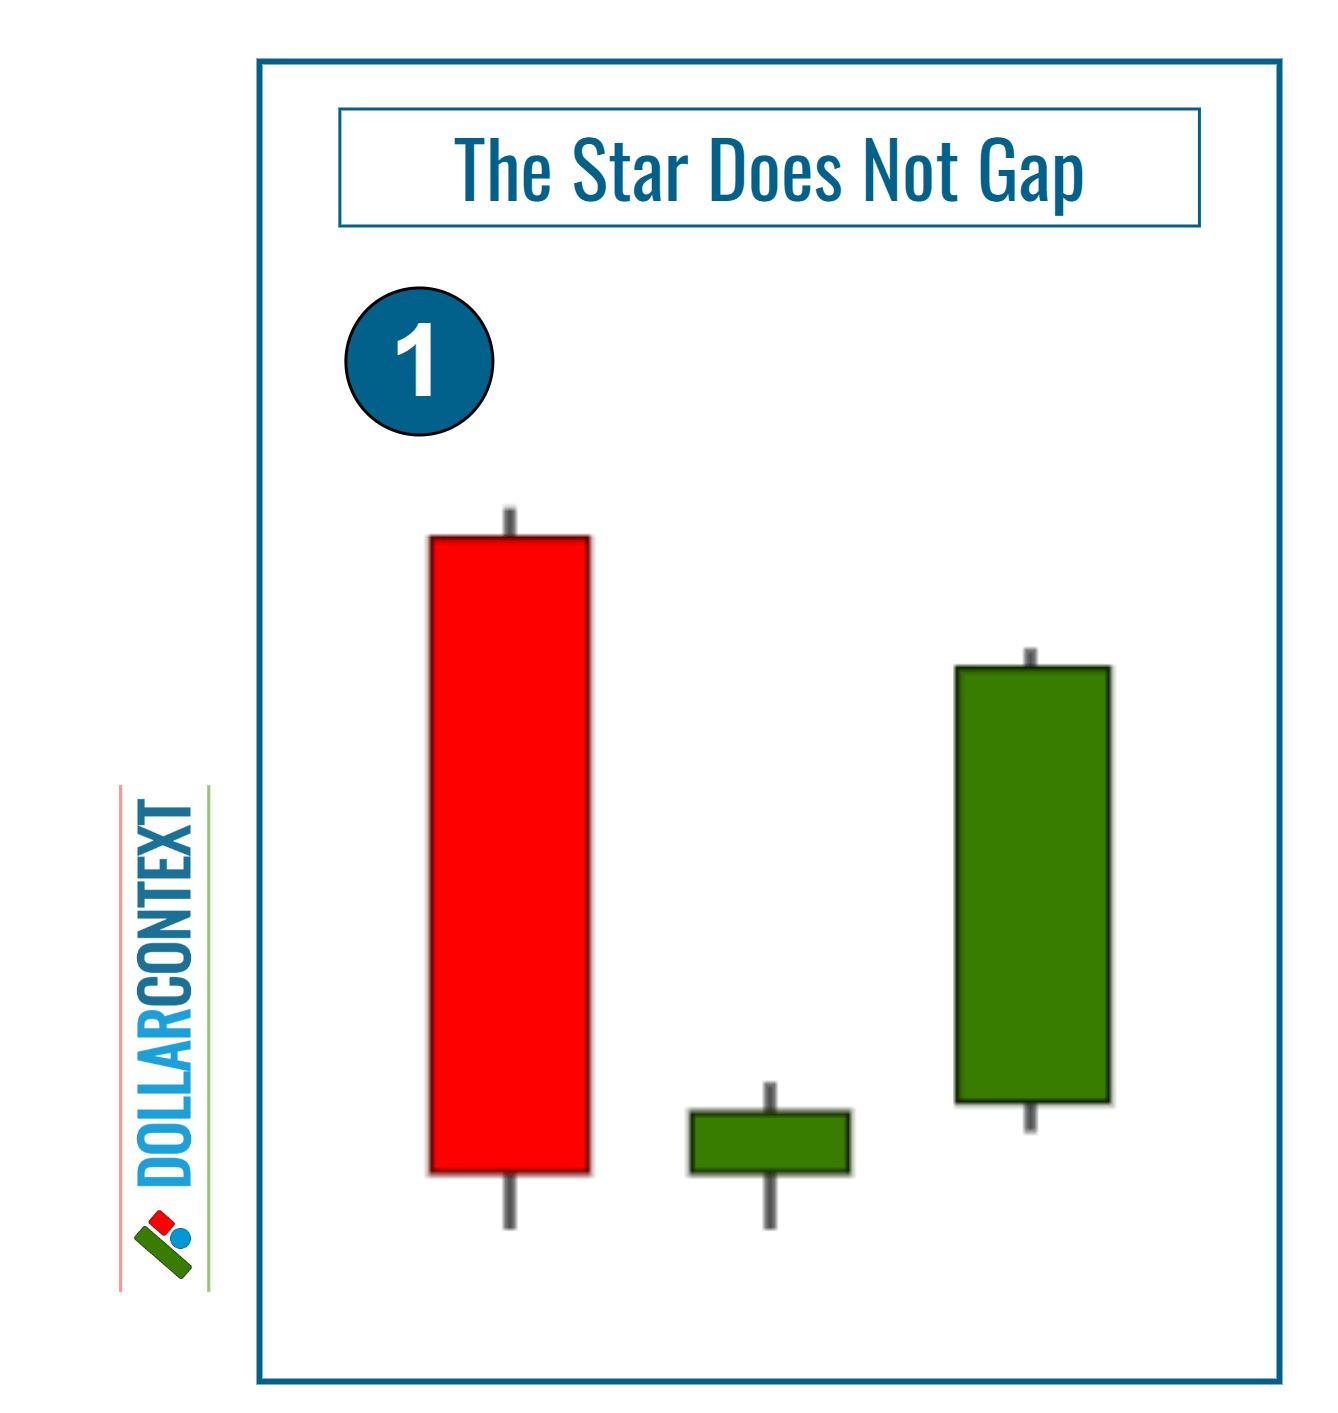
- The Second Candle (Star) Does Not Gap
- The Third Candle Has a Small Green/White Body
- The Third Candle Closes Above the First
1. The Second Candle (Star) Does Not Gap
These include instances where the second body, typically referred to as the star, does not gap below the closing price of the first session. This scenario is pretty common in low volatile markets or when using lower charting timeframes, such as hours or minutes.
2. The Third Candle Has a Small Green/White Body
The morning star illustrated below is different from the more classic morning star in that the third body of the formation has a small green body rather than a long green one. However, under certain conditions, this variation can carry all the bullish implications of the more traditional morning star. This is because the third candle of this version, although not a tall green candle, it reflects the strength of the bulls by the fact that they were able to push the prices deep into the first real body of the pattern.

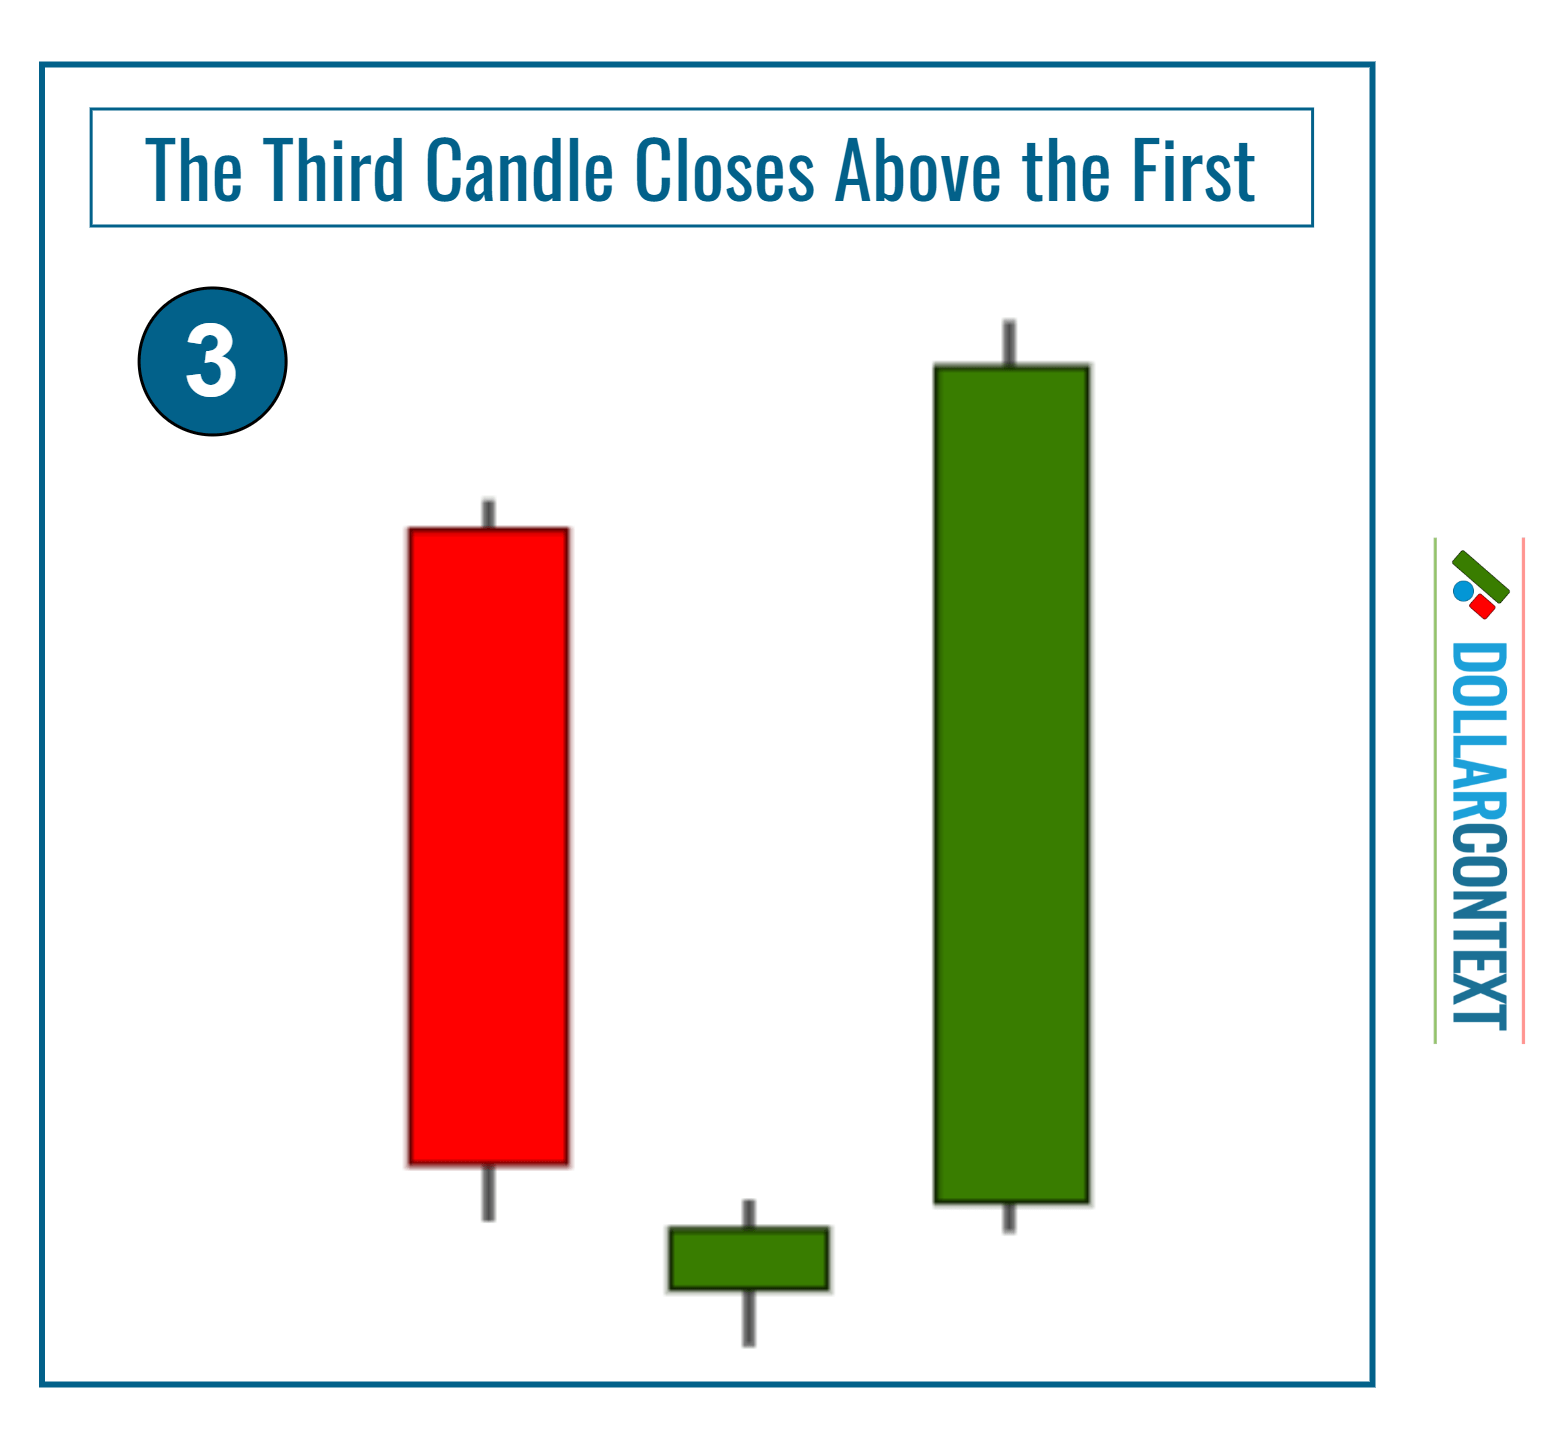
3. The Third Candle Closes Above the First
A third variation of the morning star occurs when the third candlestick closes above the opening of the first candlestick. In this configuration, the length of the third green (or white) candle reflects the strength of the buyers.
Should You Trade From a Morning Star Variation?
How do you determine if you should trade from a less-than-ideal morning star pattern? We offer the following guidelines for your consideration:
- Wait for More Confirmation: Specifically, observe the market behavior in the session following the morning star variation to determine if it continues to show strength.
- Prior Market Trend: The more oversold the market and the more advanced the preceding downtrend, the greater the likelihood that the variation of the morning star will serve as a bottom reversal.
- Major Support Zones: Variations that occur within key support areas are more likely to be followed by a market turn.
- Additional Reversal Patterns: The emergence of additional bullish patterns near the price range of the morning star variation further signals a potential reversal.


