Piercing Pattern Strategy: A Comprehensive Tutorial
Today we're exploring an important indicator of Japanese candlestick charting: the piercing pattern.
We'll explore an important indicator of Japanese candlestick charting: the piercing pattern.
Before we delve into the intricacies of this formation, let's underscore three fundamental characteristics of most candlestick patterns, including the piercing pattern:
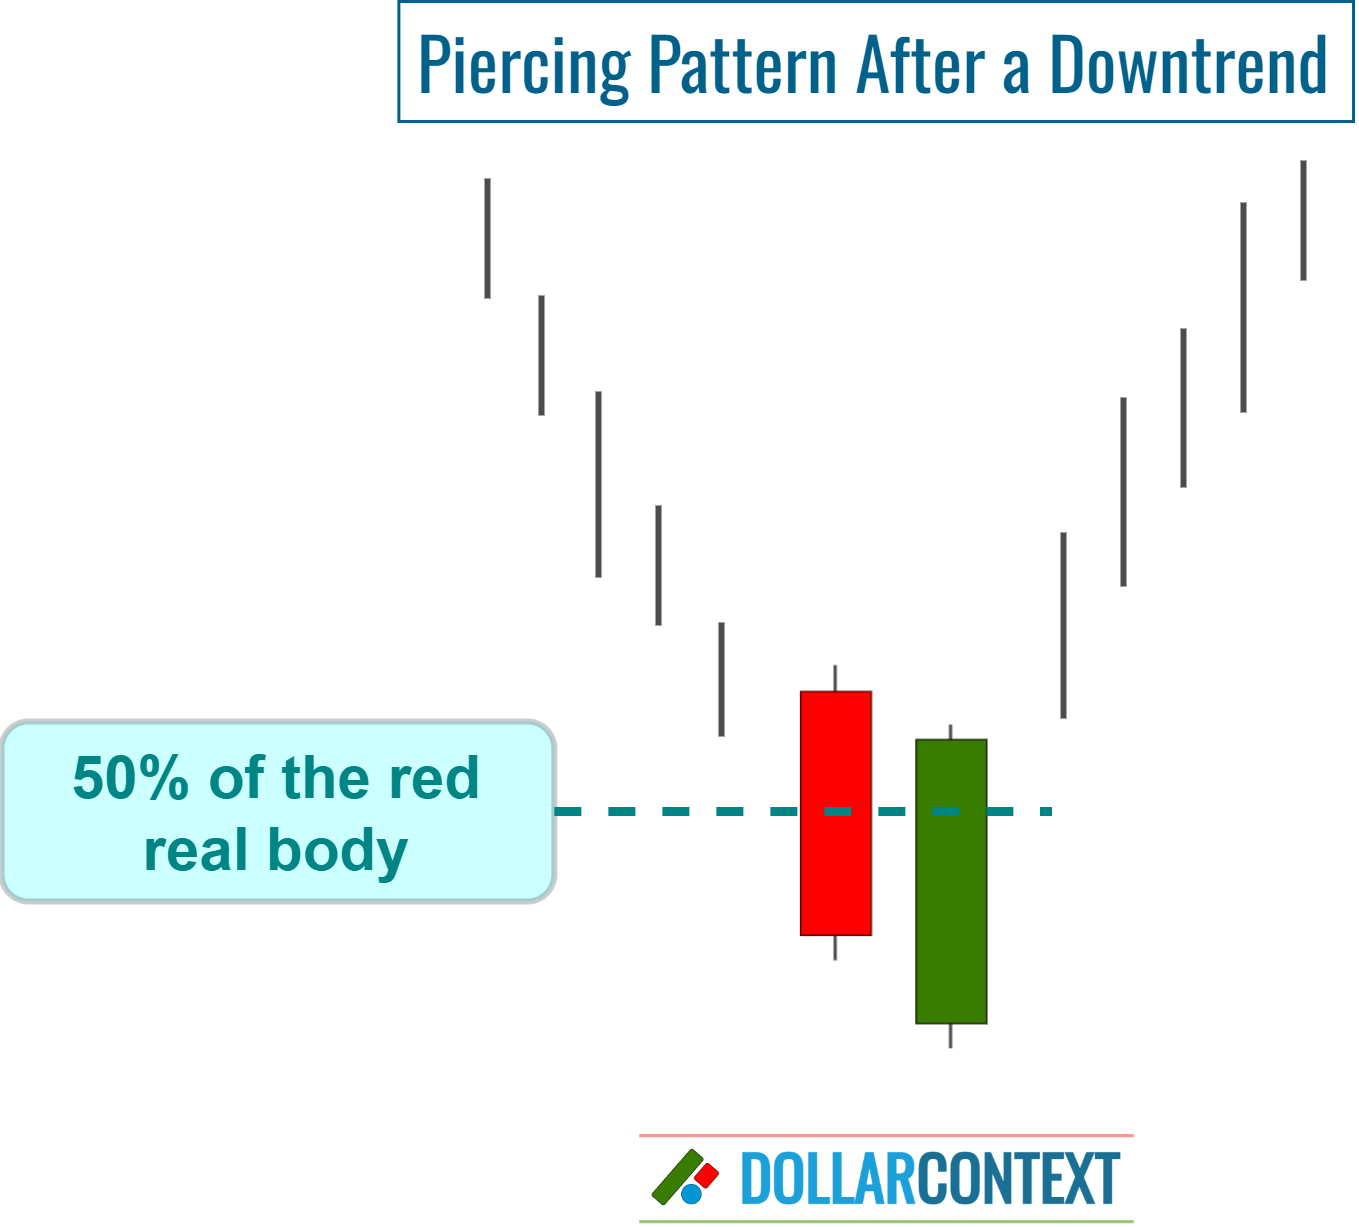
- Candlestick patterns typically act as indicators of a potential trend reversal, suggesting that the prevailing trend could soon change, paving the way for a new direction. In the case of the piercing pattern, it always emerges after a downtrend.
- They are versatile across various time frames, from minutes and hours to days, weeks, and even months.
- They can be used in any market where price data is available, be it commodities, stocks, forex, or indices. This adaptability stems from the fact that candlestick patterns are rooted in price action, a consistent feature across all markets.
Contents
1. The Shape of a Piercing Pattern
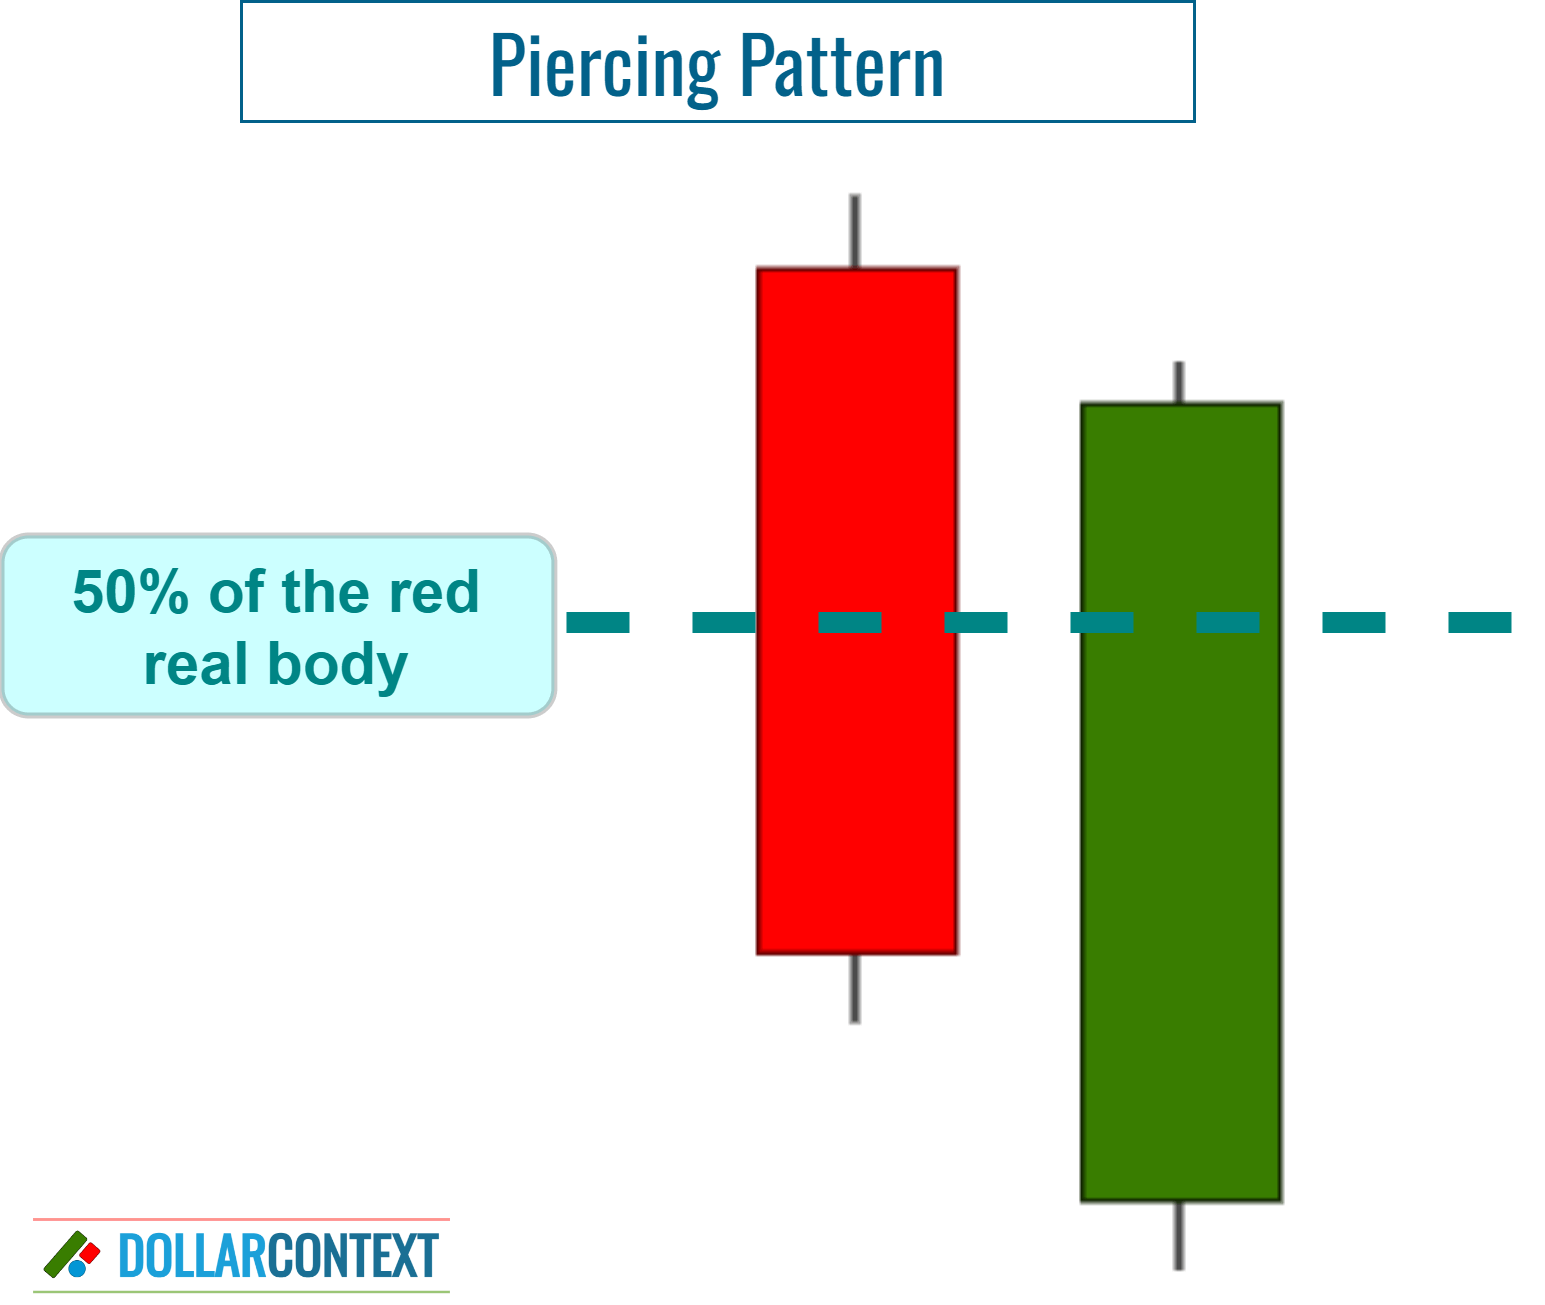
The piercing pattern is a two-candle combination that is easily recognizable because of its unique form, where the second session "pierces" the first candle. Here are the visual attributes of a piercing pattern:
- First Candle:
- This is a bearish (downward) candle.
- It typically has a long body, indicating a continuation of the existing downtrend.
- Second Candle:
- This is a bullish (upward) candle.
- It opens below the low point of the first candle.
- It closes above the midpoint of the first candle's body, but doesn't eclipse the entire downward movement of the first candle.
A piercing pattern is the inverse of a dark cloud cover. While a piercing pattern emerges after a downtrend, the dark cloud cover arises after an uptrend.
2. Context
The context in which a piercing pattern emerges is just as relevant as the combination's shape itself. Thus, following a pronounced or extended downtrend, this pattern acts as a reversal indicator that can be used to:
- enter a bullish position, or
- close existing short positions.
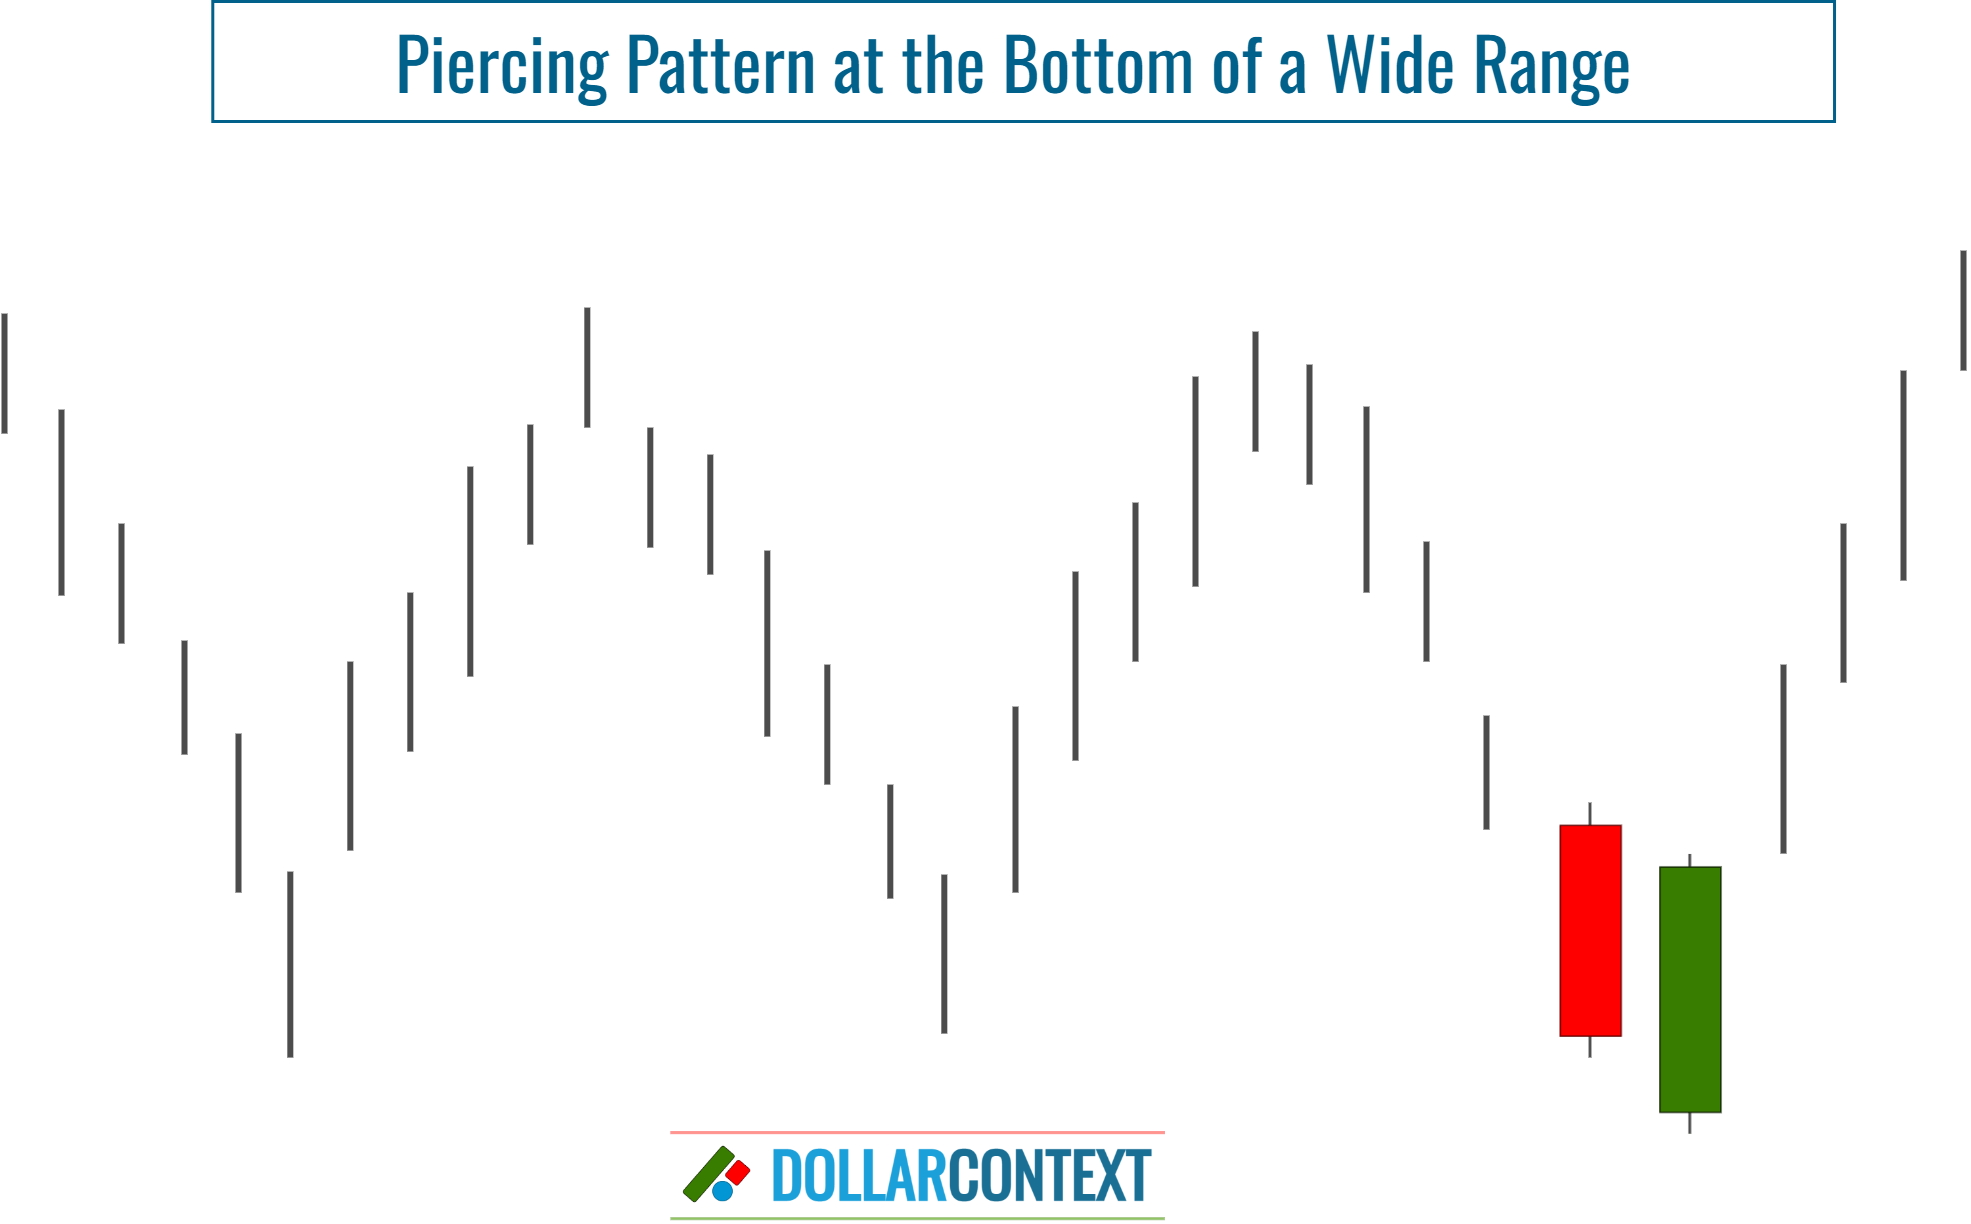
Typically, a candle resembling a piercing pattern holds little relevance when seen during an uptrend or a narrow sideways trend. Nevertheless, if it appears near the lower end of an expansive trading range, it could signal a surge towards the range's upper limit.
Following the emergence of a piercing pattern, the likelihood of a bullish reversal amplifies in proportion to the duration and sharpness of the prior trend.
Why does a piercing pattern near the base of a sideways trend indicate a reversal? It's because this pattern emerges following a minor downtrend within the larger framework of a predominant sideways price movement on a grander scale.
These contextual elements also play a pivotal role in assessing the reliability of a piercing pattern as a sign of bullish momentum:
- Support zone: If a piercing pattern appears within a support area, the bullish implications of this pattern intensify significantly.
- Further candlestick patterns: There are situations where a piercing pattern is preceded or followed by additional bullish candlestick patterns in the same price range. These patterns reinforce each other to increase the probability of a successful reversal.
- Relative size of the two-candle formation: The dimensions of the candles that make up the piercing pattern should be significant compared to the previous sessions. A more sizable piercing pattern typically provides a more reliable signal.
- Oversold market: As a market approaches an oversold condition, the probability of a trend reversal after a piercing pattern increases.
3. Psychology Behind a Piercing Pattern
Psychologically, a piercing pattern is a strong visual representation of the shifting sentiment in the market.
Initially, the bearish momentum is evident with the first candle's strong downward movement. This suggests that sellers have a firm grip on the market, and there's a general pessimism about the asset's value. This downward push can often cause the asset to become undervalued or approach oversold conditions, leading to potential buying opportunities for those who see the discounted value.
The second candle of the piercing pattern, however, tells a story of change. It begins the session by opening even lower, seemingly confirming the bearish sentiment. But then there's a sudden influx of buyers, pushing the price up and closing significantly higher than the midpoint of the previous day's candle. This abrupt change hints that the bears are losing control, and the bulls are starting to step in. The pattern captures a moment of transition where initial despair and pessimism are overtaken by newfound hope and optimism, suggesting a potential trend reversal.
4. Entry Points for a Piercing Pattern Strategy
There are different options for entry points after a piercing pattern emerges.
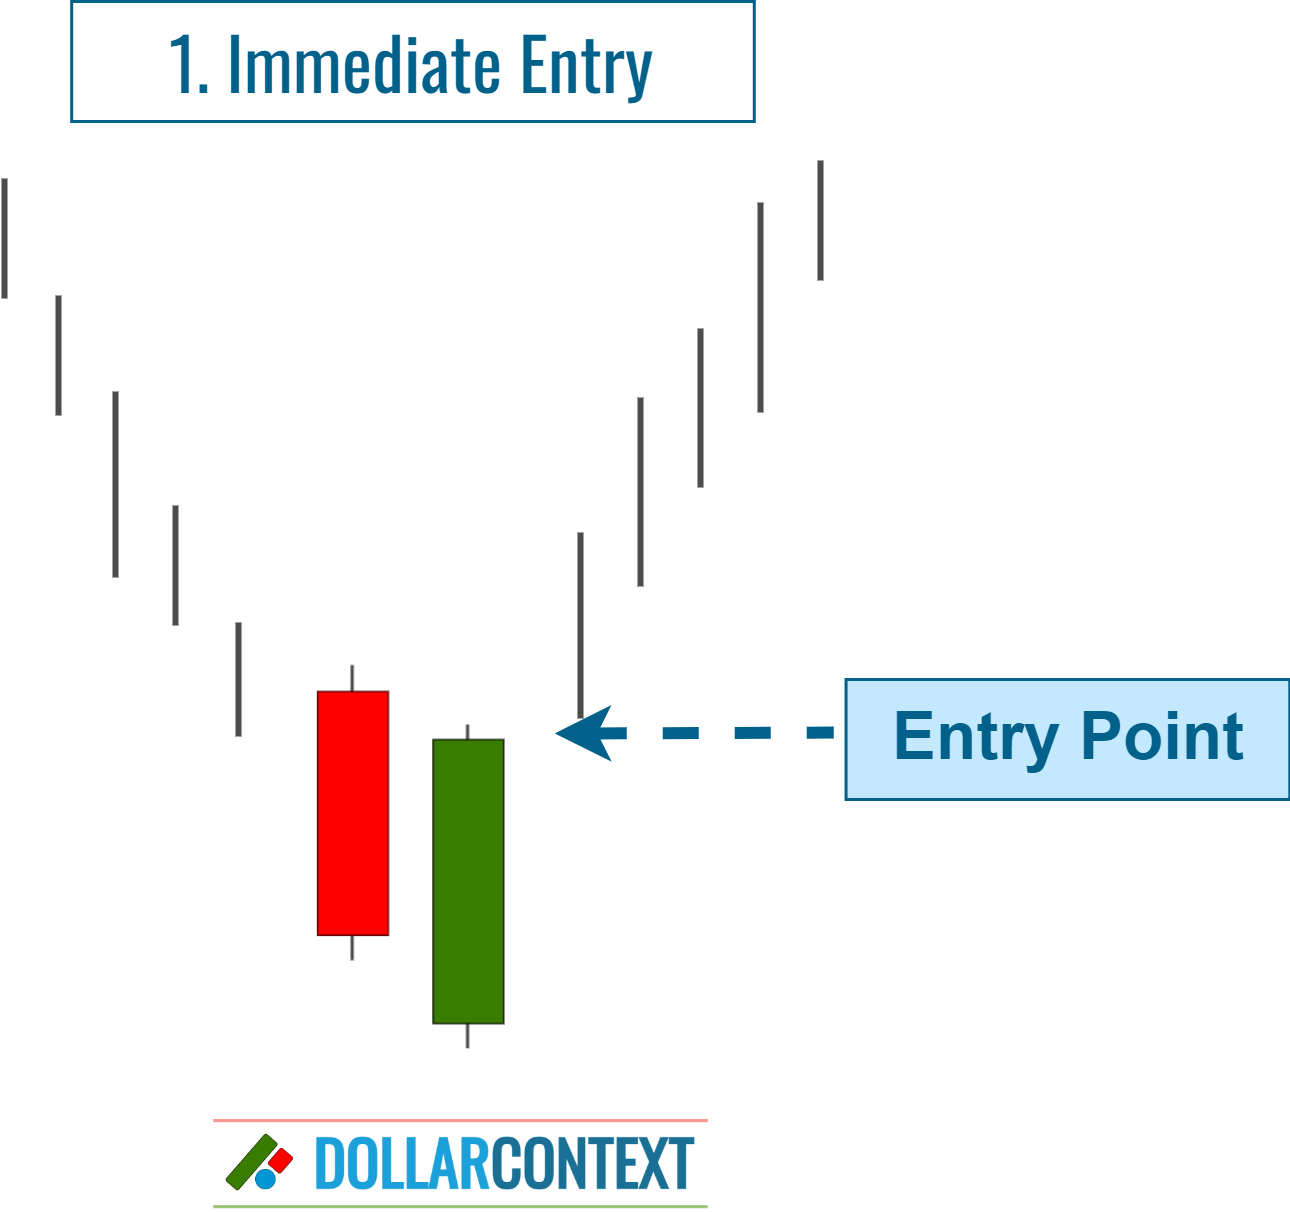
4.1 Immediate Entry
Once the piercing pattern is verified (following the closing of the second candlestick), one can initiate an entry. This tactic is bolder and hinges on expecting a sustained upward trend (see example 7.1 in the last section).
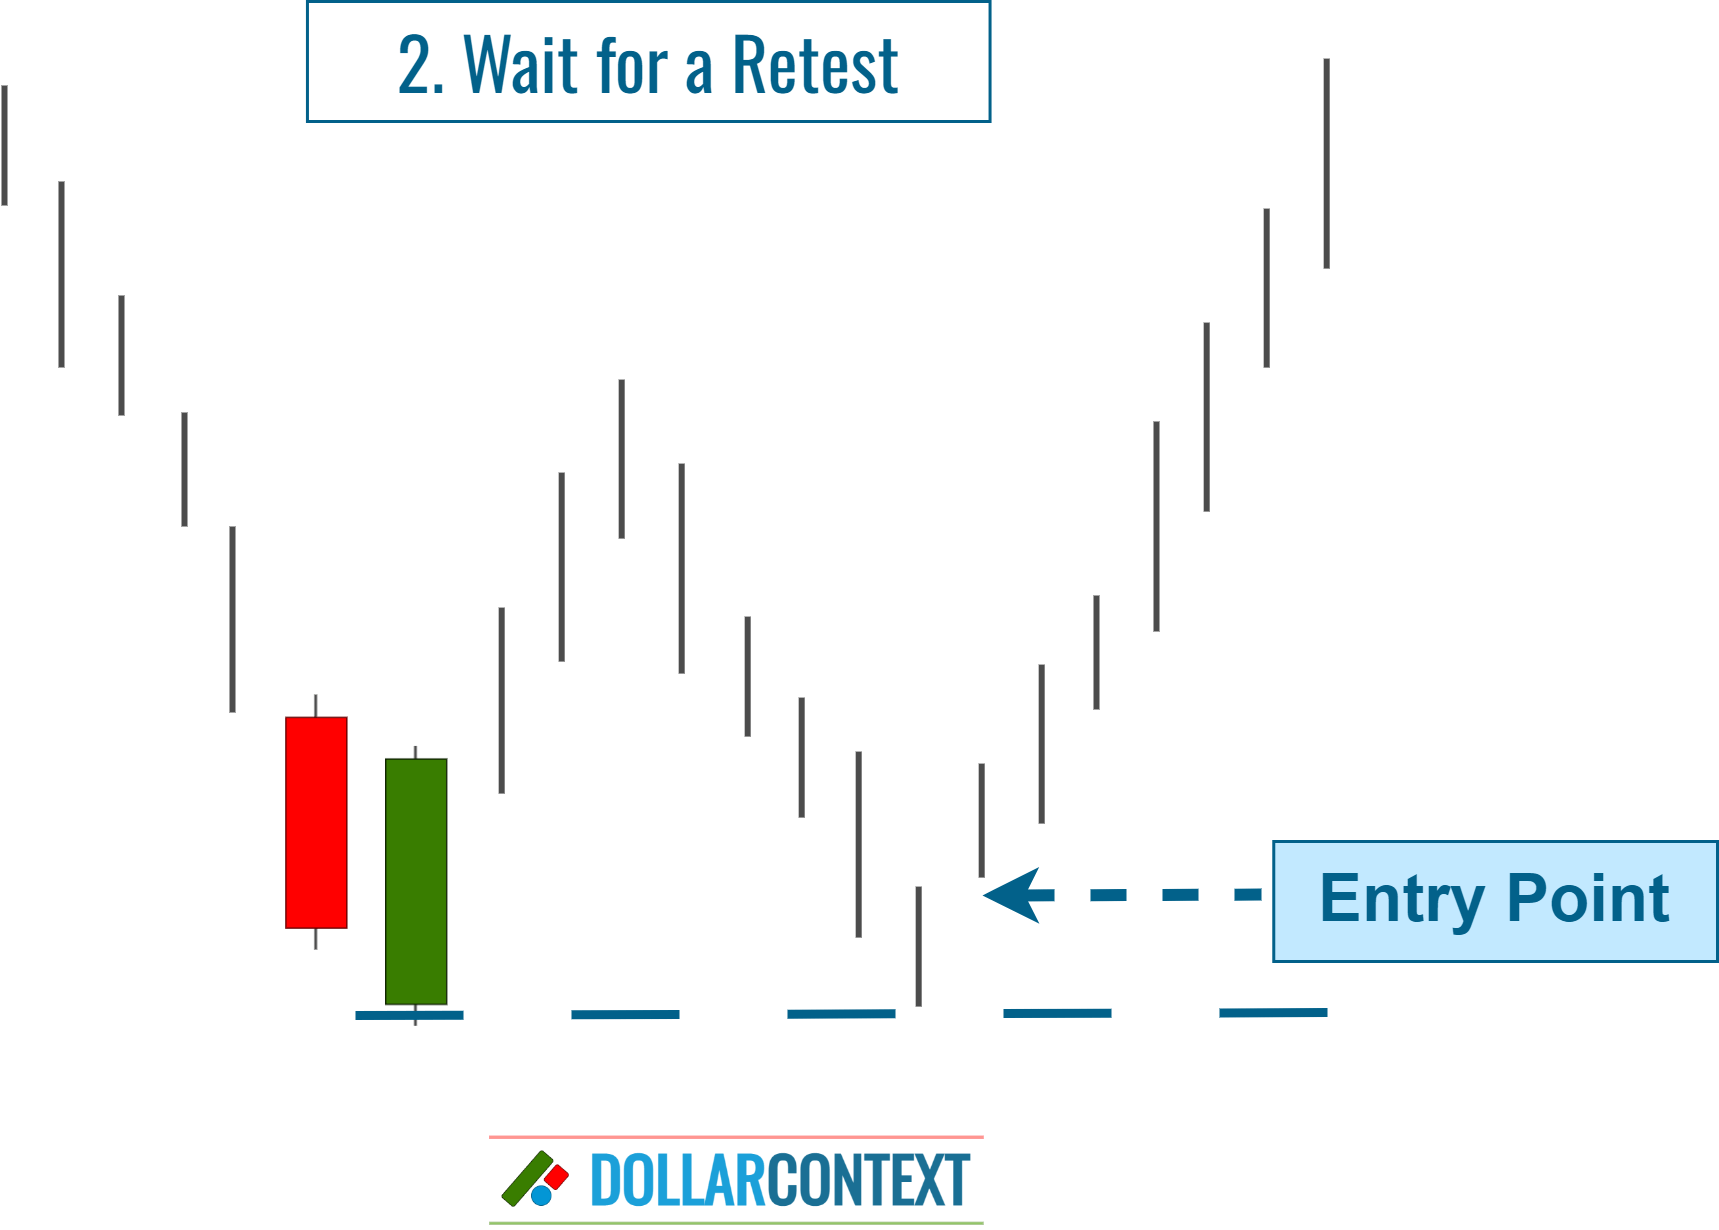
4.2 Wait for a Retest
Given that the piercing pattern is most effective following a strong downtrend, it's important to acknowledge that a rally stemming from the piercing pattern may encounter selling pressure in the short term.
Thus, the initial upward move could fail, leading the market to retest the lows of the piercing pattern. This is why some traders wait for the market to retest the low of the piercing pattern before buying.
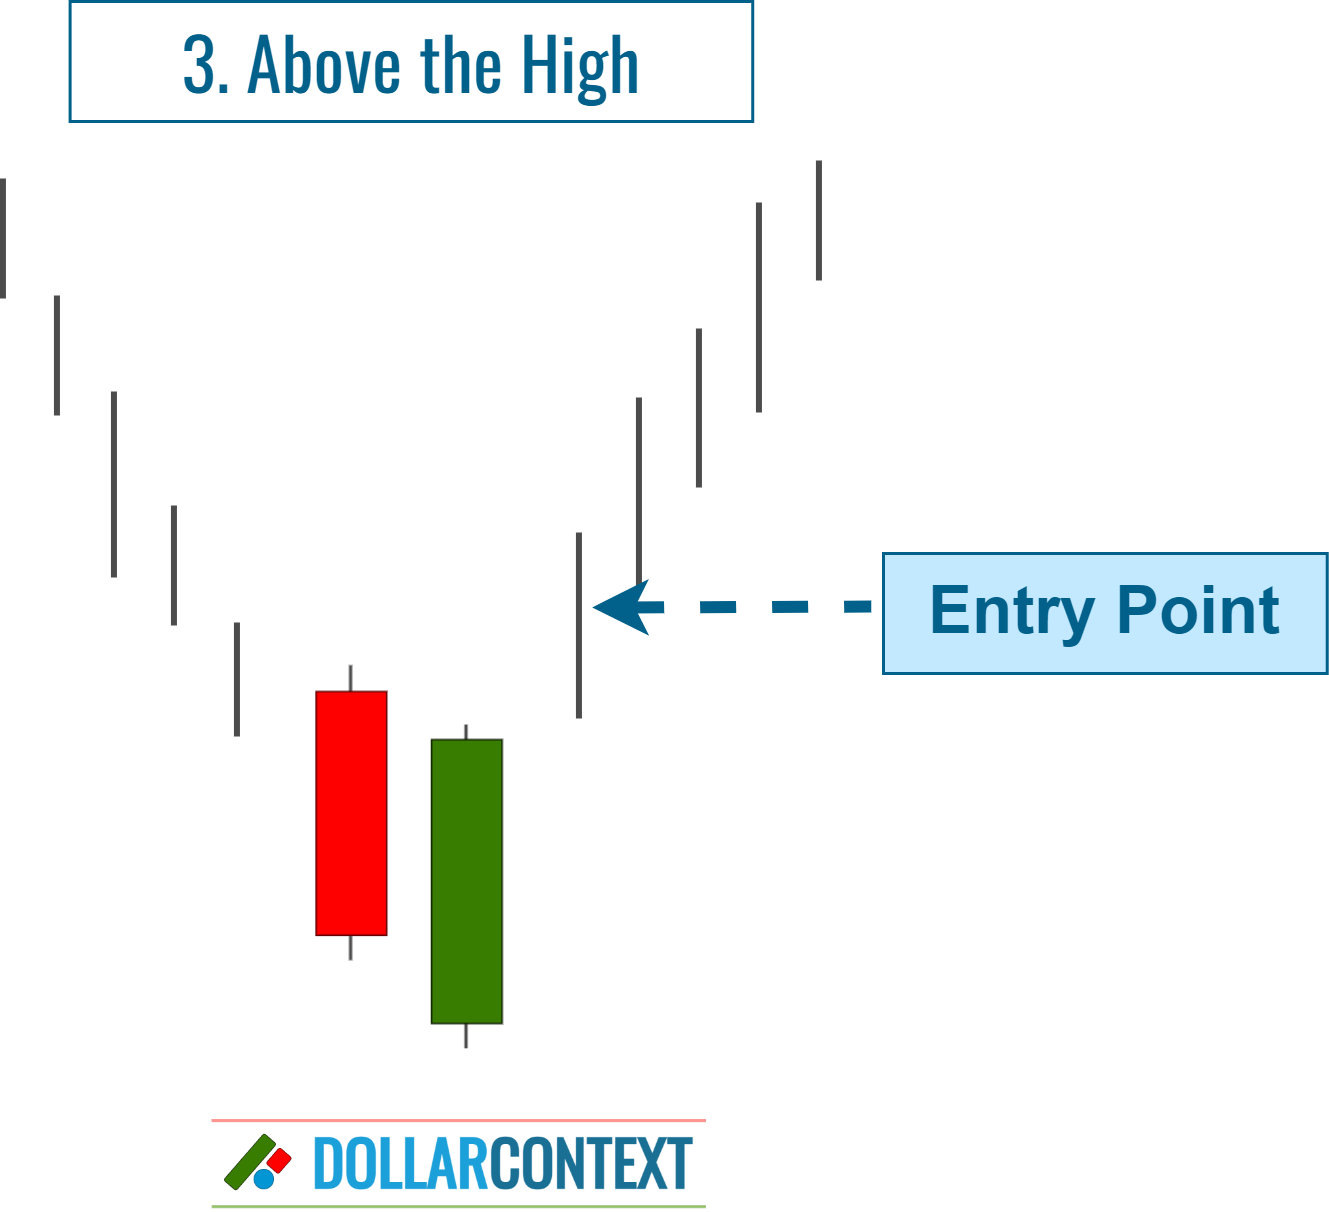
4.3 Above the High
Initiate an entry once the price surpasses the peak of the second candlestick in the piercing pattern. This strategy seeks further validation of robust bullish momentum.
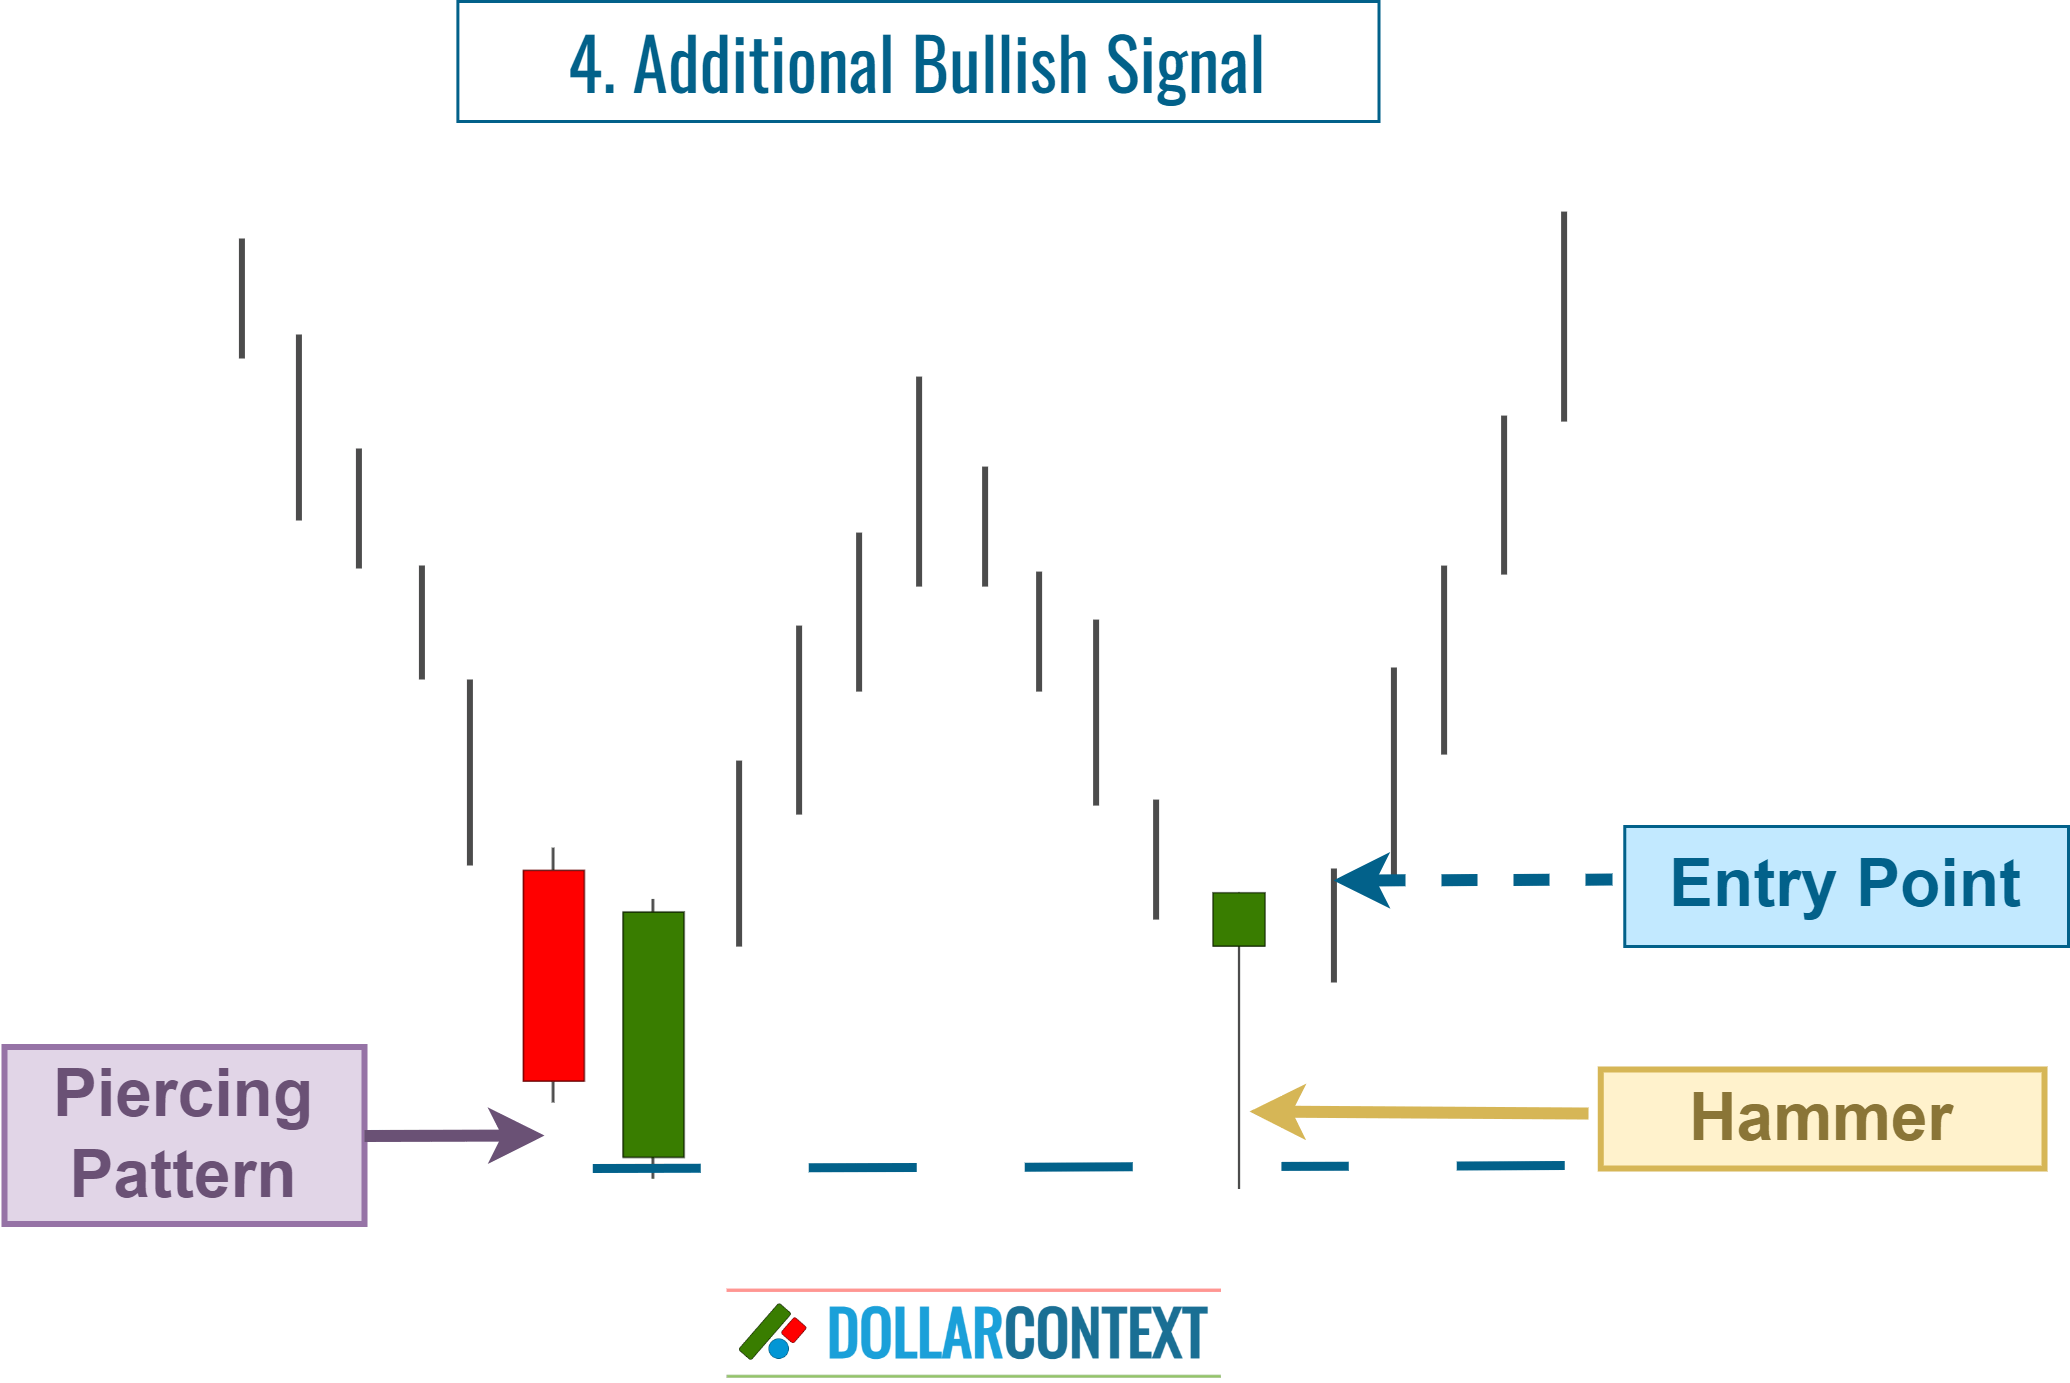
4.4 On an Additional Bullish Signal
Following the piercing pattern, hold off on entering until another bullish candlestick pattern or indicator presents itself to increase the likelihood of a trend reversal. This might manifest as a hammer, a morning star, or some other bullish sign (see example 7.2 in the last section).
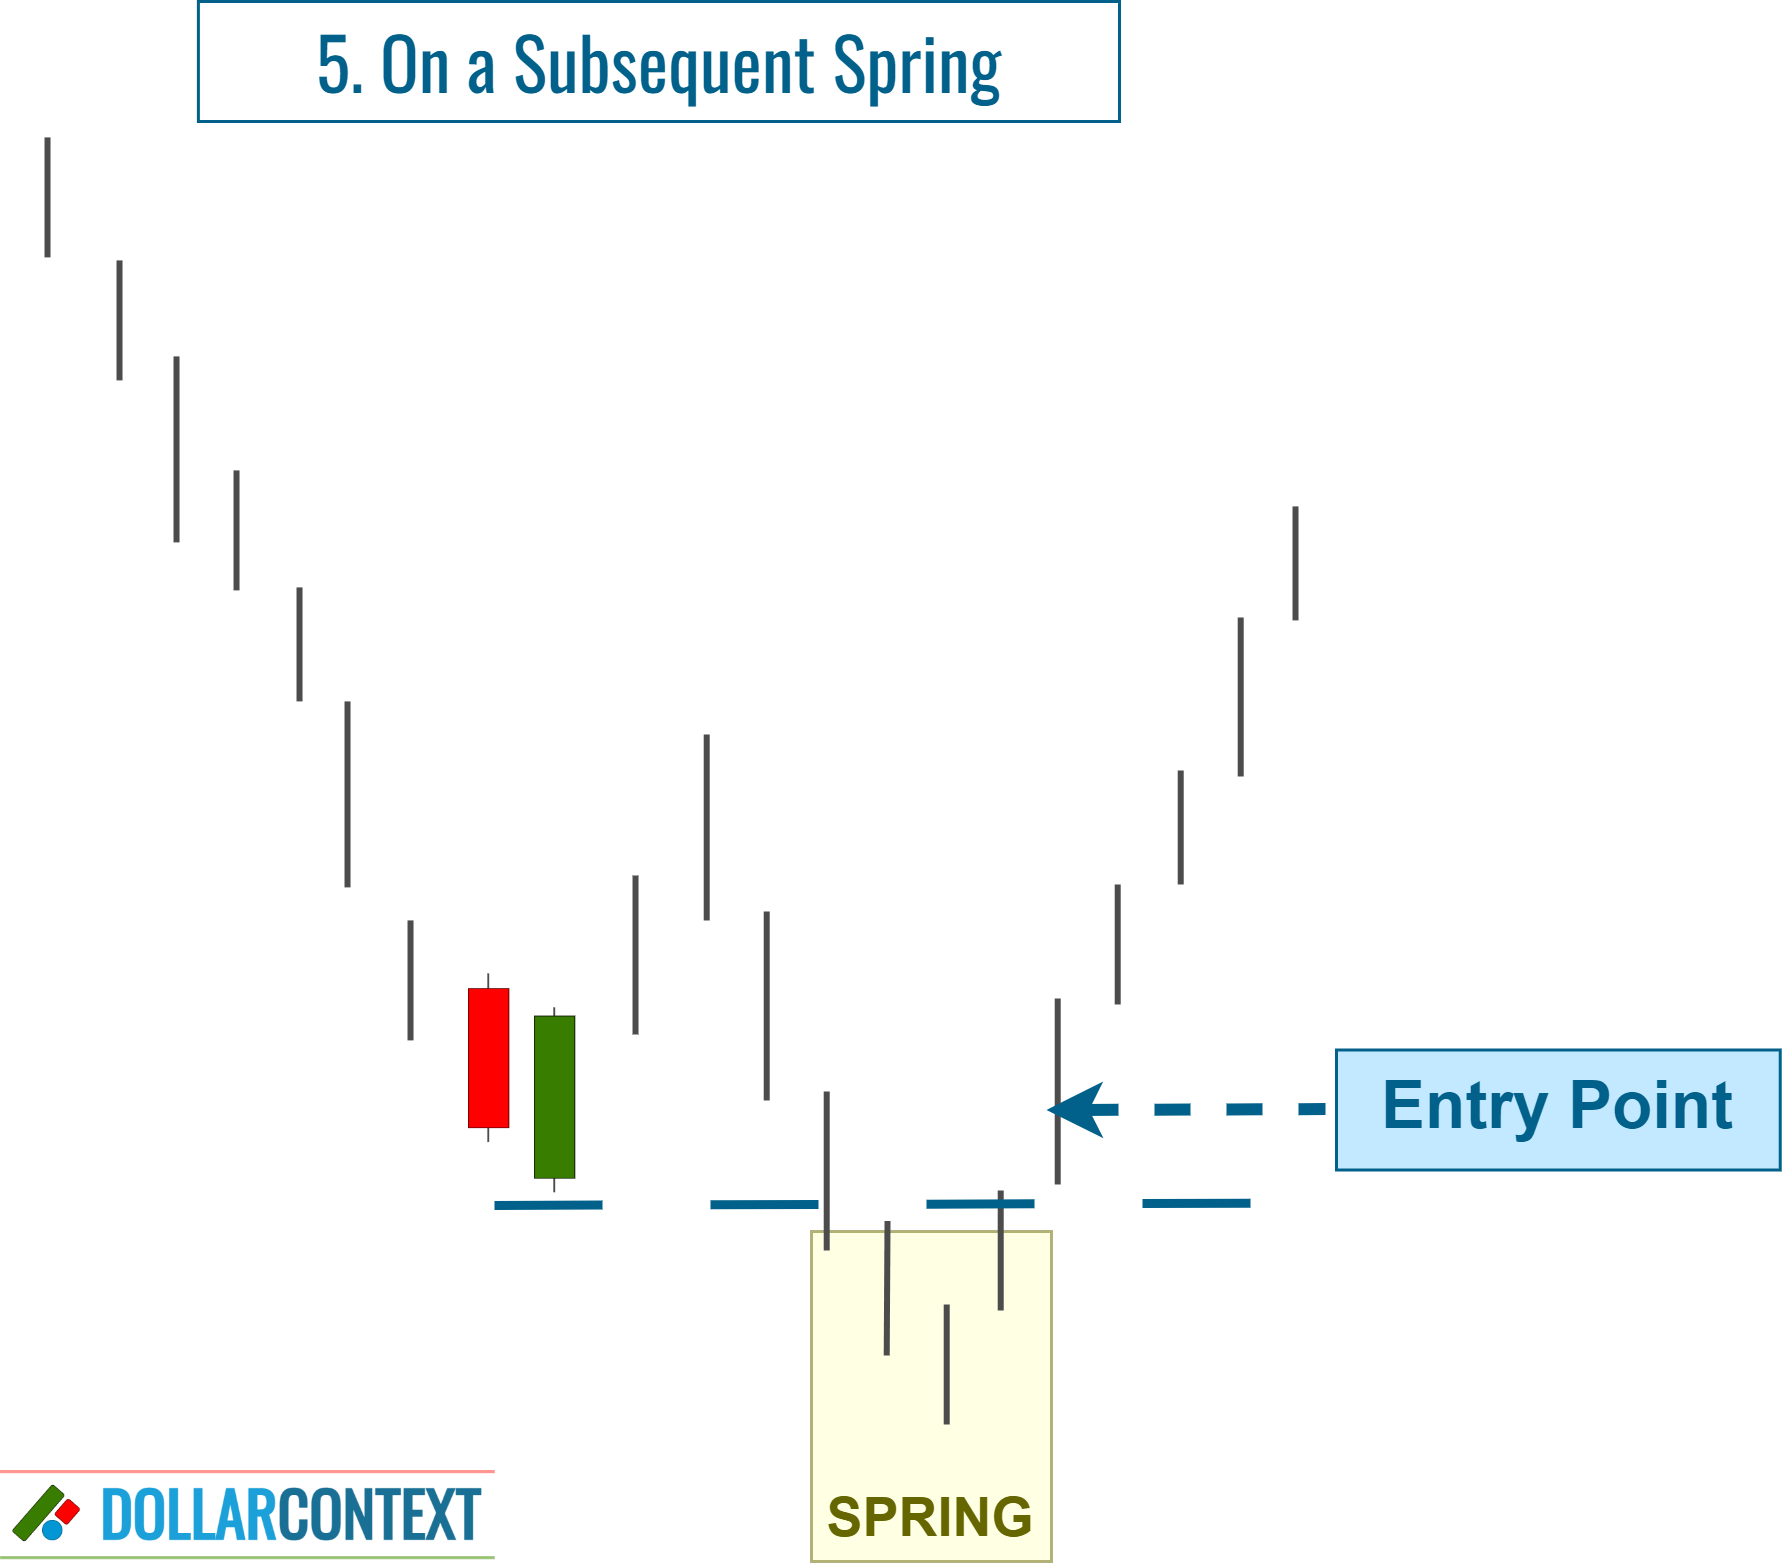
4.5 After a Spring
A spring represents a situation where the market briefly breaches a support level, but quickly pivots and moves in the opposite direction. In essence, it's a deceptive downward breakout (see example 7.3 in the last section).
4.6 Mixed Strategy
A mixed strategy entails making a tentative long entry upon spotting a piercing pattern, and then increasing the position once the lows of the pattern are successfully retested.
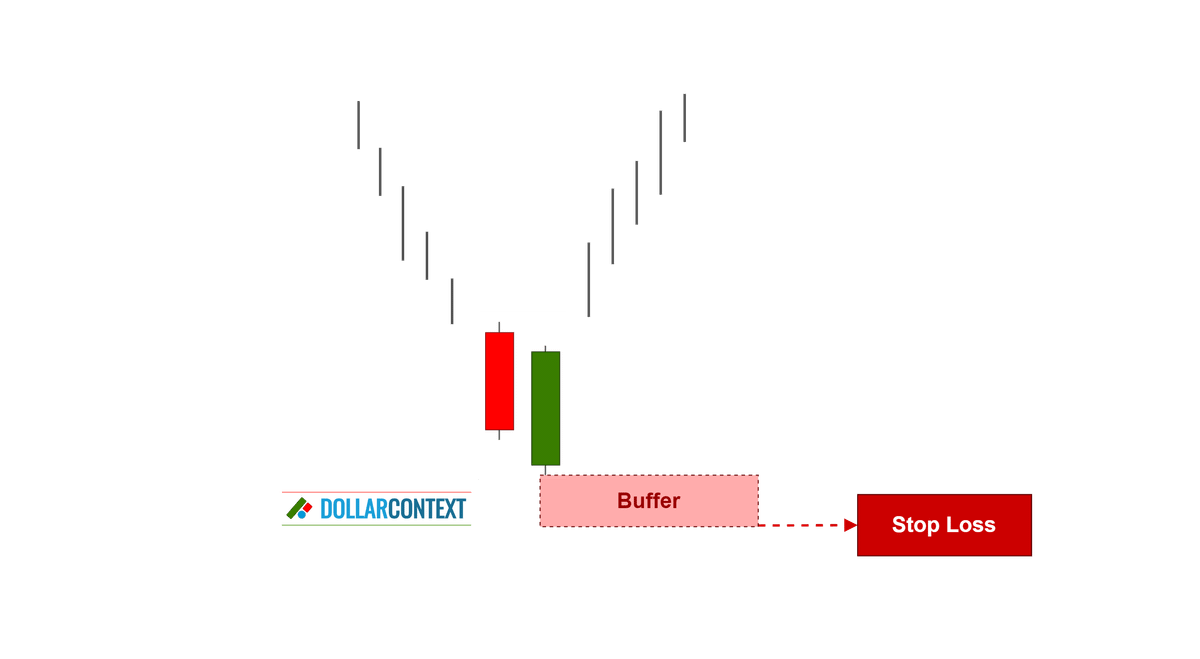
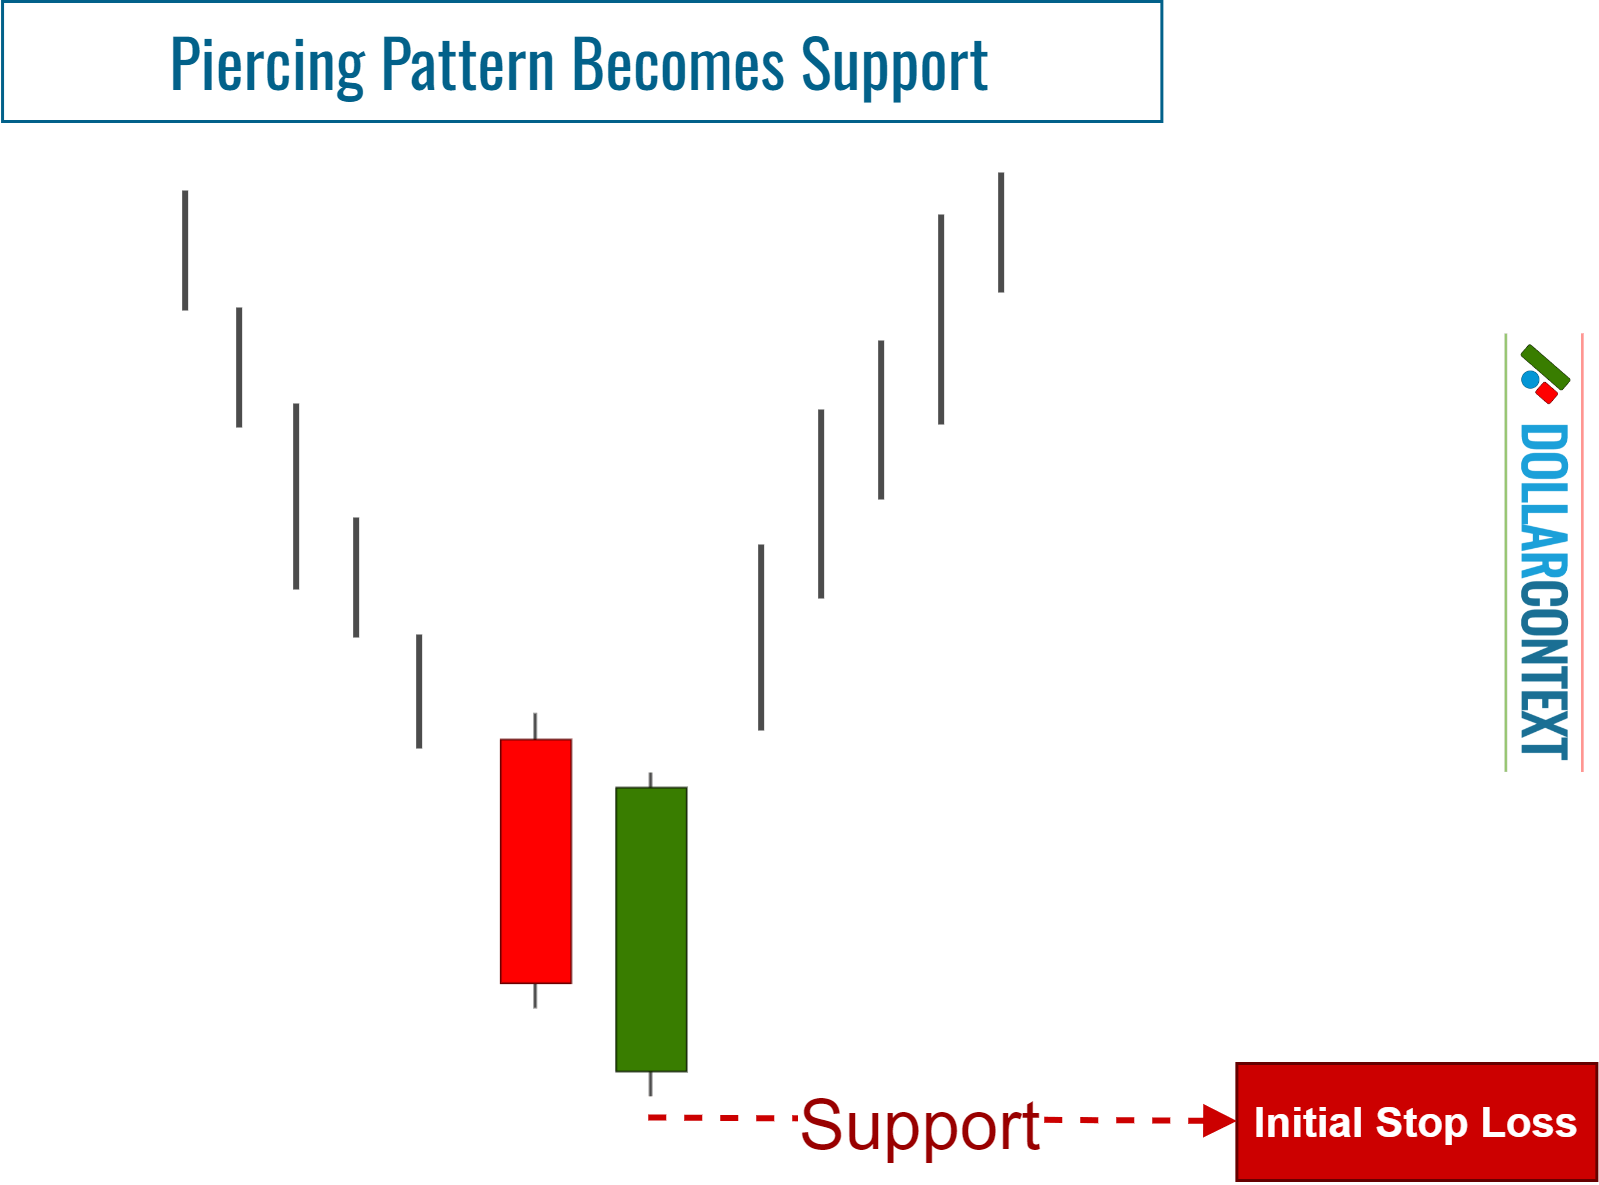
5. Stop-loss
The price range of a piercing pattern becomes support. You can use the lower limit of this range to determine the initial stop-loss of a piercing pattern.
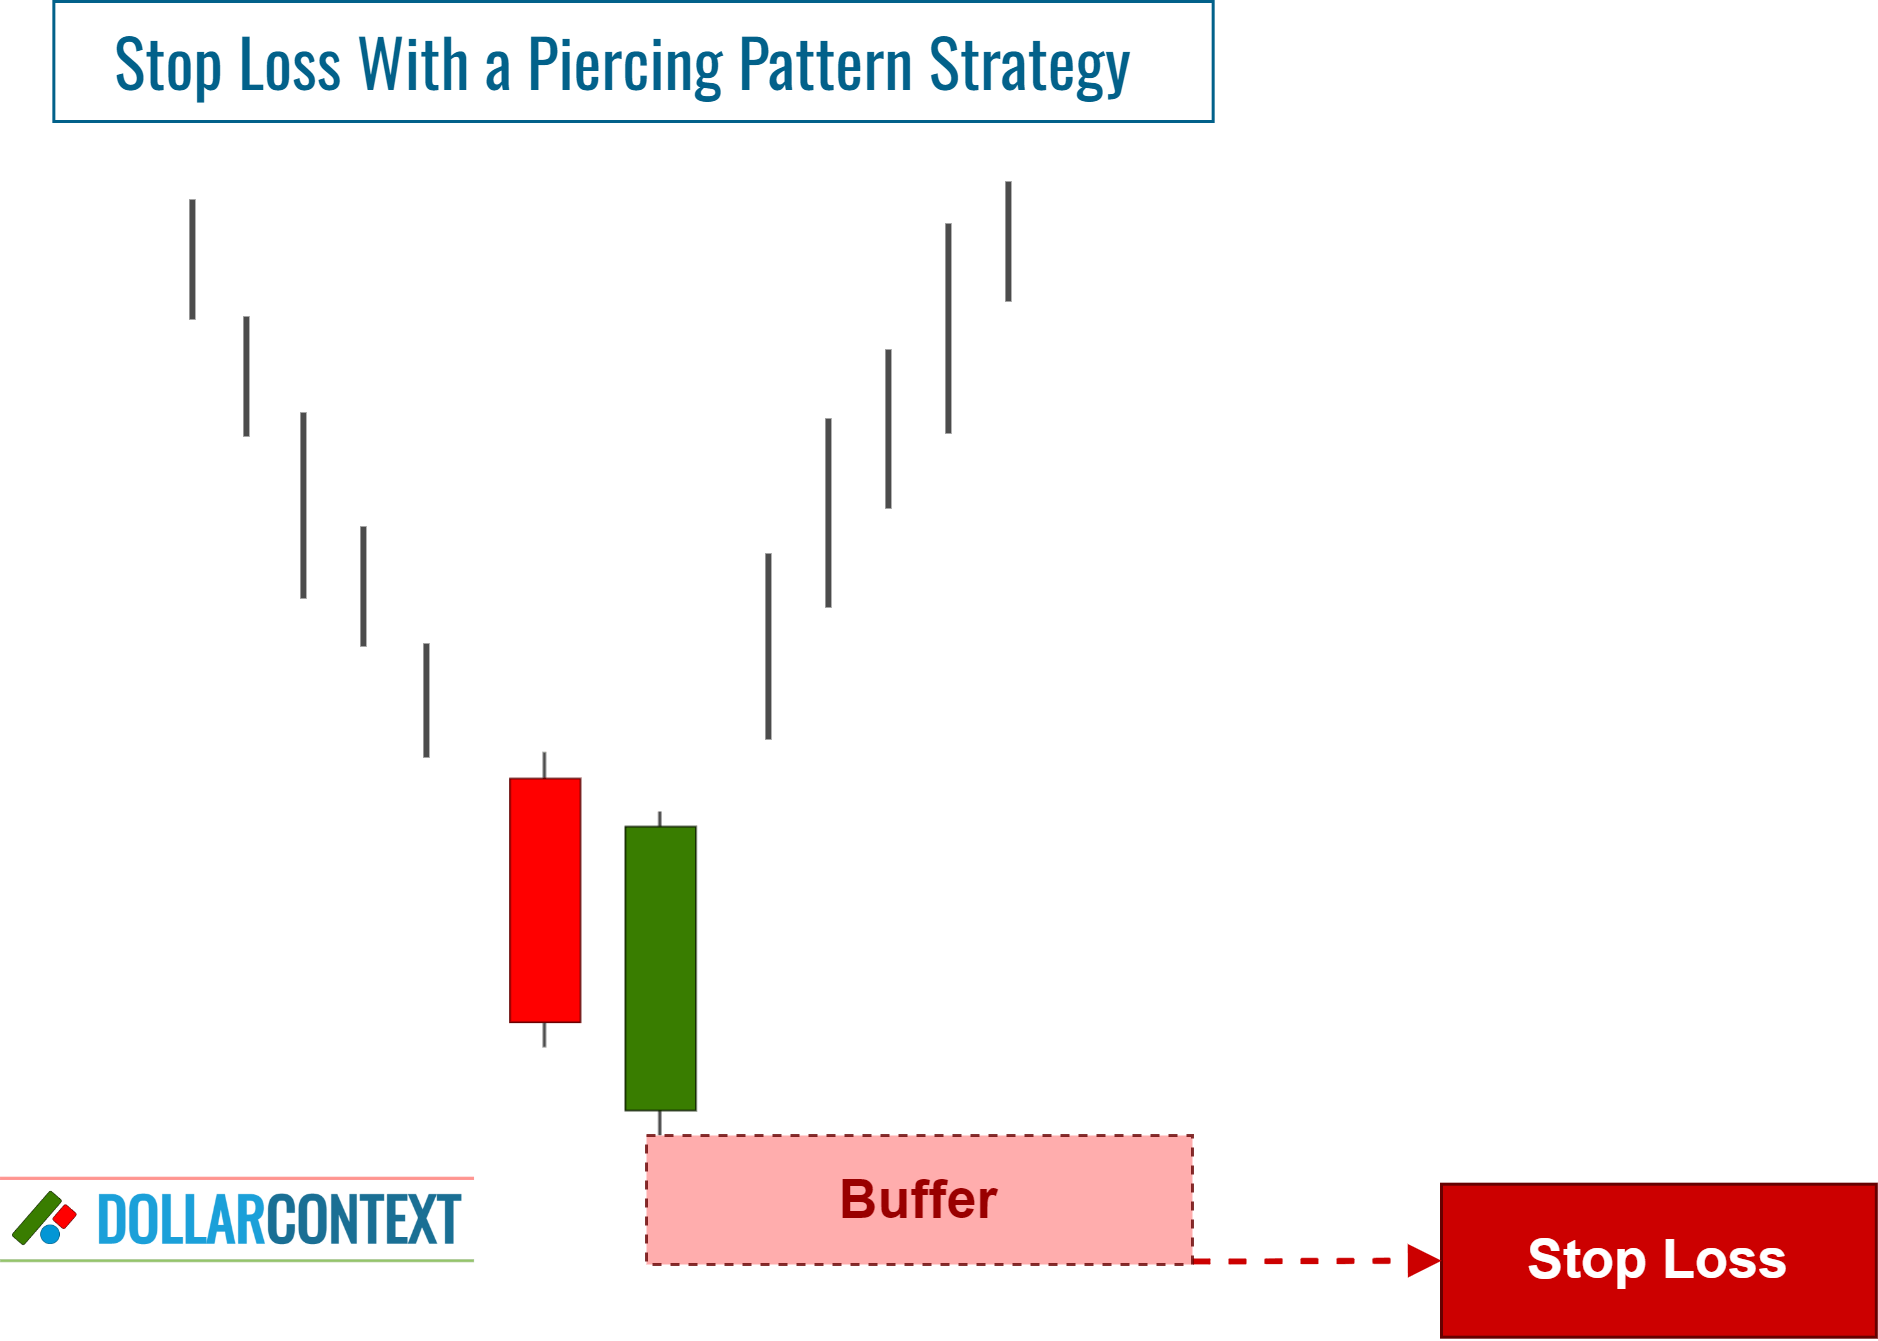
Having said that, to protect against premature exits during volatile sessions or because of misleading breakouts, consider these two additional factors:
- You can add a buffer to avoid being impacted by false breakouts.
- Determine a stop on a close rather than simply depending on intra-session price movements.
As your trade unfolds, you might notice subsequent candlestick formations that bolster the foundational support set by the piercing pattern. In these cases, think about modifying your stop-loss to include the lowest point spanning these patterns.
6. Profit Target
While candlestick patterns often signal trend reversals and potential entry points, they don't directly suggest levels for realizing profits. To pinpoint these levels, consider using other techniques like traditional chart formations, Fibonacci tools, or moving averages.
However, if you find yourself in a beneficial long position initiated by the emergence of a piercing pattern, and a subsequent bearish candlestick pattern appears, you may interpret this new formation as an indicator to close out the piercing pattern trade.
7. Examples
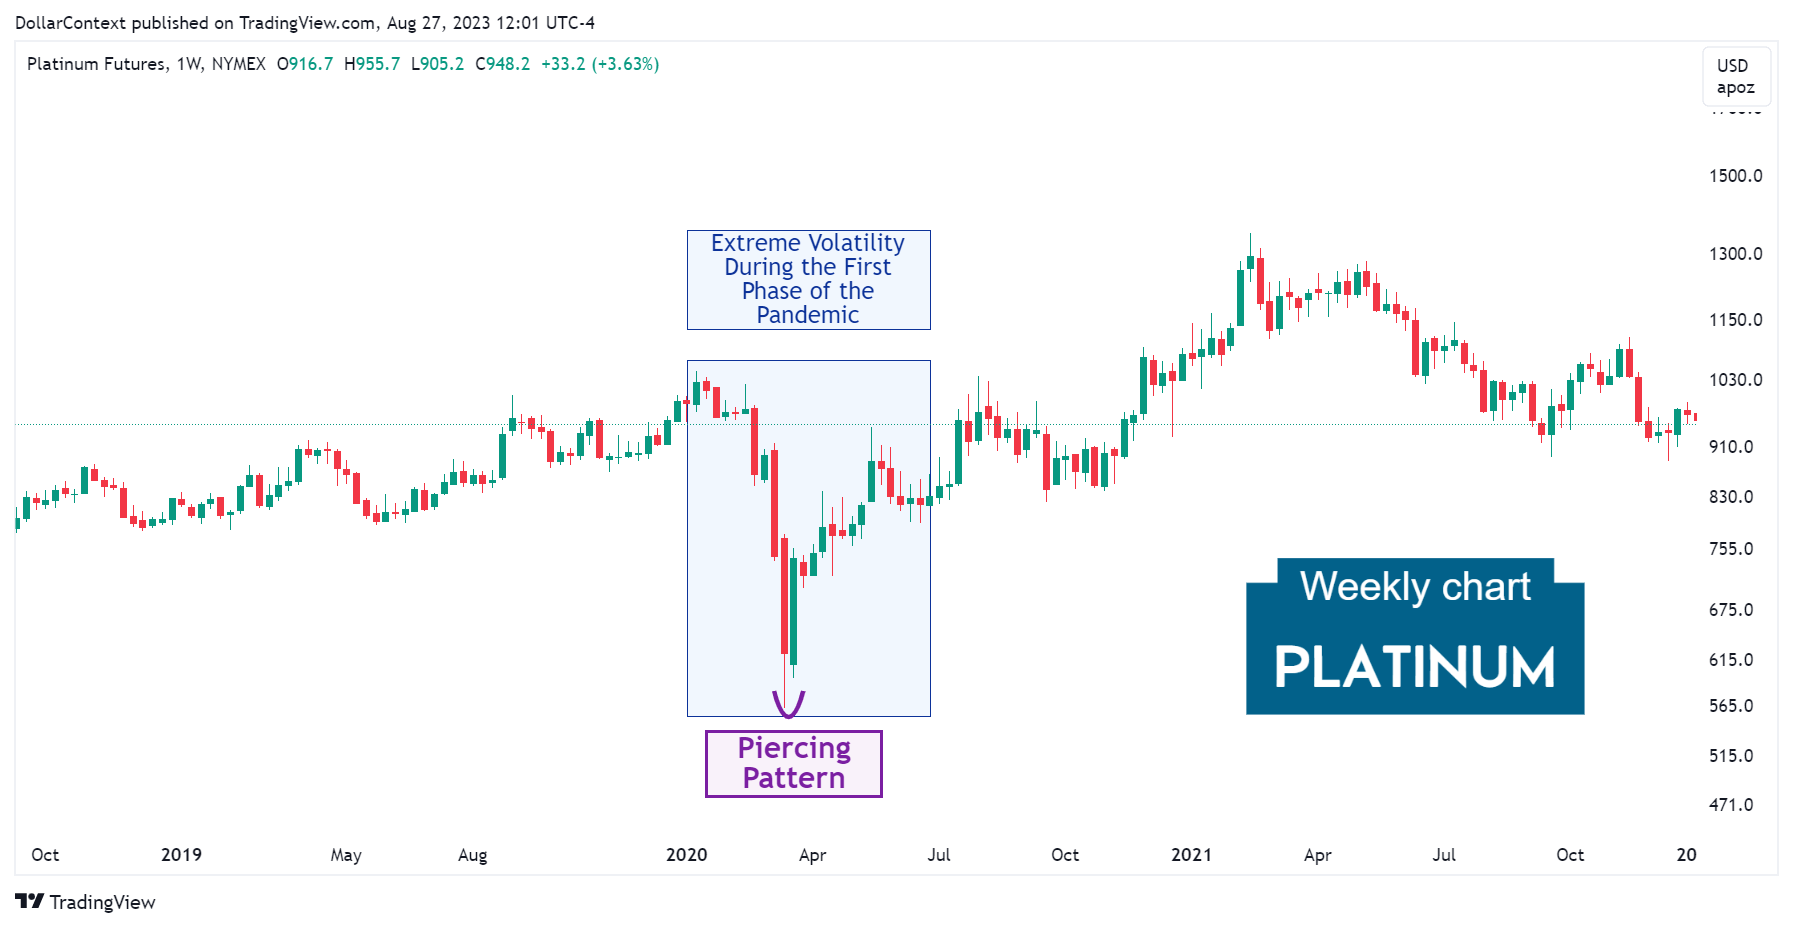
7.1 Platinum (Weekly Chart)
Following the general collapse in commodity prices during the first stages of the pandemic, the platinum market displayed a piercing pattern in March 2020. Observe the large size of the bearish candle and the swift change in sentiment reflected by the second session of the pattern.
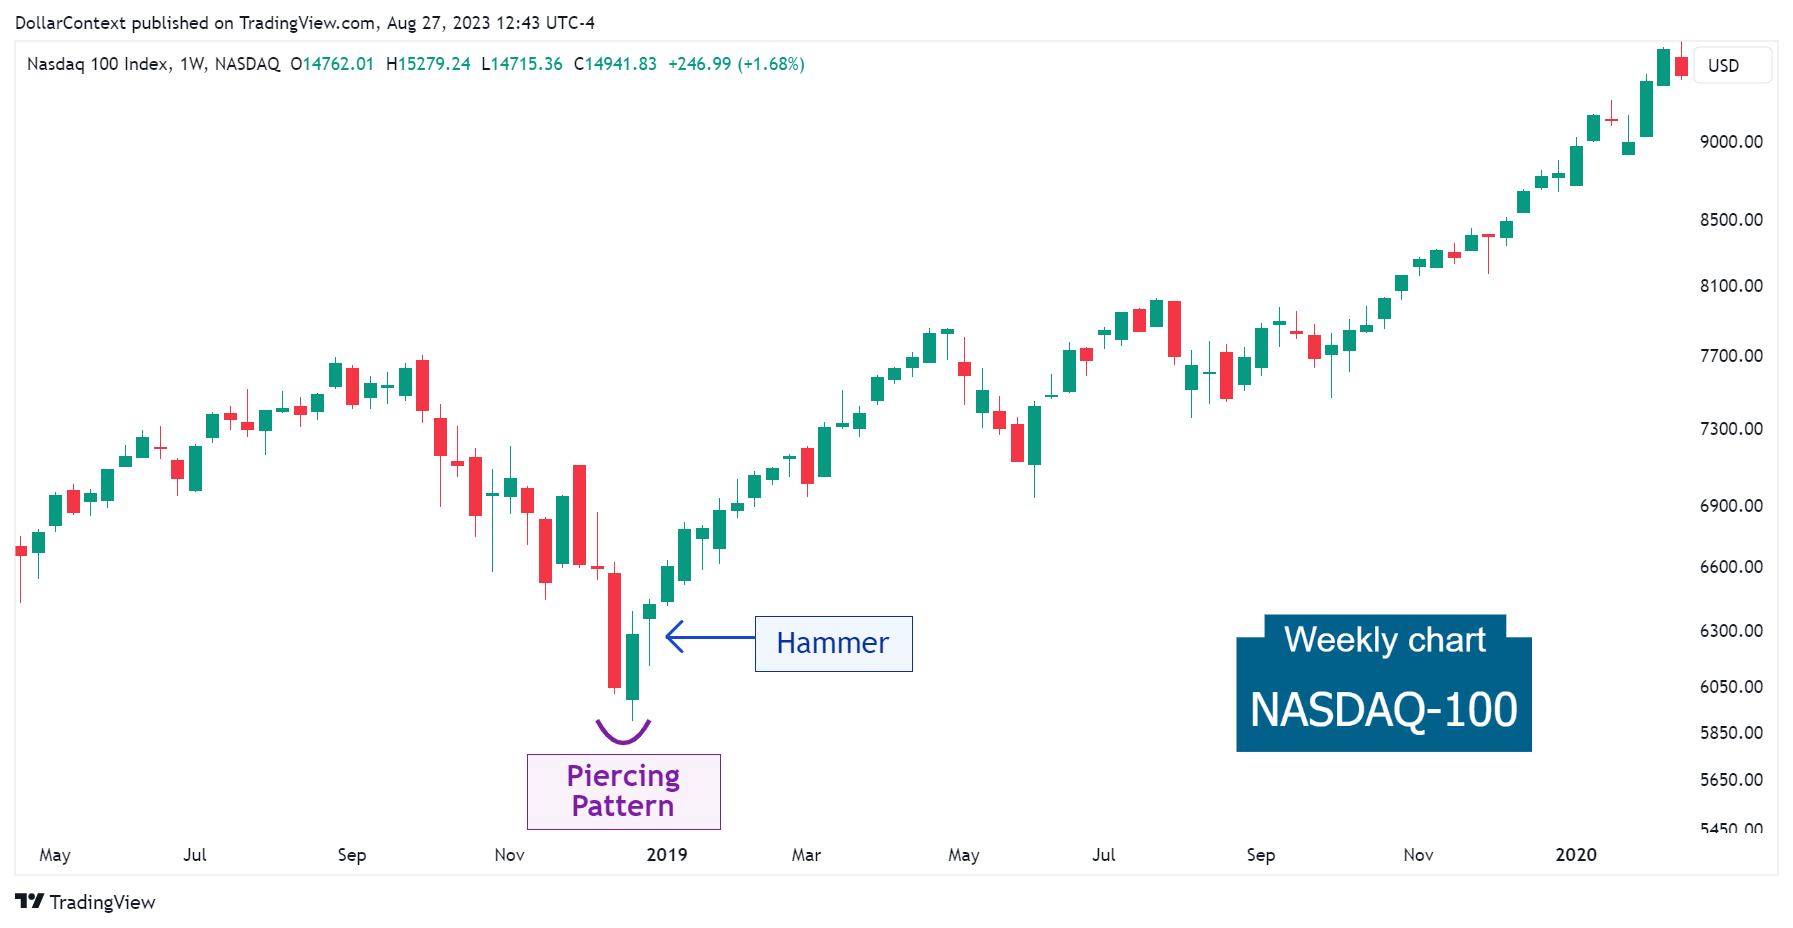
7.2 Nasdaq-100 (Weekly Chart)
In December 2018, the Nasdaq-100 index showcased a piercing pattern. Notice the subsequent appearance of a hammer pattern within the support zone defined by the price range of the piercing pattern. This tandem heightened the likelihood of a shift towards a bullish trend.
7.3 Natural Gas (Weekly Chart)
As previously mentioned, a piercing pattern can sometimes be succeeded by a spring (false breakout) of the support level set by it. The natural gas market in February 2023 serves as an illustration of this occurrence.
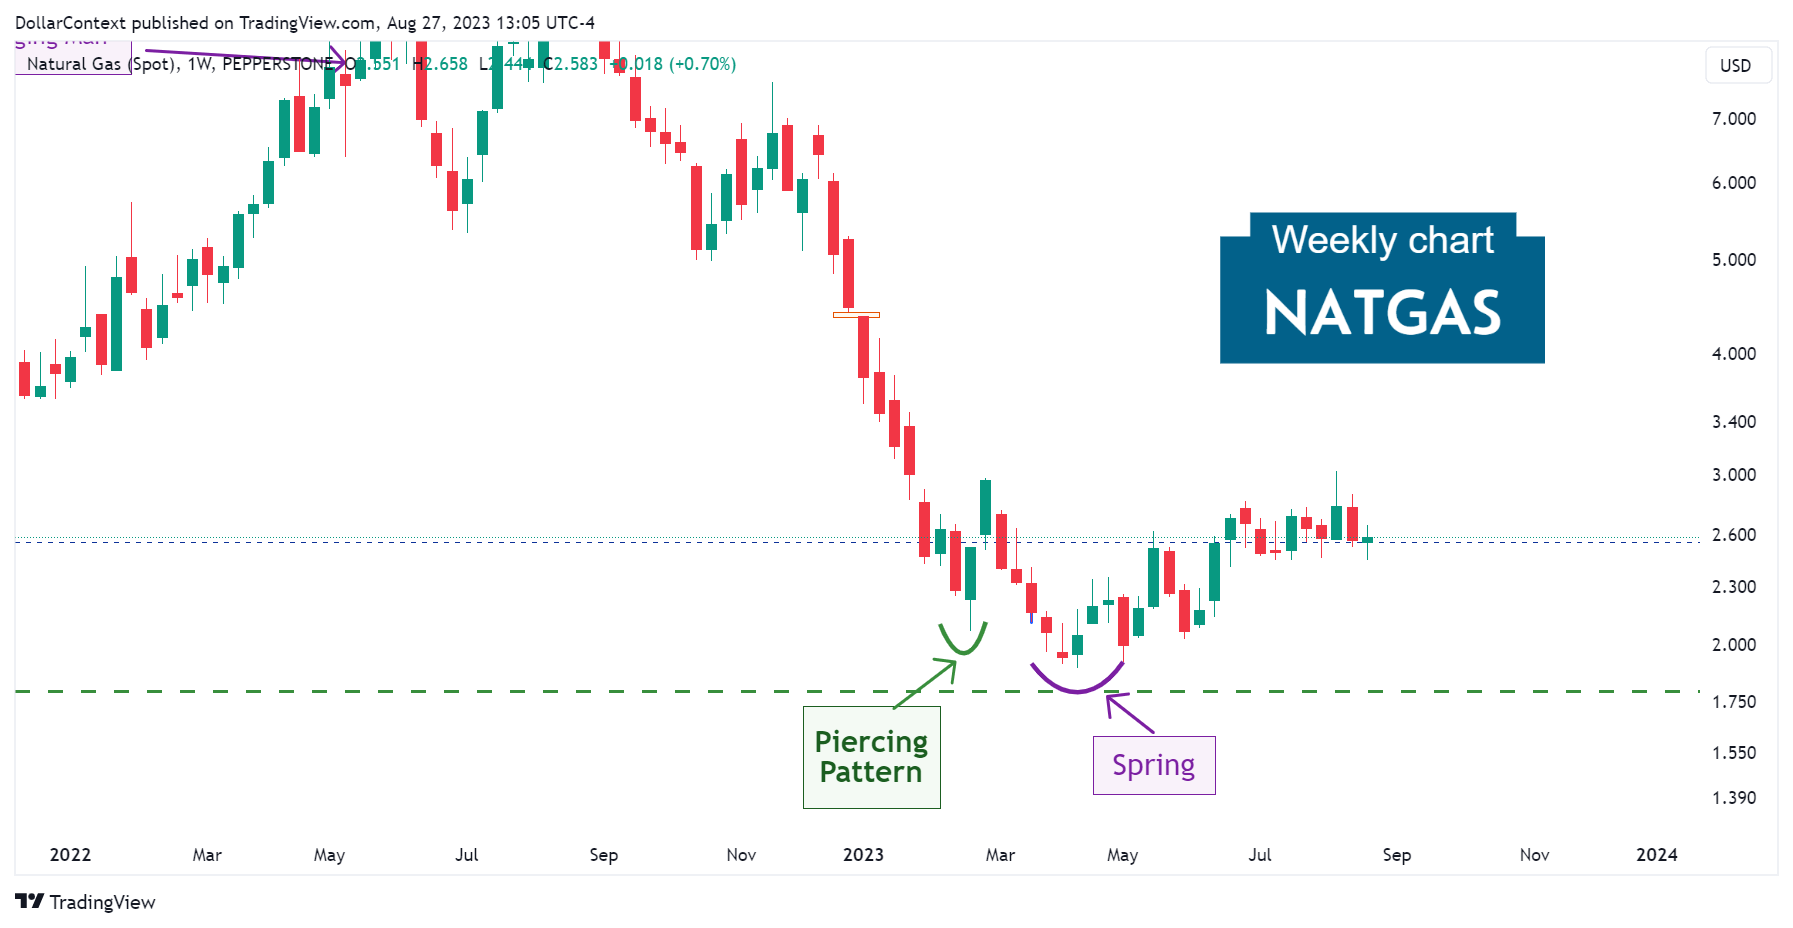
We cannot confirm whether the natural gas market will successfully evolve into a new bullish trend after this piercing pattern. However, the spring following the pattern strengthens the likelihood of this outcome.
7.4 More Examples
- Case Study 0020: Hammer and Piercing Pattern (AUD/USD)