How to Identify a Piercing Pattern
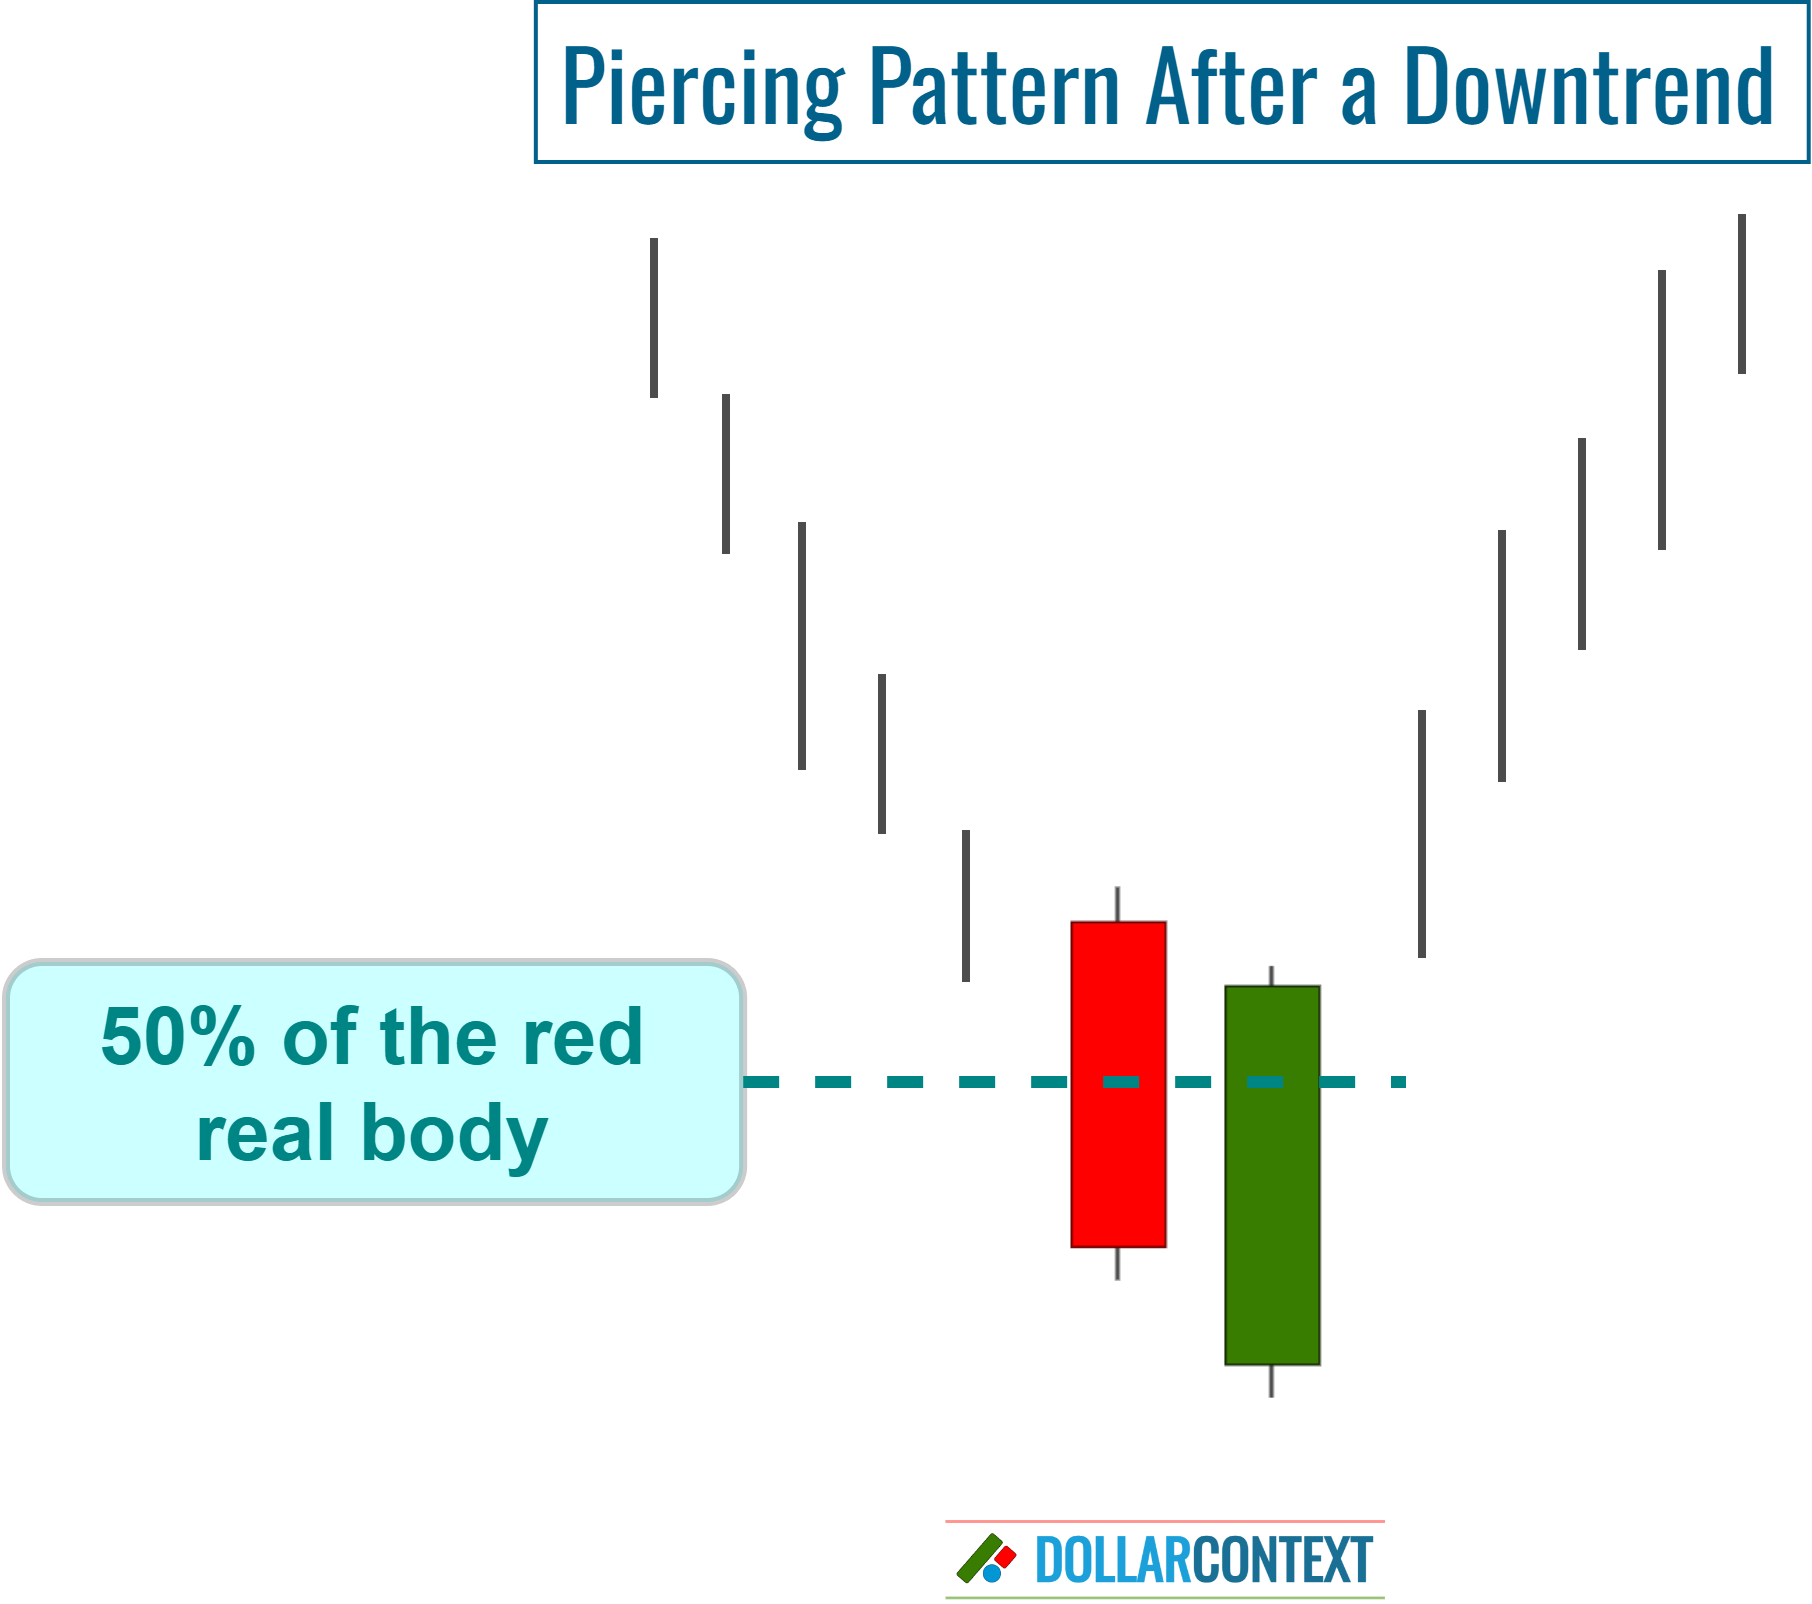
A piercing pattern is a two-candle combination that occurs at the end of a downtrend, signaling a potential bullish reversal.
This article is part of the Piercing Pattern candlestick tutorial series. For the complete guide, see the Piercing Pattern — Complete Guide.
In Japanese candlestick charting, the piercing pattern is a two-candle combination that occurs at the end of a downtrend. It can be recognized by the following attributes:
- First Candle: The first session is characterized by a relatively long bearish (red or black) candlestick, which suggests a continuation of the existing downtrend.
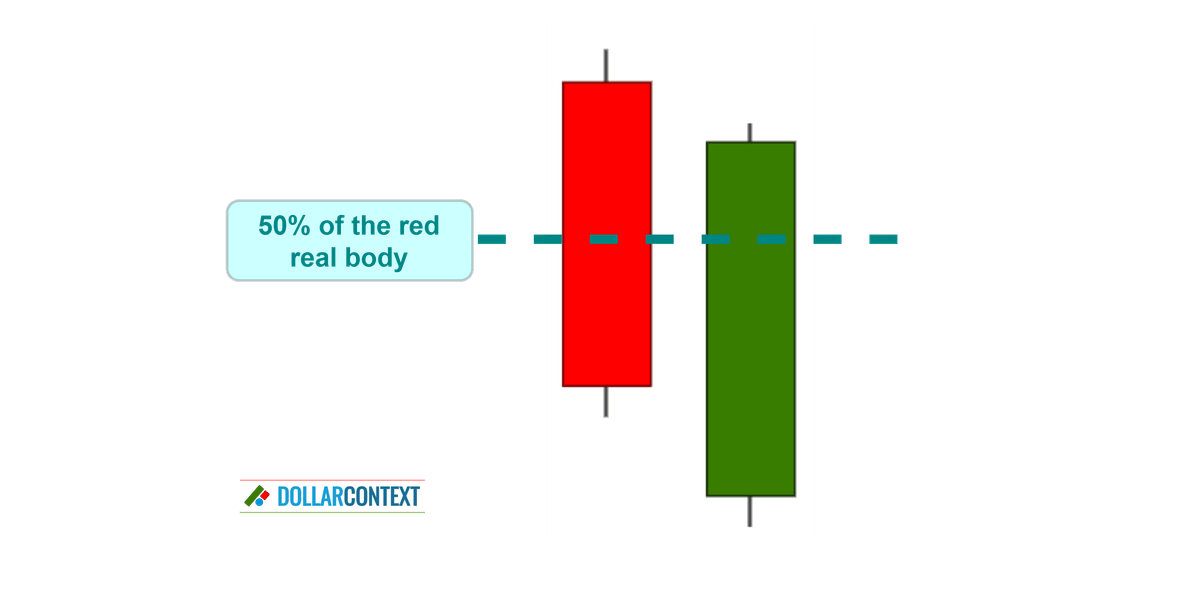
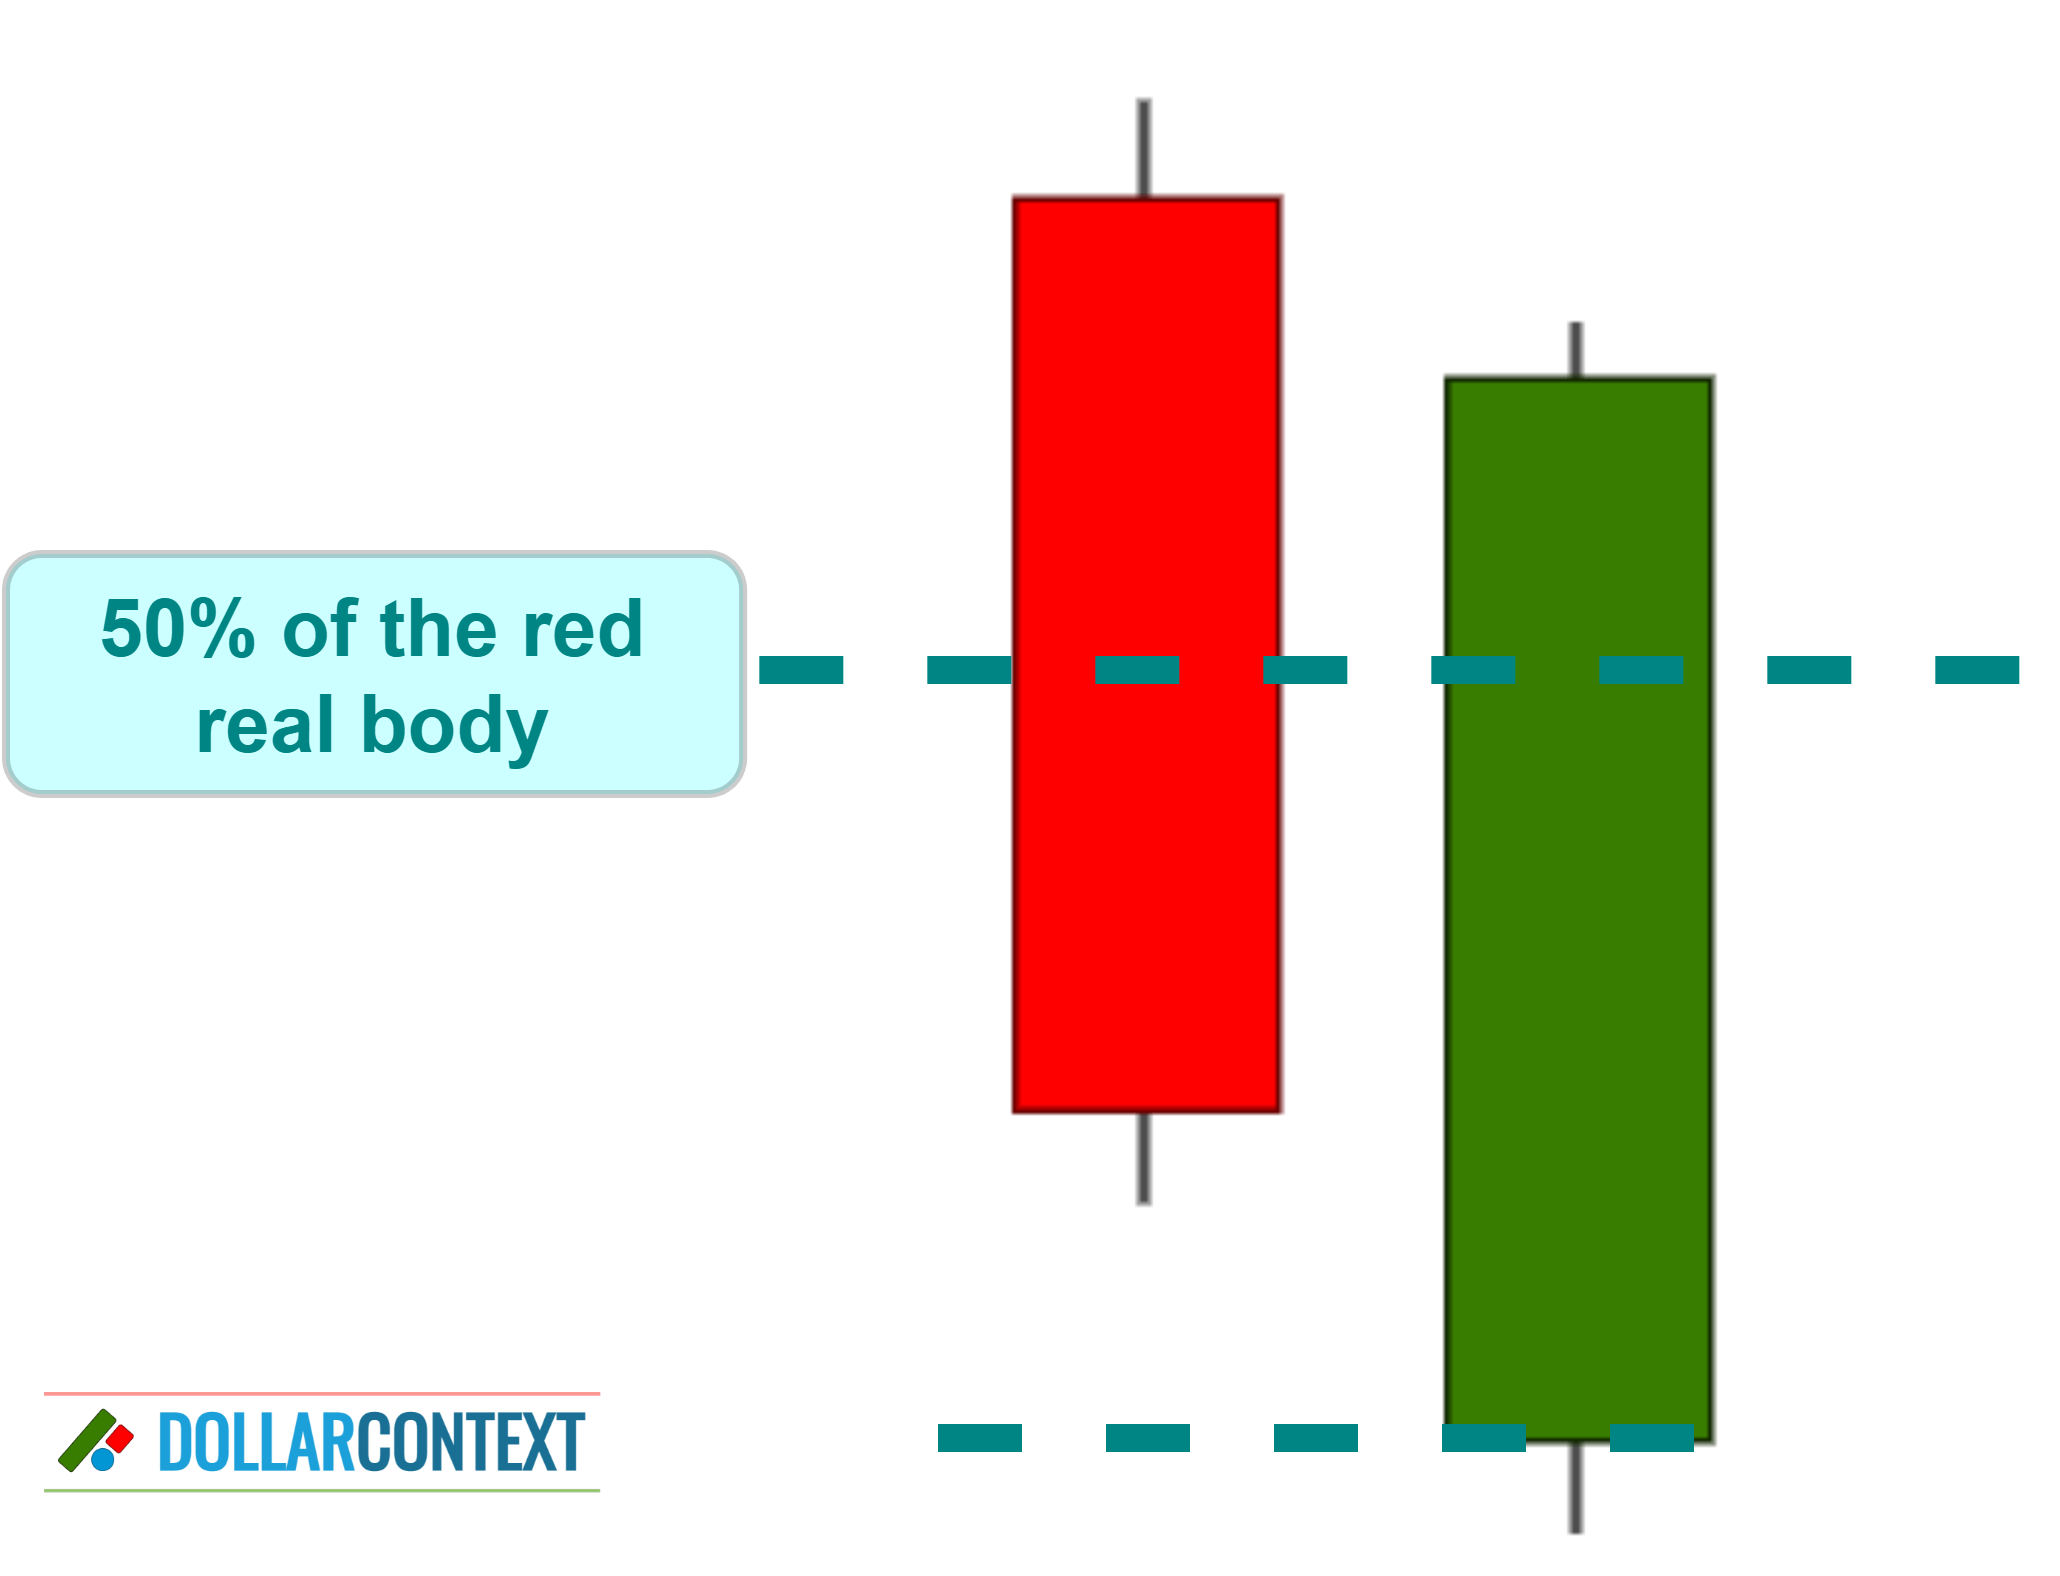
- Second Candle: The second candle starts with a bearish gap down. That means the stock opens below the closing price of the first one. However, throughout the second session, the price reverses its direction and starts to move upwards, closing well into the prior candle. As a general rule, it should push (pierce) more than halfway into the black candlestick's body, but not exceed the opening price of session 1.
- Previous Trend: This pattern is a reversal indicator, and to be meaningful, it should emerge following a steep or prolonged downward trend.
The piercing pattern is essentially the inverse of a dark cloud cover.
For a formation like the piercing pattern, the more significant the gap down on session 2 and the higher the upward move into the session 1 body, the stronger the reversal signal. Psychologically, a piercing pattern indicates aggressive buying at lower levels.
For an ideal piercing pattern, the second session should open below the lows of the preceding red or black candle.
When assessing the bullish implications of a piercing pattern, the surrounding context in which it appears is crucial. The pattern's strength as a bullish indicator is reinforced by these factors:
- The piercing pattern arises near a major support zone.
- It is supported by other preceding or succeeding bullish candlestick patterns.
- The size of the two candles that make up the piercing pattern becomes significant when contrasted with the previous sessions.
- The pattern surfaces following an extremely oversold market.
The more of these conditions are fulfilled, the greater the importance of the piercing pattern as a bullish signal.
The price range of a piercing pattern becomes support. This area can serve as your stop-loss when using a piercing pattern strategy.
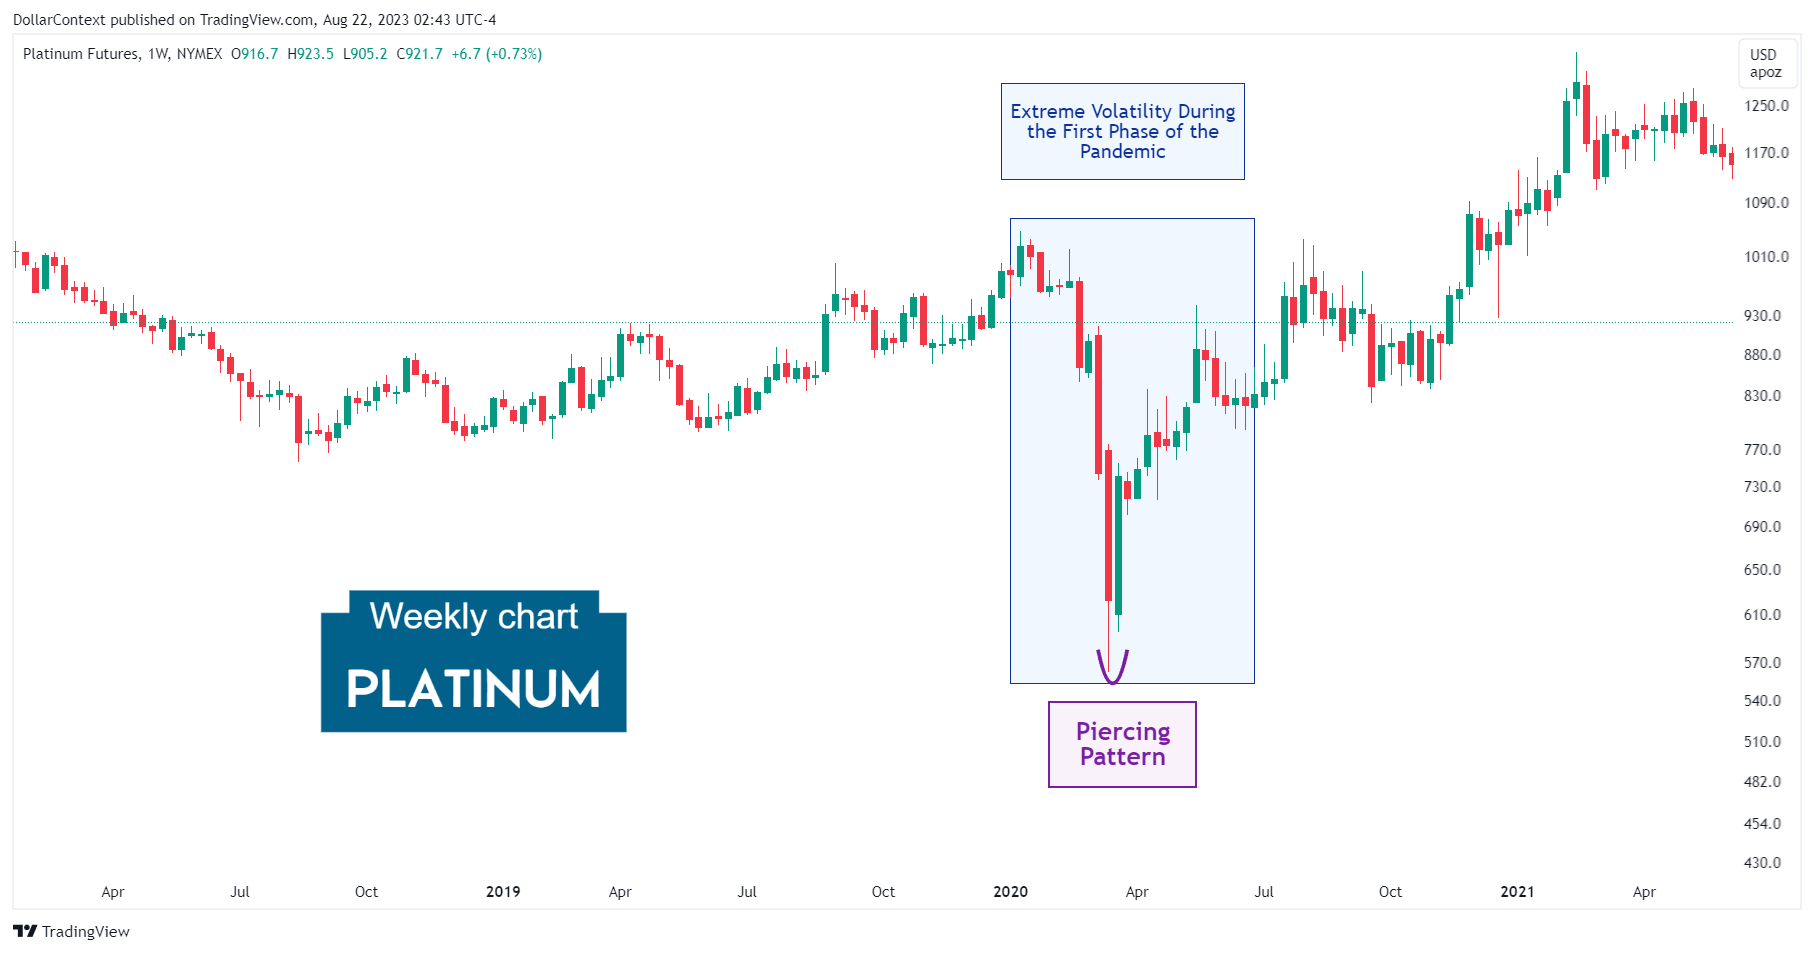
The chart below shows a piercing pattern exhibited by platinum prices in March 2020. Despite not being a perfect piercing pattern (the opening of the second session didn't fall below the lowest point of the first session), it underscores the significance of an extremely oversold market when evaluating the potential bullish momentum of this pattern.