Using the Piercing Pattern to Identify Support
The price range associated with a piercing pattern frequently evolves into a support area.
This article is part of the Piercing Pattern candlestick tutorial series. For the complete guide, see the Piercing Pattern — Complete Guide.
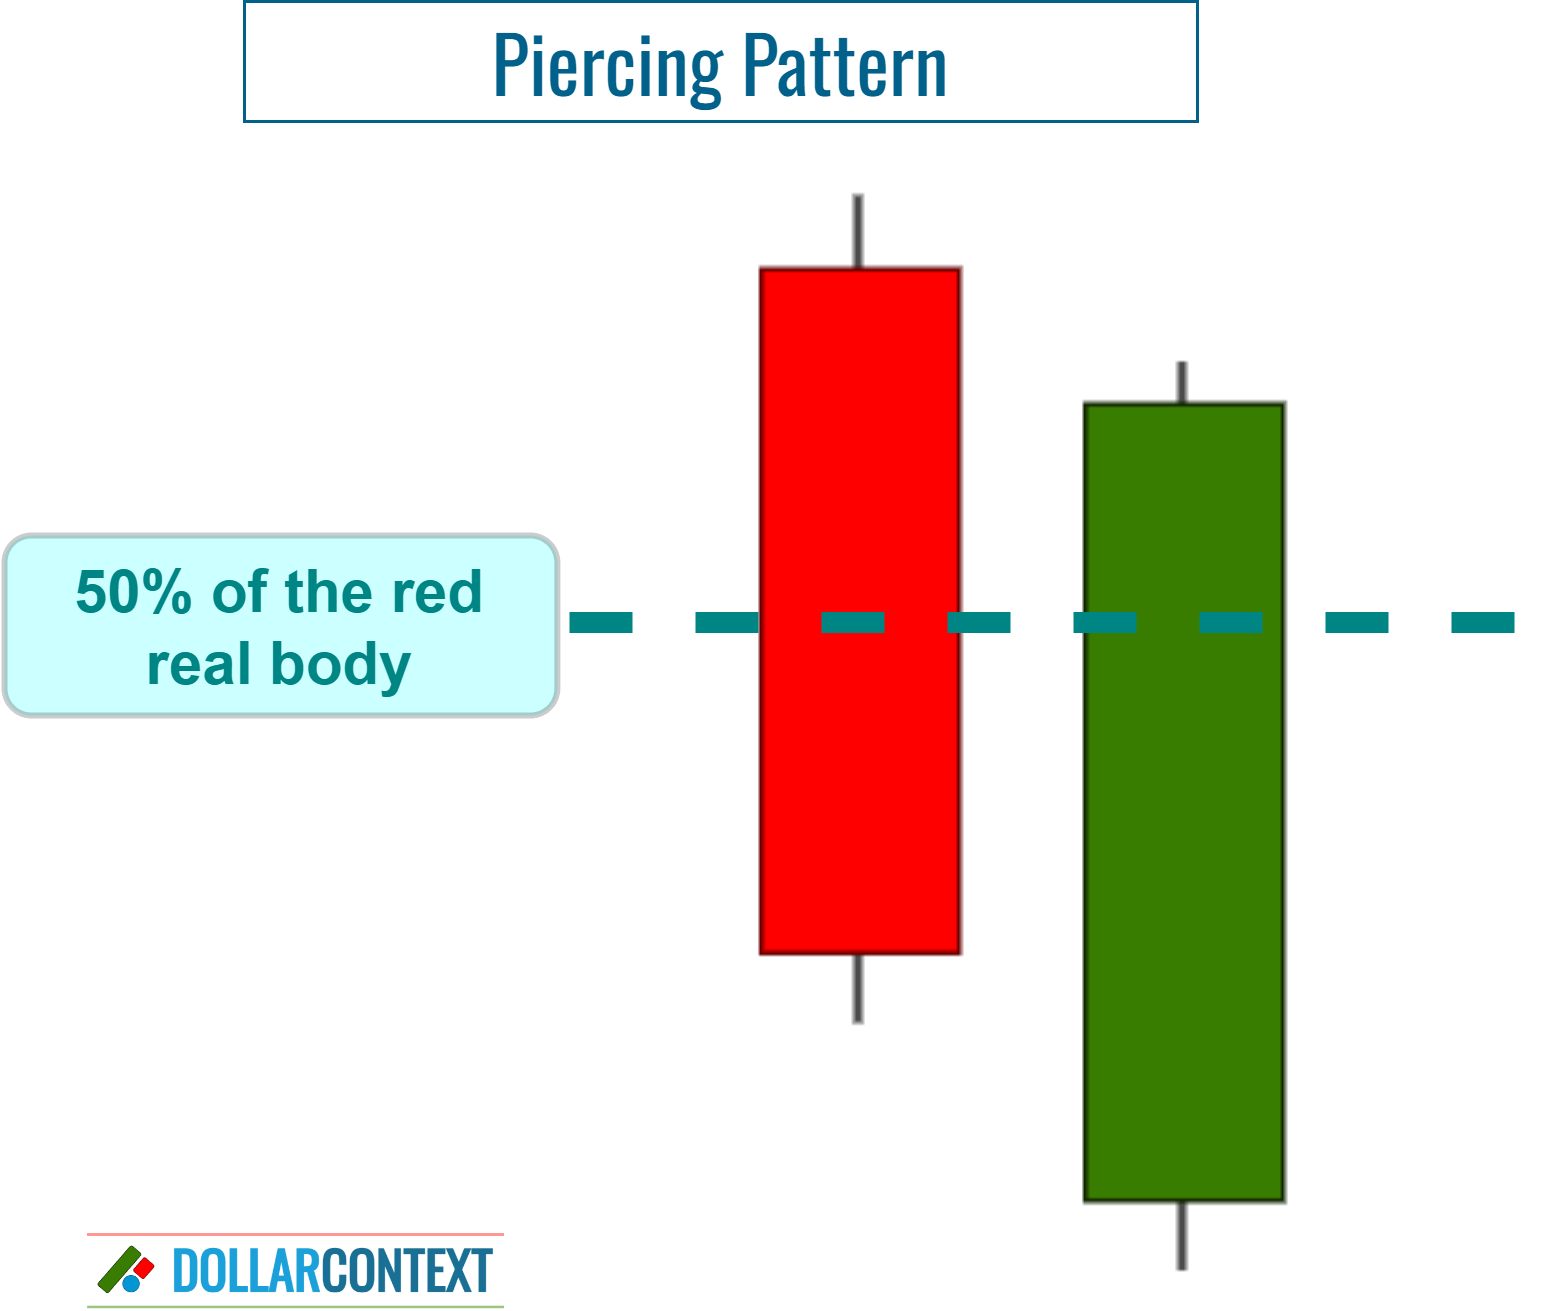
A piercing pattern is a two-candle formation in candlestick analysis. Typically occurring after a downtrend, the first session features a long red (or black) candle, signaling continued bearishness. However, the second day starts with a gap down but closes significantly above the midpoint of the first day's candle, suggesting a potential bullish reversal. This pattern indicates growing buyer interest.
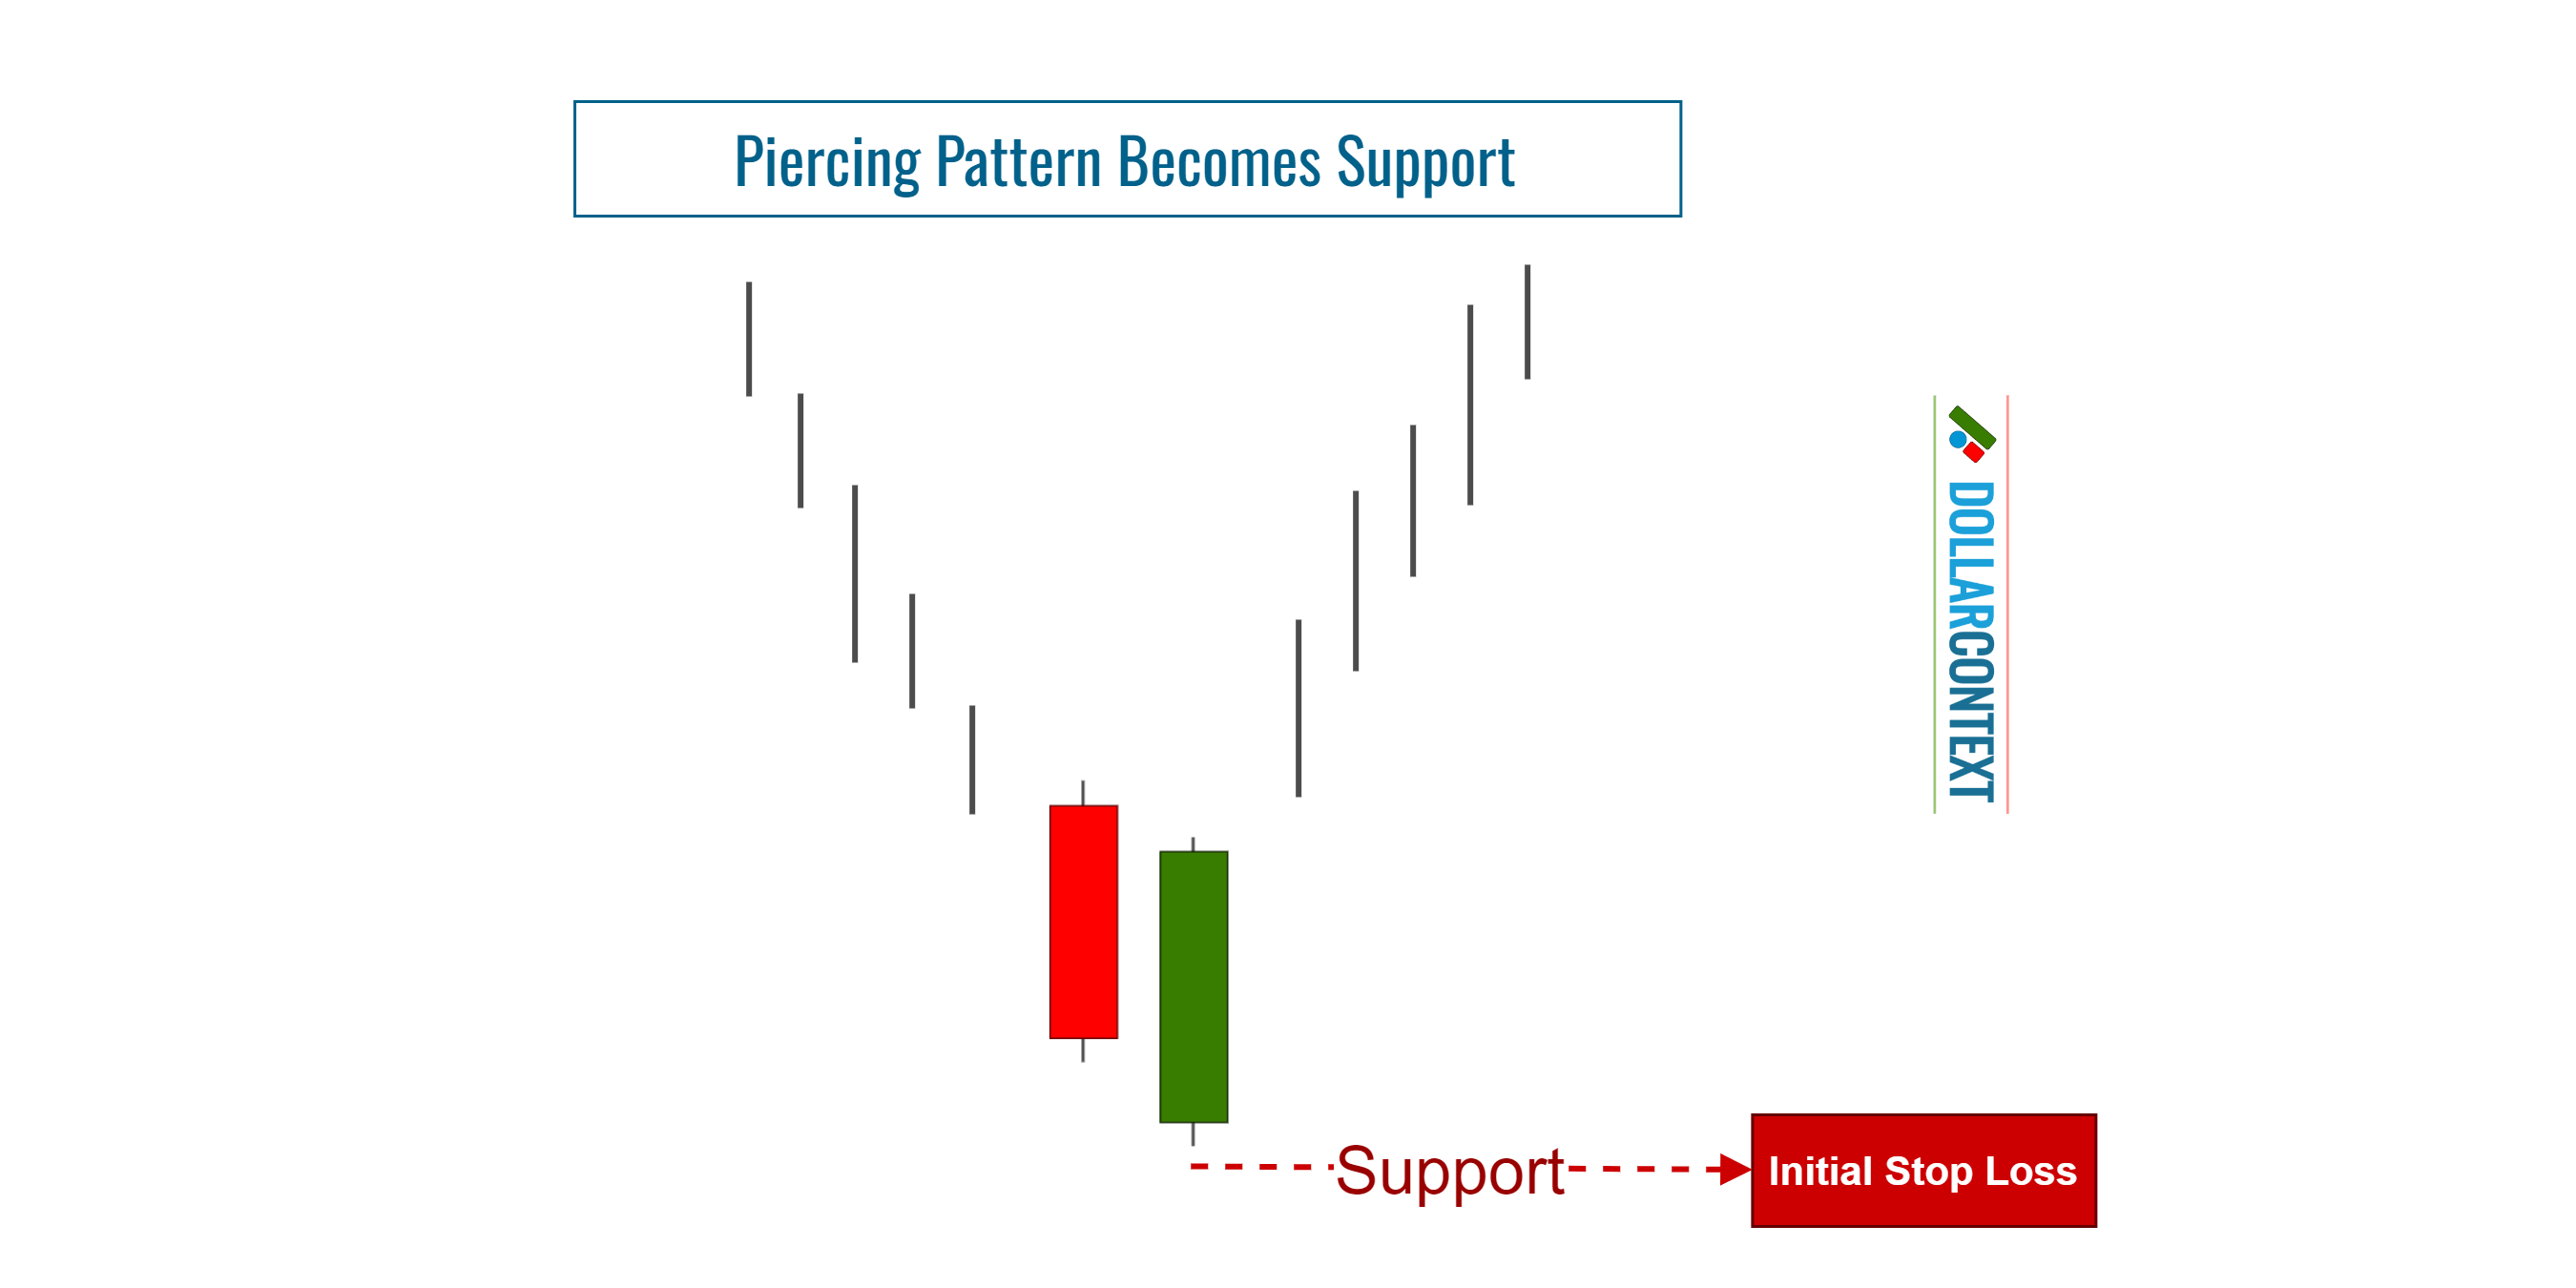
The price range associated with a piercing pattern frequently evolves into a support area. Notably, the lowest point of the two-candle formation either creates or reinforces a support level. Within this framework, one can distinguish between two different situations:
- If the piercing pattern surfaces within a previously established support area, it reinforces this support.
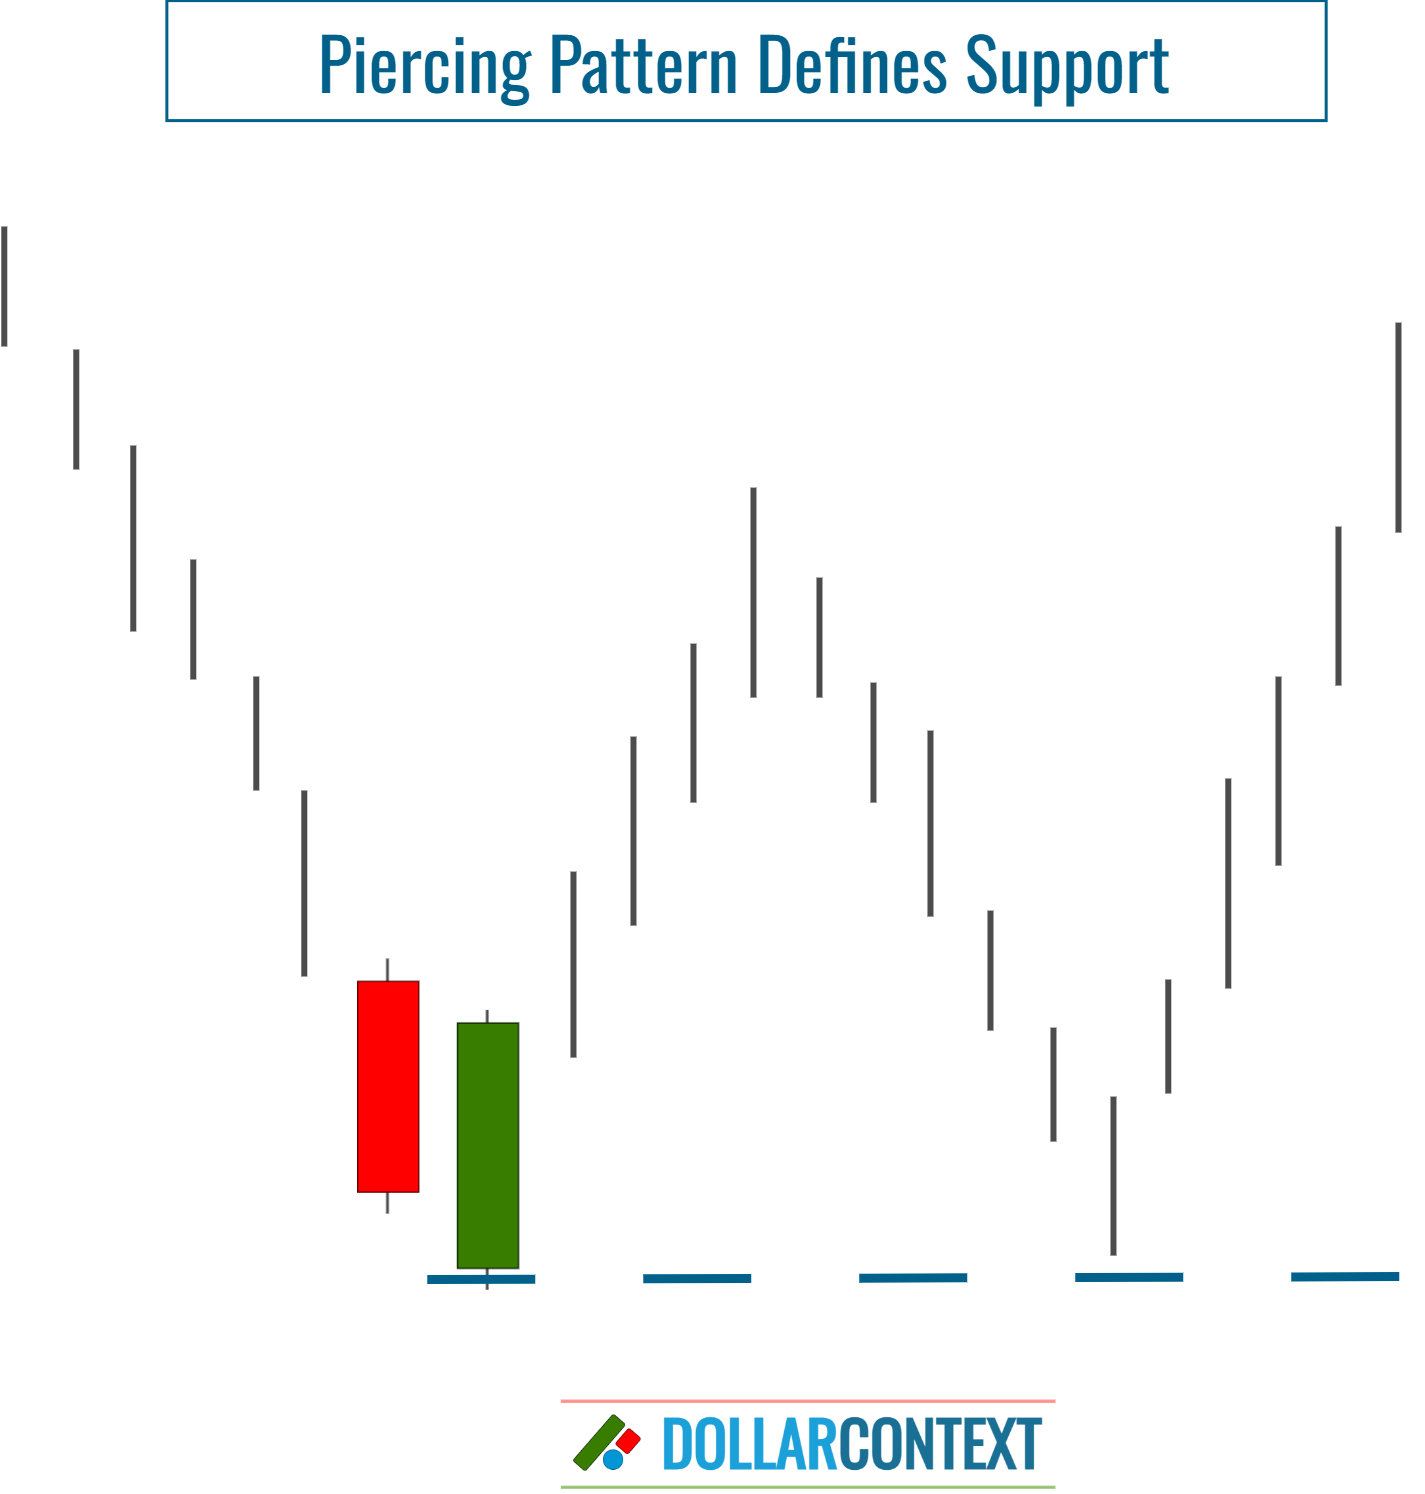
- If a piercing pattern emerges at a new low, it defines a new support zone.
1. Piercing Pattern Validates Support
If this formation appears in a previously identified support zone, the piercing pattern reinforces the reliability of that support, raising the chances of a favorable trend reversal.
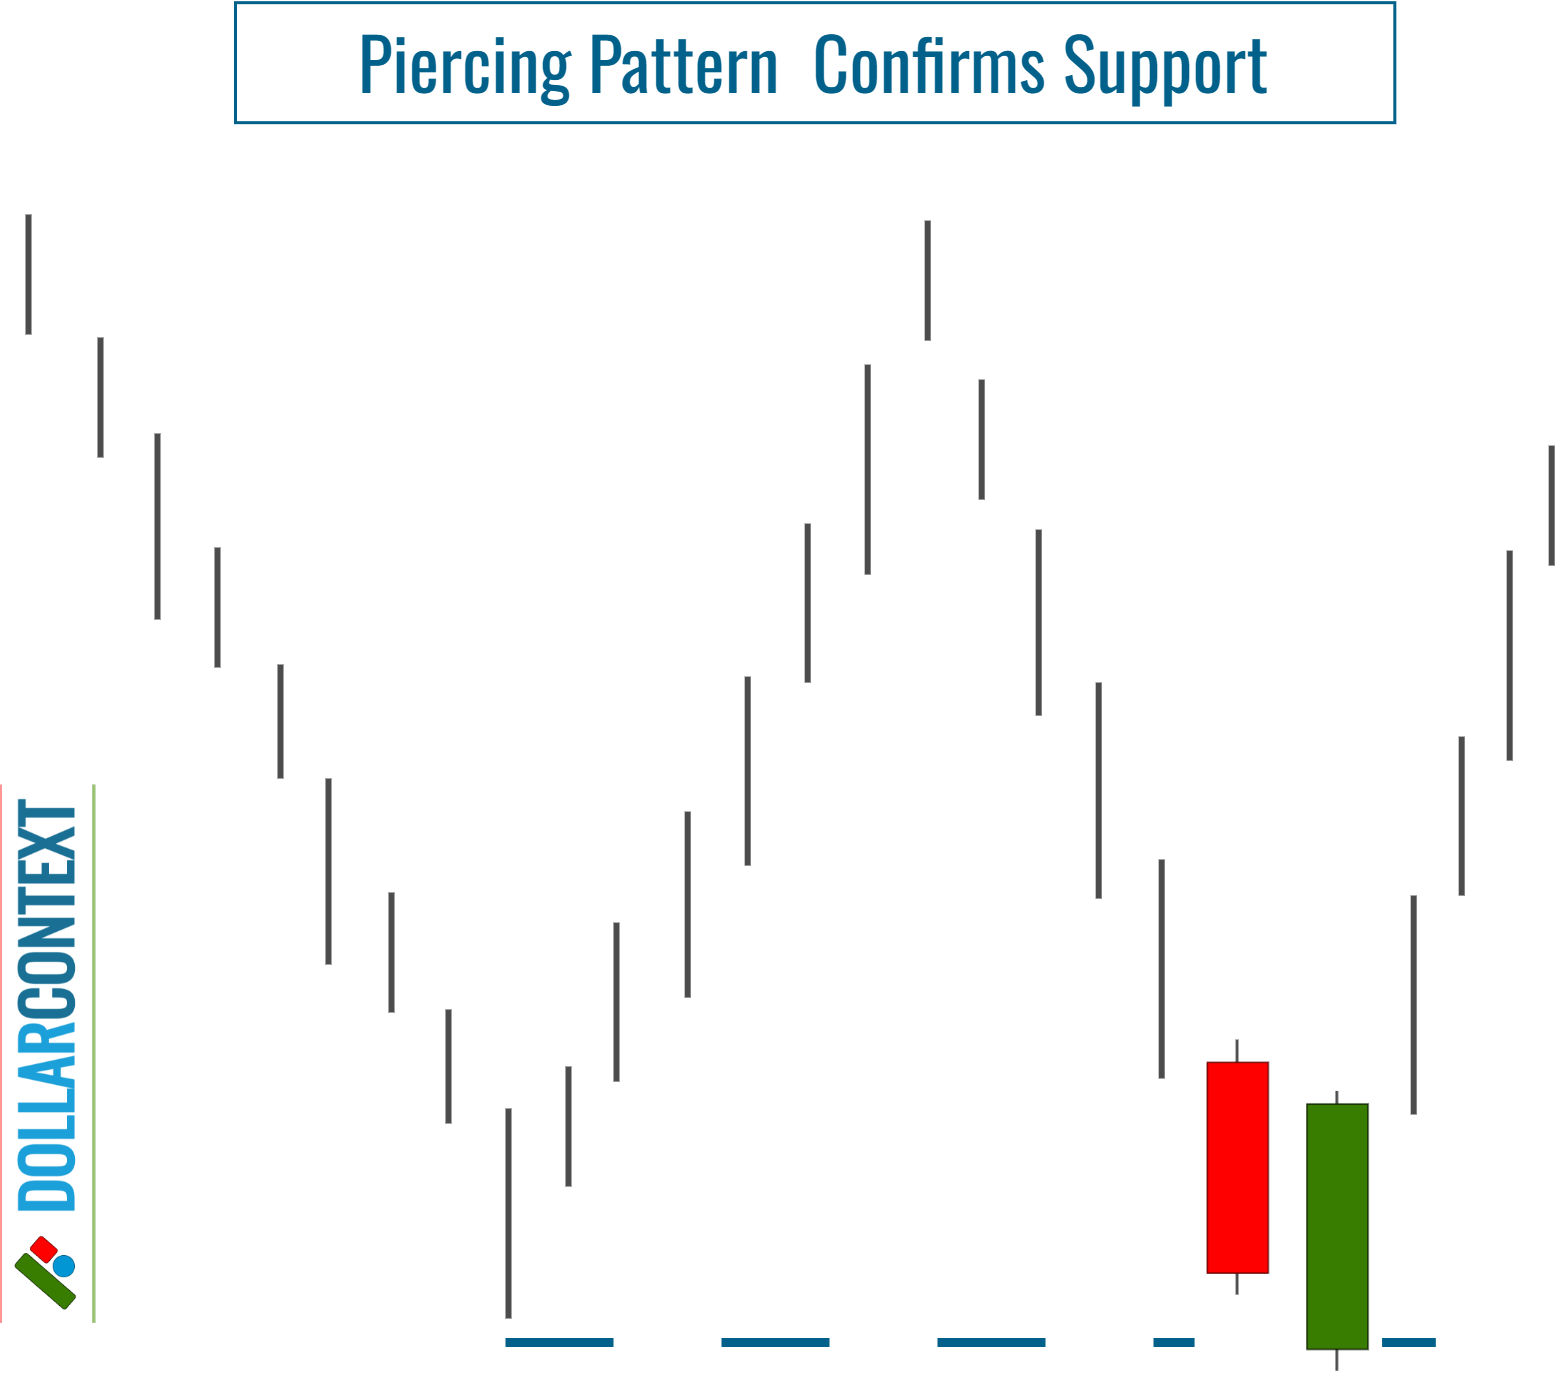
Keep in mind that a piercing pattern psychologically reflects a shift in market sentiment, and therefore a reversal of the previous bearish trend.
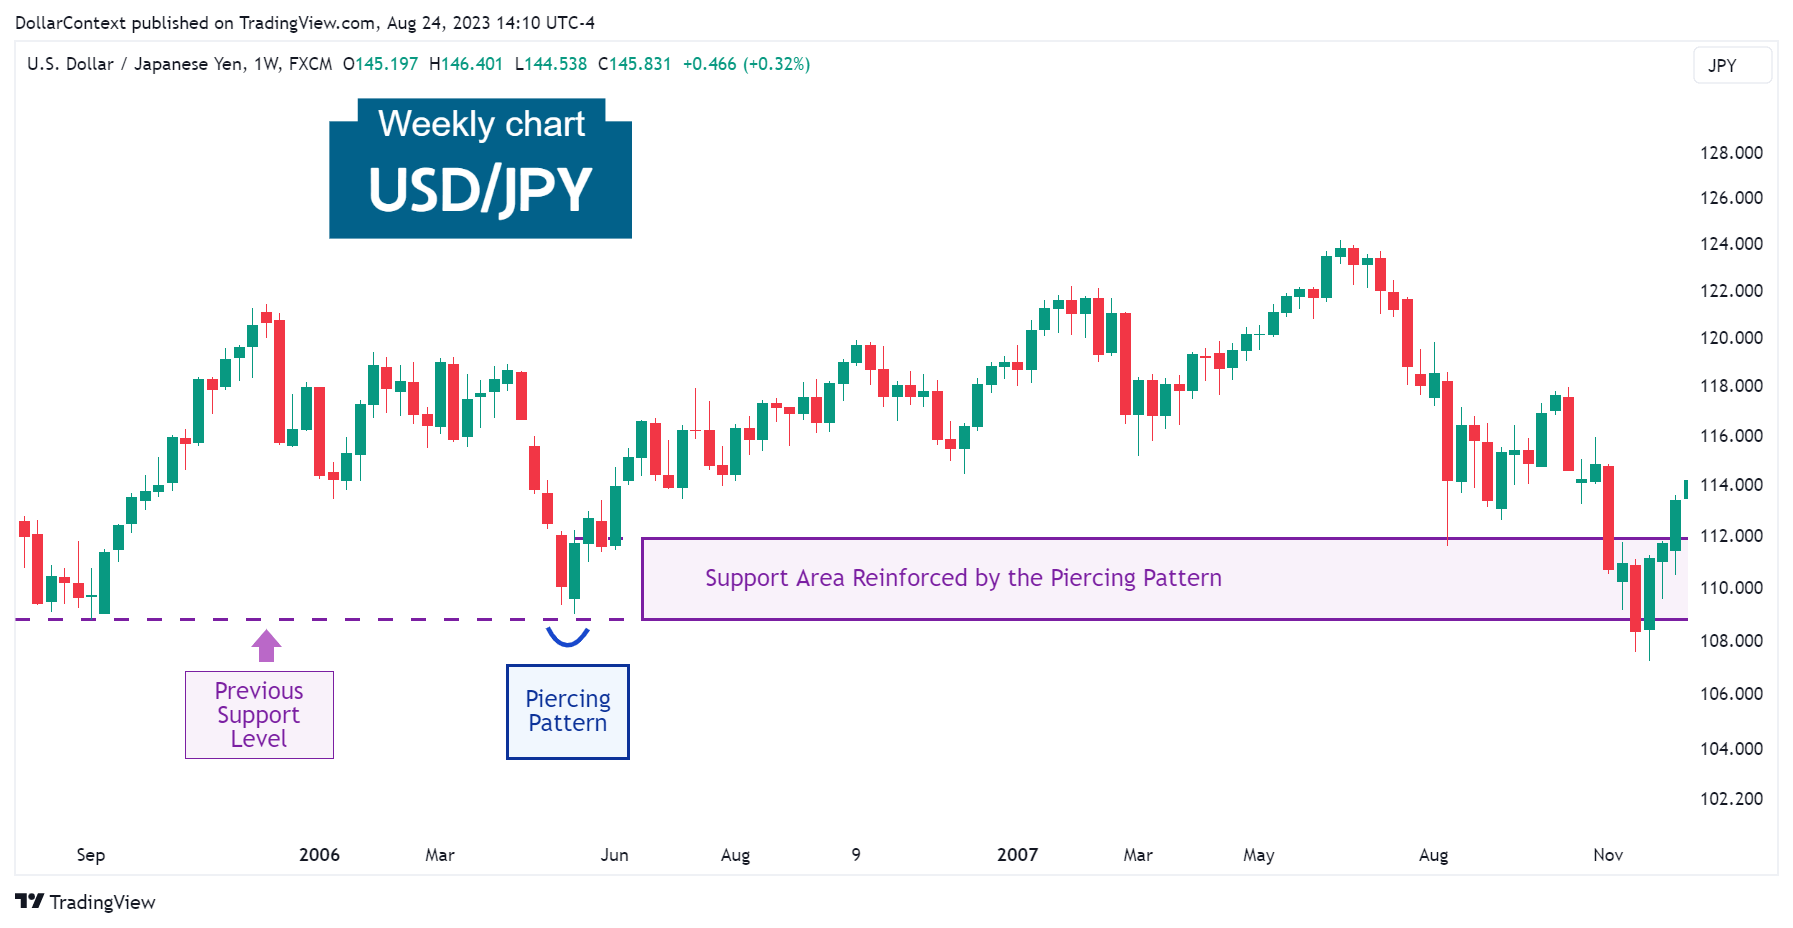
The example below demonstrates how the USD/JPY market validated a prior support level by showcasing a piercing pattern close to that zone.
2. Piercing Pattern Signals New Support
If the piercing pattern sets a new low, it creates a new support area, which might be tested in the future.
3. Breakout of the Support Level
When acting on a piercing pattern to open a position, it's important to have a defined price threshold where you reassess your initial plan. This can be the stop-loss of your piercing pattern strategy.
If a session concludes significantly below the support established by a piercing pattern, the market will probably continue its downward trajectory. However, as detailed in the following section, this is not always the case.
4. False Breakouts
Breaking a support level is commonly viewed as a potential trading cue, indicating that the price might persist in the breakout's direction. However, markets sometimes challenge these expectations. Rather than continuing the momentum, they might reverse, moving back to the former range.
A false breakout to the downside is also known as a spring. To reduce the risk of getting stopped out by a spring when using a piercing pattern approach, consider these guidelines:
- Set your stop-loss according to the session's closing price, instead of depending on intra-session price movements.
- Think about adding a buffer to your initial stop-loss setting.
- The authenticity of a breakout can diminish significantly if additional bullish candlestick formations appear near the piercing pattern.


