Shooting Star Strategy: A Comprehensive Tutorial
Today, we're going to explore a crucial component in the realm of Japanese candlestick analysis: the shooting star.
Today, we're going to explore a crucial component in the realm of Japanese candlestick analysis: the shooting star.
Before venturing into the detailed analysis of this pattern, it's important to underscore three key factors prevalent in the majority of candlestick signals, including the shooting star:
- They serve as reversal signals, suggesting the current trend may end, and an opposite trend could start. For a pattern like the shooting star, the signal always emerges after an uptrend.
- These patterns can be used across all timeframes, including minutes, hours, days, weeks, or months.
- They can be applied to any market where price data is available, including stocks, commodities, forex, cryptocurrencies, indices, and futures. This is because candlestick patterns are based on price action, which behaves consistently across markets.
Contents
1. The Shape of a Shooting Star
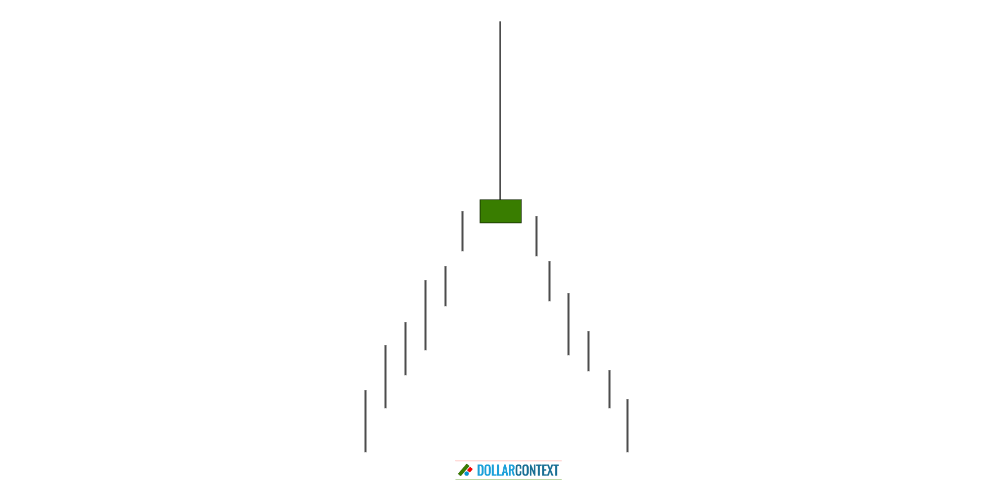
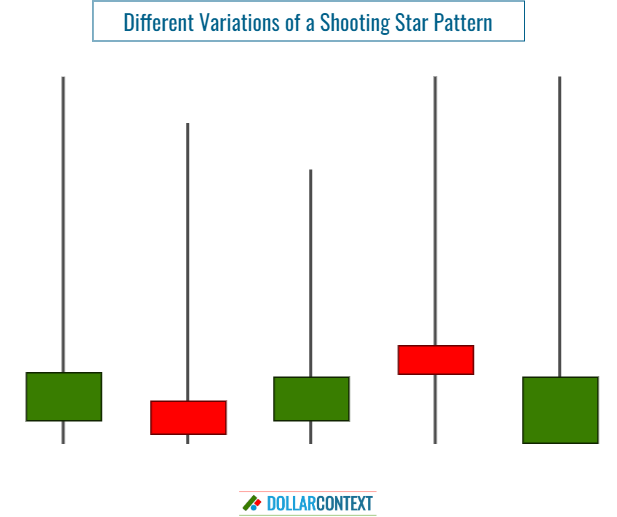
Visually, the shooting star can be easily identified. It's a single-candle pattern with the following attributes:
- Small Real Body: The shooting star candlestick features a petite real body situated at the lower part of the candle.
- The Color of the Real Body Is Not Critical: The body of a shooting star can manifest as either red (or black) or green (or white), although a red/black body tends to indicate a marginally more bearish sentiment.
- Pronounced Upper Shadow: The hallmark of a shooting star candle is a substantial upper shadow (or wick), at least three times the size of its real body.
- Minimal or Absent Lower Shadow: The shooting star candlestick should exhibit a tiny or non-existent lower shadow beneath its real body.
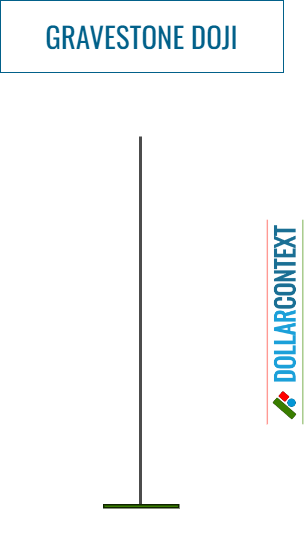
When the open, close, and low prices of a shooting star align or are in close proximity, the pattern is also known as gravestone doji.
2. Context
The surrounding context where a shooting star emerges is as critical as the shape of the candle itself. Thus, following a mature or steep uptrend, a shooting star serves as a reversal indicator, which can be used to:
- open short positions, or
- liquidate existing long positions in the market.

Generally, a shooting star appearing during a downtrend or a sideways movement holds no significance. However, when emerging at the top of a broad lateral range, it could indicate a retreat to the range's bottom (see example 6.2 in the last section.)
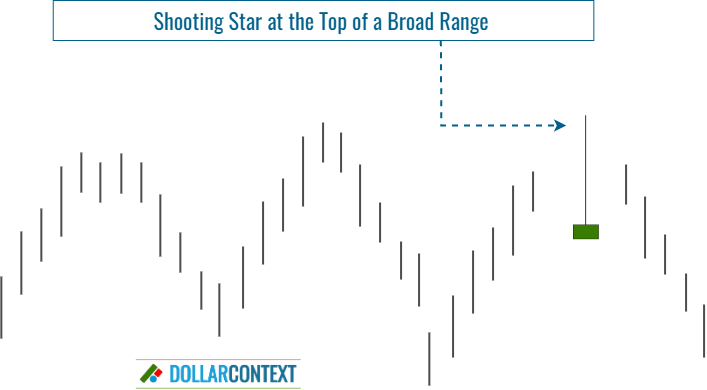
The likelihood of a reversal tends to increase in line with the length and/or steepness of the preceding trend. Why can a shooting star signal a reversal near the top of a range? Simply because it arises after an uptrend (on a microscale) within the context of a broad sideways movement on a more macroscale price action.
When considering the context in which a shooting star appears, the following factors are particularly important as well:
- Resistance Level: If the shooting star arises within a resistance zone, the bearish implications of the pattern intensify drastically (see examples 6.1 and 6.3 in the last section.)
- Additional Candlestick Patterns Reinforcing Each Other: The presence of additional candlestick patterns significantly enhances the likelihood of a trend reversal. (see example 6.3 in the final section.)
- Relative Size of the Shooting Star: The length of the upper shadow when compared to the size of the preceding candles is relevant. In this sense, a tiny shooting star is typically of no consequence.
- Overbought Market: The more a market leans towards being overbought, the higher the probability of a trend reversal taking place (see example 6.1.)
3. Psychology
Initially, during an uptrend (which is when a shooting star pattern emerges), traders are optimistic and continue to buy, driving prices higher. At the opening of the shooting star candle, this optimism continues as prices rise, creating a long upper shadow.
However, at some point during the session, sentiment starts to shift. Traders start to sell off their positions, driving the price back down towards the open. This selling pressure indicates uncertainty or even fear that the uptrend cannot continue.
By the end of the candle period, the price closes near its opening price, leaving a small real body and a long upper wick. It shows a clear shift from initial optimism to uncertainty or pessimism. This pattern is seen as a potential sign that the uptrend may be about to reverse, and can cause traders to take actions accordingly.
The extensive upper shadow of a shooting star psychologically signals the bulls' inability to maintain elevated prices, resulting in a price pullback to end near the day's low. This pattern conveys a shift in trader psychology from optimism to uncertainty and potentially to pessimism.
4. Stop-loss
The peak price of a shooting star becomes resistance. This level can serve as your starting point for setting a stop-loss after a shooting star surfaces.
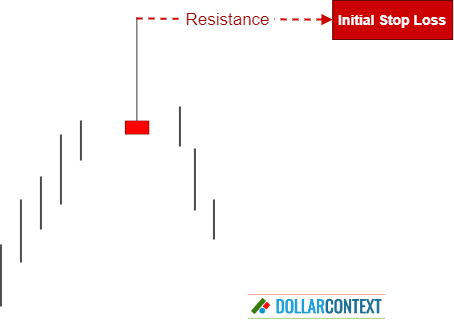
However, to prevent being stopped out during a volatile session or a false breakout, you should bear in mind two extra factors:
- You can add a buffer to avoid being impacted by false breakouts.
- Consider a stop on a close above the highs of the shooting star, which is generally recommended.
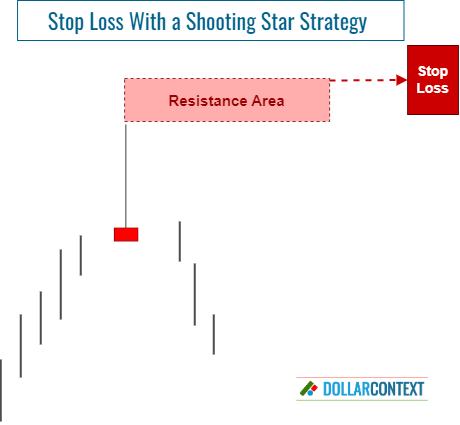
As your trade unfolds, you might spot more candlestick patterns that bolster the initial resistance zone set by the shooting star. In this case, it might be necessary to realign your stop-loss to the peak level of all these patterns, the shooting star included.
5. Profit Target
Typically, candlestick patterns provide signals for trend reversals and entry points, but they don't specifically suggest levels for taking profits. To determine these, you'll need to employ different strategies, like traditional chart patterns, Fibonacci retracements, or moving averages.
Having said that, if you're in a profitable short position and a fresh candlestick pattern emerges indicating a potential shift in the opposite direction, you could consider this new pattern as a cue to close the trade.
6. Examples
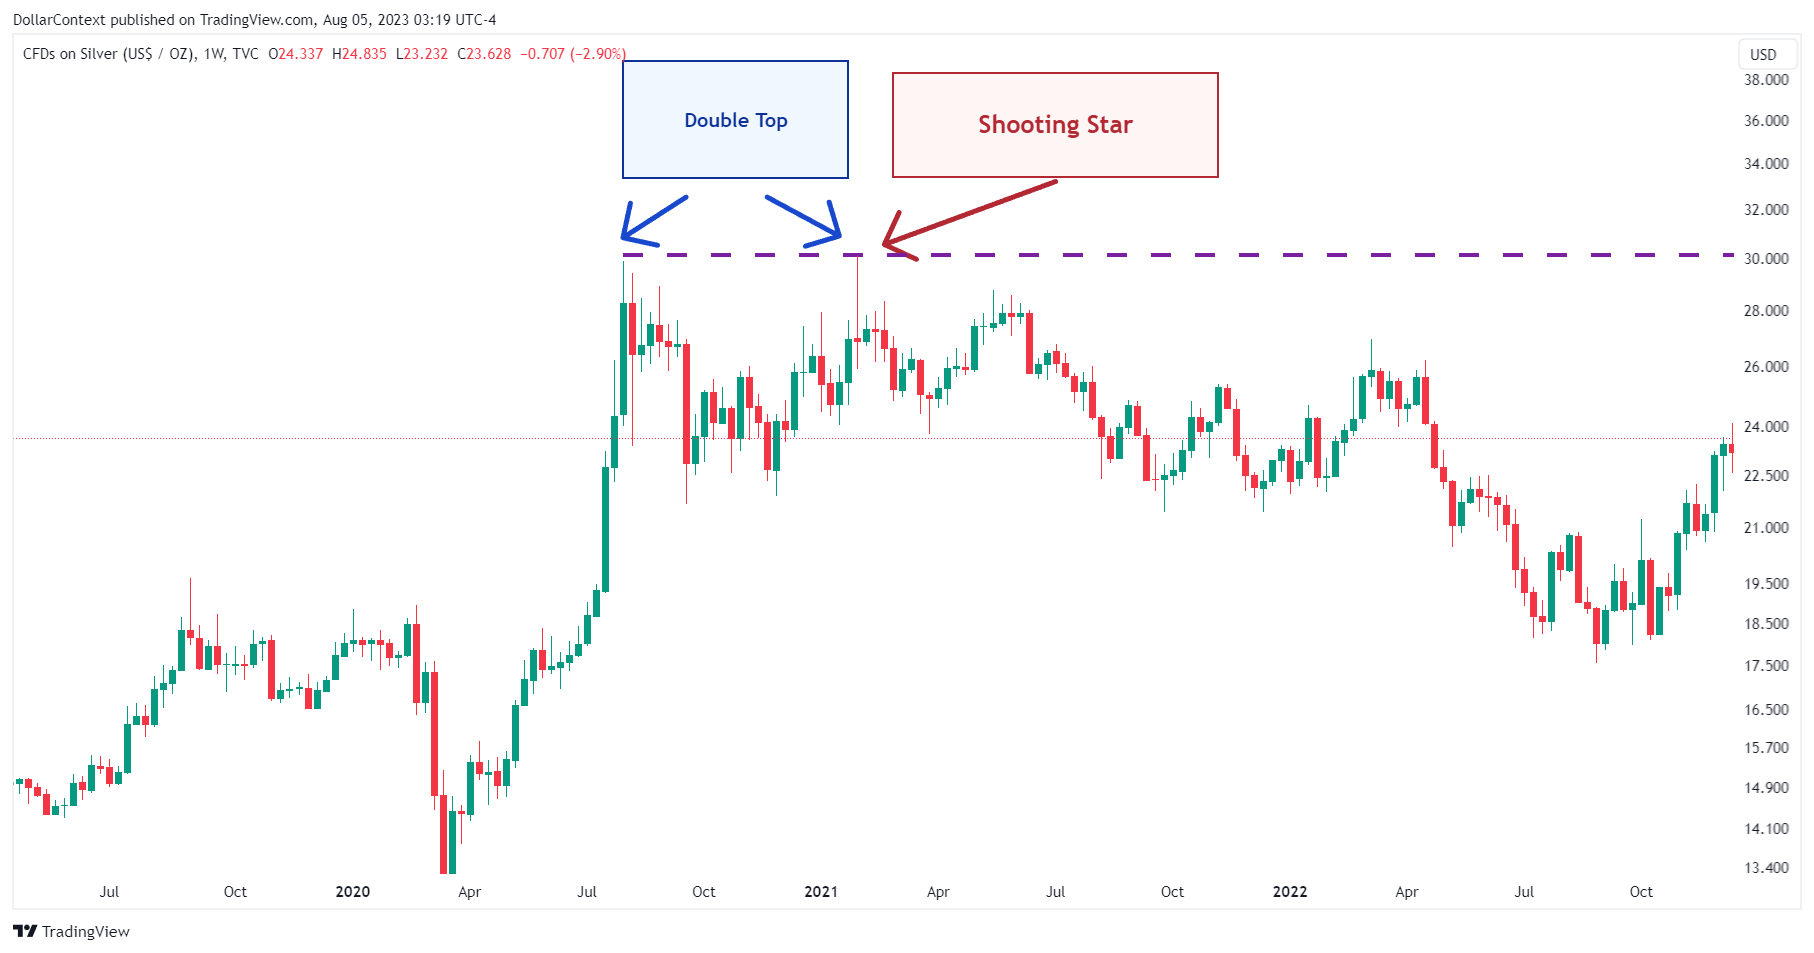
6.1 Silver - Weekly Chart
In February 2021, the silver market displayed a shooting star at a key resistance level. Note the extremely lengthy upper shadow as well as the effectiveness of this pattern as a reversal signal.
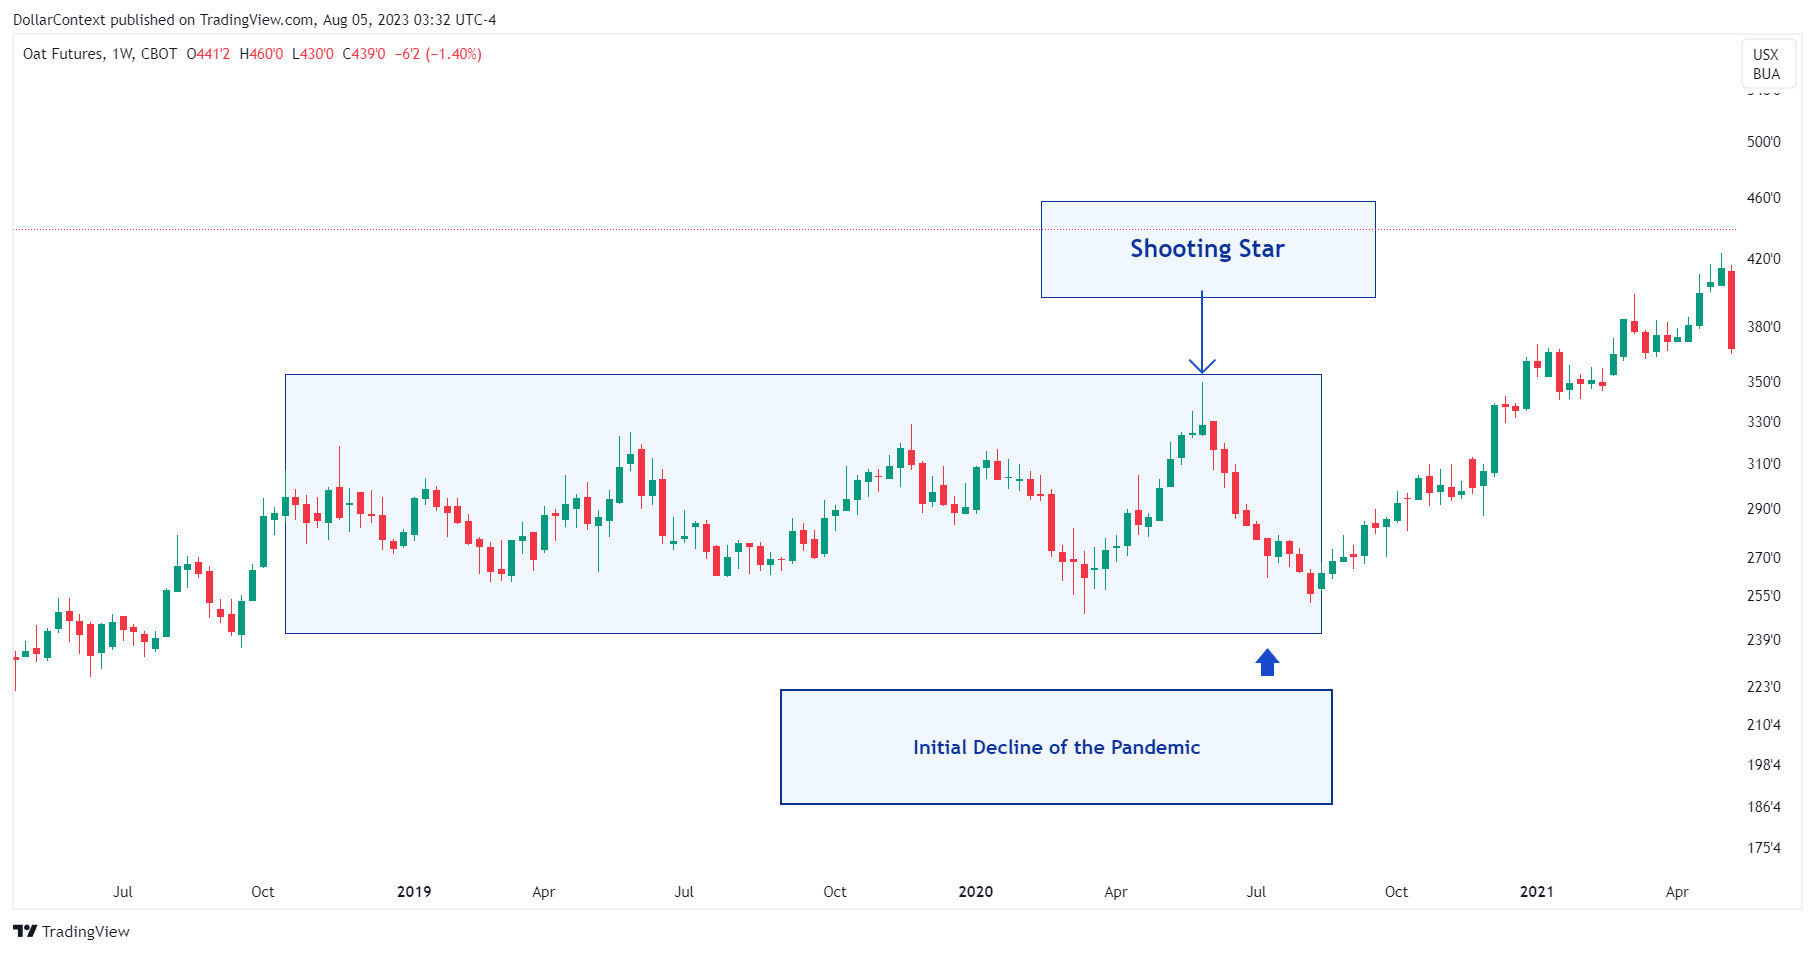
6.2 Oats - Weekly Chart
This example shows how a shooting star appearing at the peak of a sideways movement can serve as a trading signal, provided the range is wide enough to permit a substantial downward shift. Notice how the downtrend comes to a stop at the range's lower boundary.
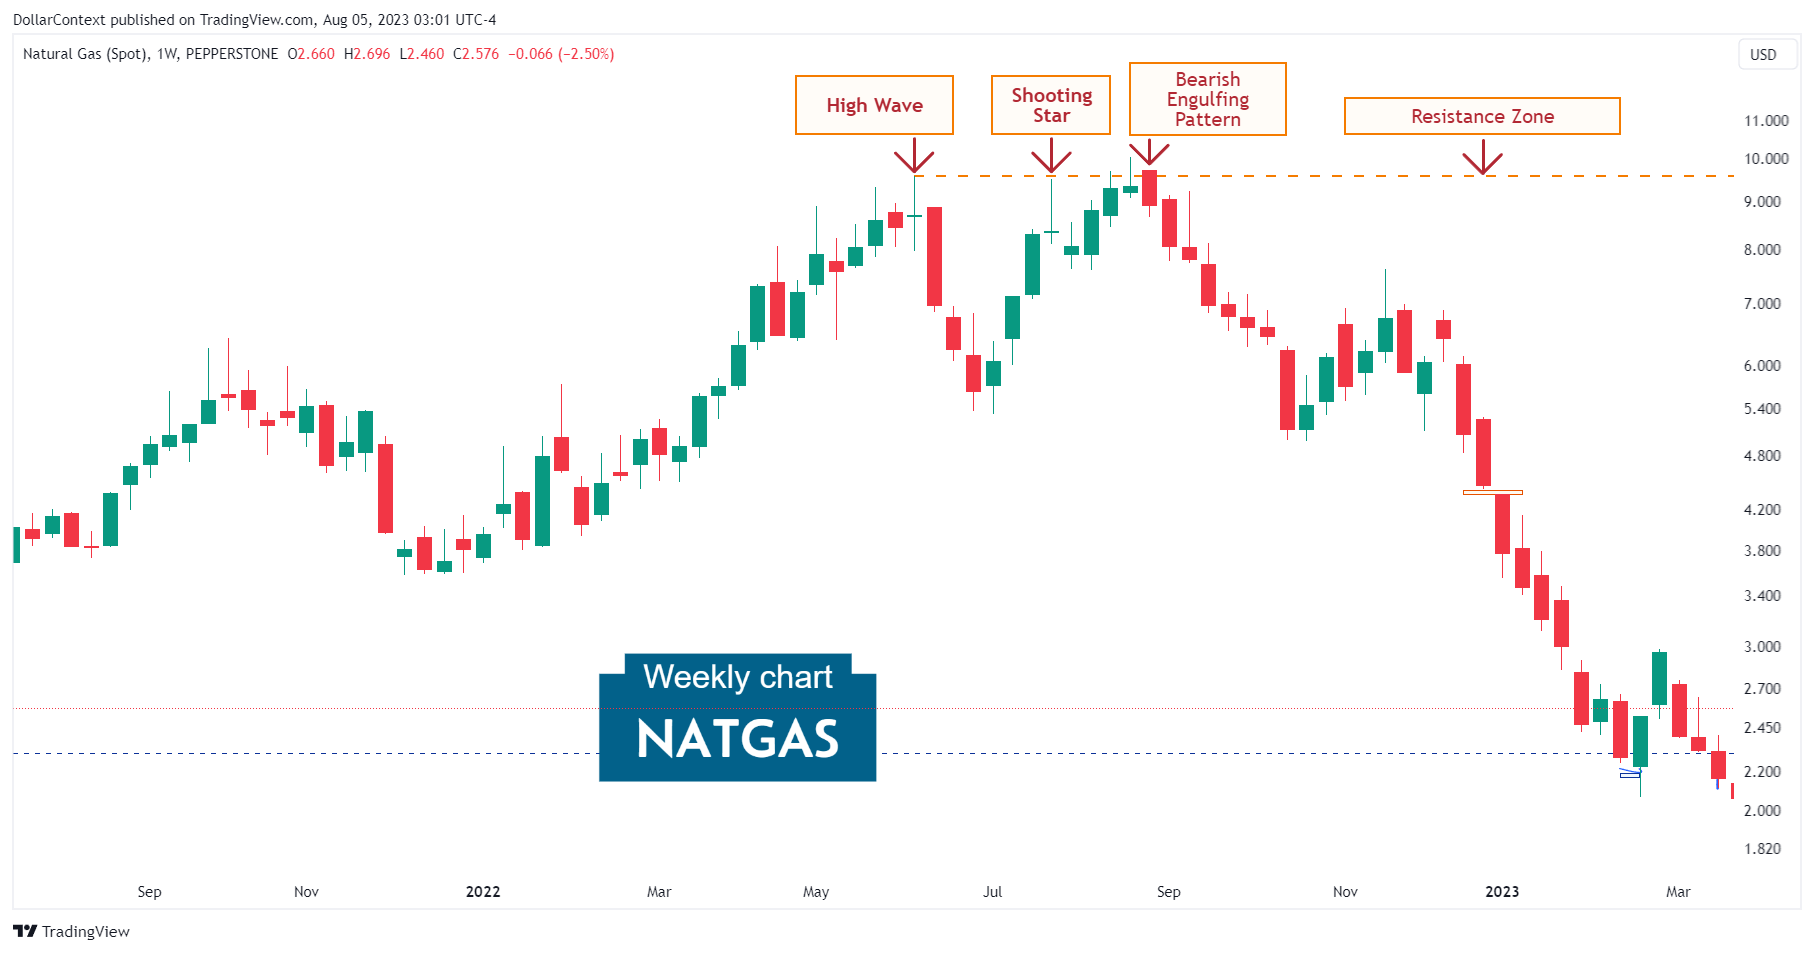
6.3 Natural Gas - Weekly Chart
The following chart illustrates how the clustering of candlestick patterns within the same resistance zone strengthens both the resistance area itself and the bearish implications of the group of candlestick patterns.
In mid-2022, Natural Gas futures exhibited three successive candlestick patterns (a high wave, a shooting star, and a bearish engulfing pattern), all of which indicated a probable reversal to the downside. Note the dramatic steepness and severity of the subsequent downtrend, where prices fell around 80 percent in less than a year.
6.4 More Examples
- Case Study 0010: Evening Star and Shooting Star Patterns Yield Immediate Results (AUD/USD)
- Case Study 0014: Shooting Star and Dark Cloud Cover at a Major Resistance Level (Natural Gas)
- Case Study 0015: Dark Cloud Cover and Shooting Star Herald the End of a Correction (S&P 500)
- Case Study 0019: Long Upper Shadow and Shooting Star (AUD/USD)


