The Psychology Behind a Shooting Star
A shooting star symbolizes a psychological battle between bulls and bears and the inability of the buyers to sustain the high prices.


Today, we're set to unravel an essential feature of candlestick charts, the psychological implications behind a shooting star pattern. This single-candle formation gains its importance when it surfaces after a rising trend or a situation where the market is overbought.
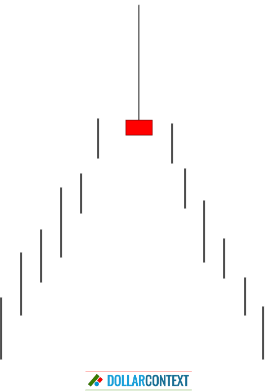
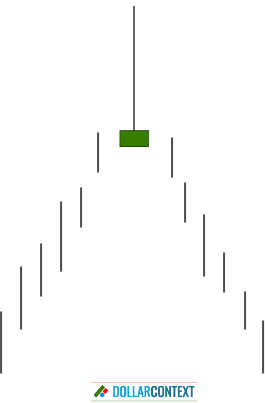
The shooting star pattern consists of a small real body near the lower end of the trading range with a long upper shadow and little or no lower shadow. This indicates that during the trading period, buyers were initially able to push prices up, often to new highs, reflecting a continuation of bullish sentiment. However, by the close of trading, sellers have managed to drive prices down to near the opening level, thereby showing a shift in market sentiment.
A shooting star, therefore, symbolizes a psychological battle between bulls (buyers) and bears (sellers). The inability of the buyers to sustain the high prices and the subsequent takeover by the sellers is a hint that the bullish momentum is waning, and the bears are gaining strength. This can signal traders that a reversal from an uptrend to a downtrend may be on the horizon, hence the need to possibly adjust trading strategies.
The real body of a shooting star can be either white/green or black/red.
The shape of a shooting star, however, is equally important as the context in which it emerges. This candle line is a reversal indicator, and as such it should arise after an advancing market.
Given that this pattern indicates a transition in market sentiment, the peak reached by a shooting star acts as resistance.
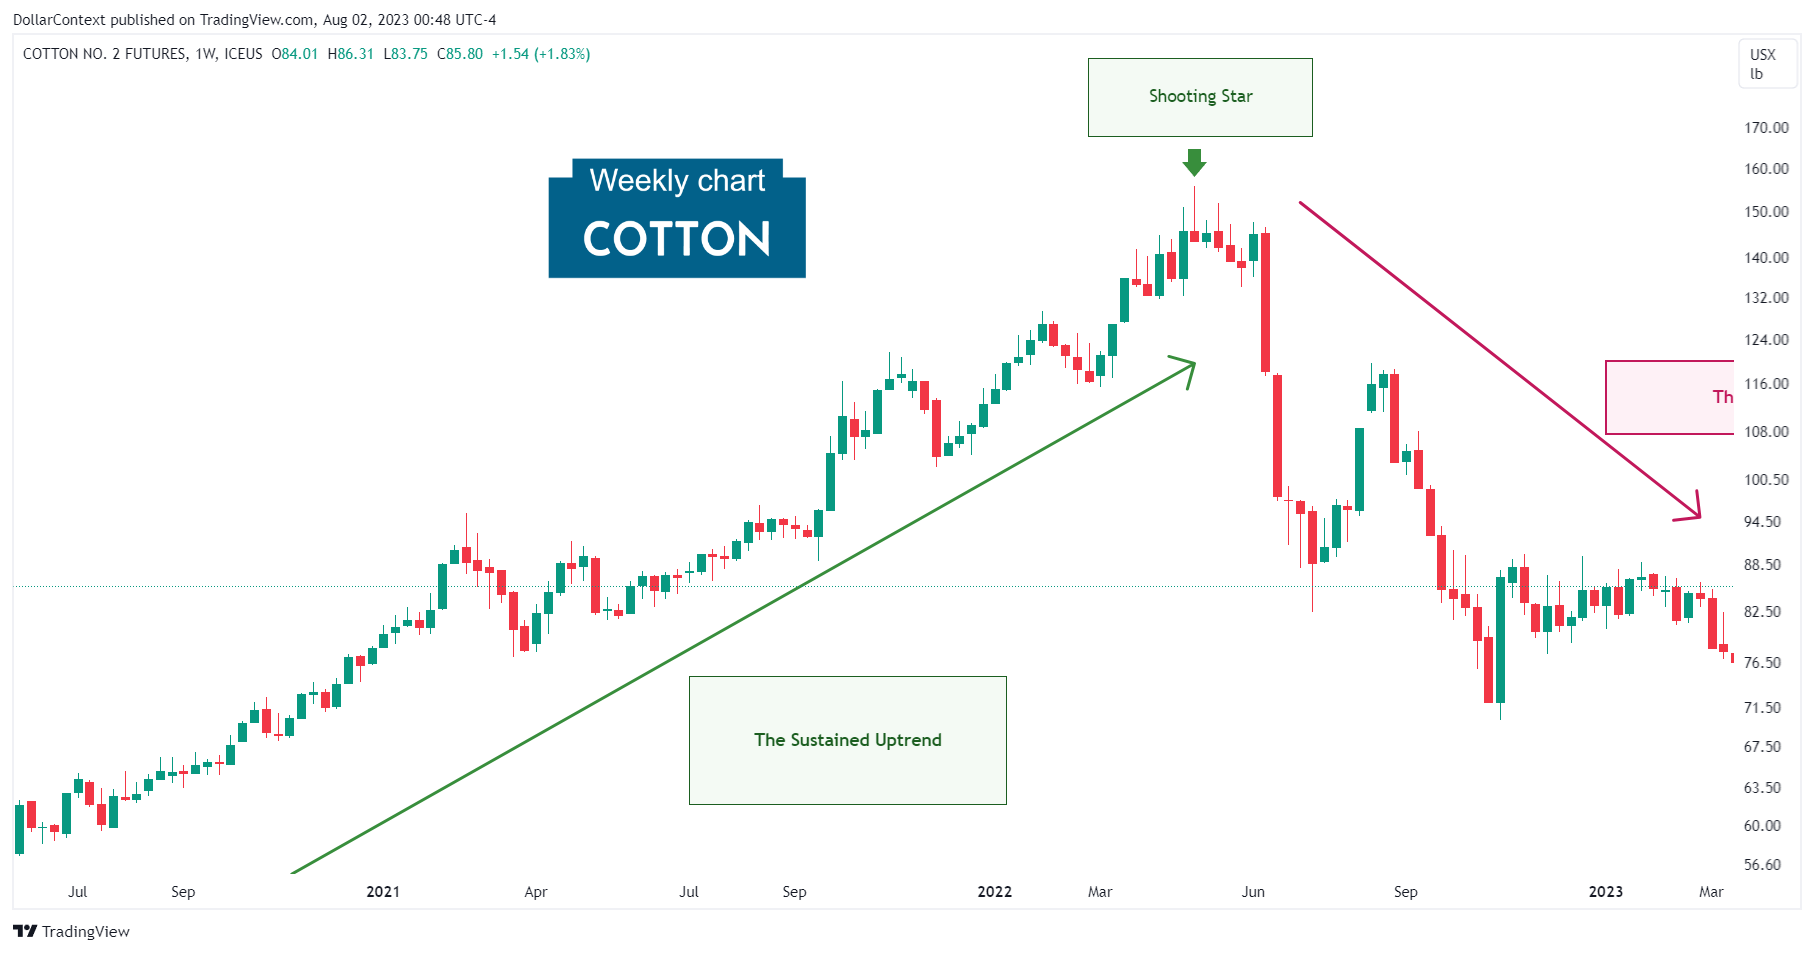
The example below illustrates a shooting star leading to a downward turn in the cotton market.