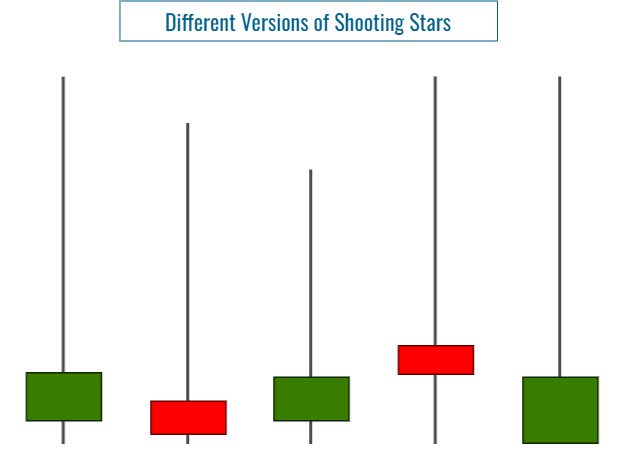
Different Variations of a Shooting Star Pattern
The shooting star pattern consists of a candle with a small real body at the lower end of the candle and a long upper shadow.

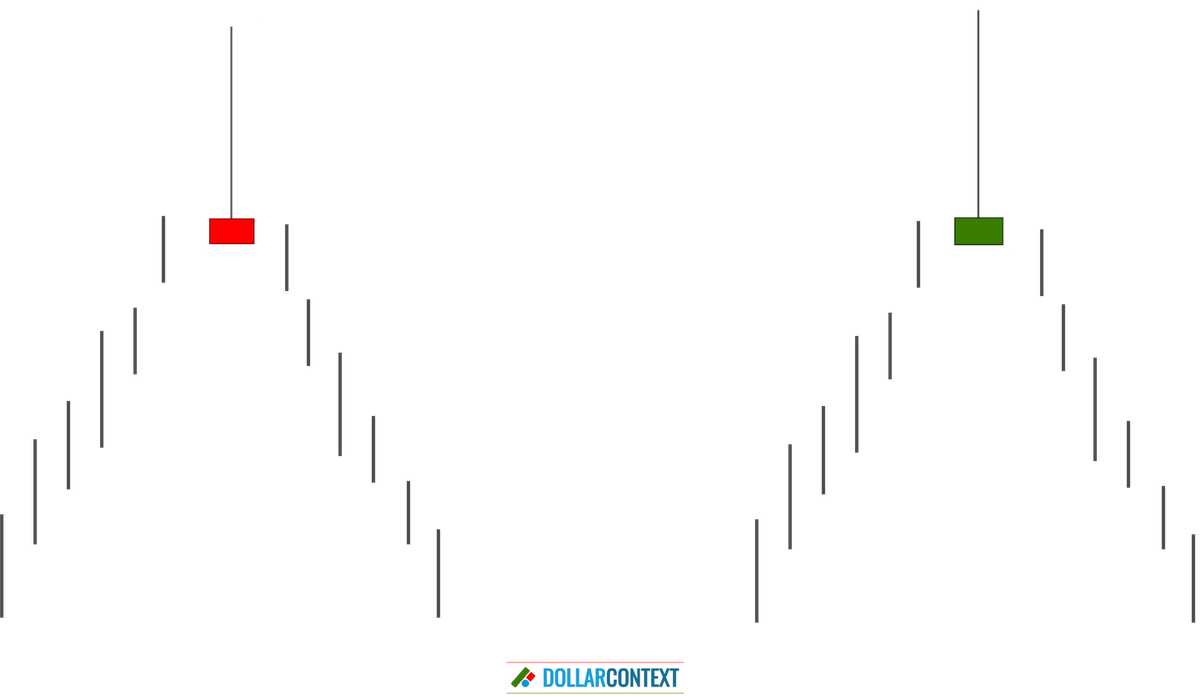
In Japanese candlestick charting, a shooting star is a bearish reversal pattern that comes after an uptrend and signals a potential reversal to the downside. The following attributes characterize this candle line:
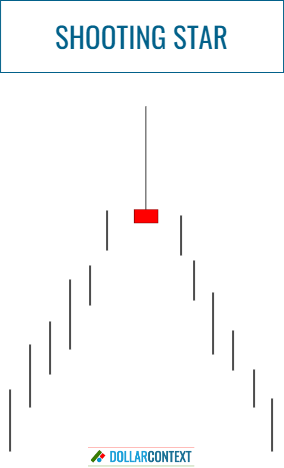
- Small Real Body: A shooting star has a small real body at the lower end of the candle. This body can be either red (or black) or green (or white), but a red/black body is considered slightly more bearish.
- Long Upper Shadow: The shooting star candle has a long upper shadow (wick) that is typically at least three times the size of its real body. This long upper shadow represents psychologically a failure by the bulls to sustain higher prices, with the price pushed back down to close near the low of the day.
- Very Short or Nonexistent Lower Shadow: There should be little to no lower shadow (also known as the tail) beneath the real body.
- Preceded by an Uptrend: A shooting star is a bearish pattern that signals a potential reversal to the downside. To hold significance, it should emerge after a strong or mature uptrend.
- Relative Size of the Candle Line: The general size of a shooting star, primarily determined by the length of its upper shadow, should be comparatively substantial in the context of the preceding candle lines.
A shooting star is basically the inverse of a hammer in Japanese candlestick analysis. While a shooting star is a bearish signal following an uptrend, a hammer reveals a bullish signal after a downtrend, characterized by a small lower body and a long lower shadow.
As mentioned above, a shooting star can also have a white/green body. In fact, the circumstances under which this candlestick pattern appears hold greater significance than the color of the real body.
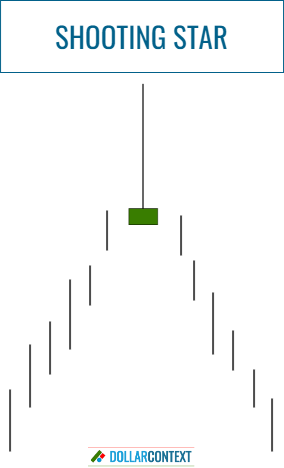
The shooting stars presented above represent the "perfect" shapes of this pattern. However, variations that might not perfectly fit the ideal characteristics can still serve as shooting stars, and therefore as bearish signals. This includes scenarios where the lower shadow is marginally longer, the real body is somewhat larger, or the upper shadow is slightly shorter. As a general rule, however, it's better if the upper shadow is longer, the real body is smaller, and the lower shadow is minimized.
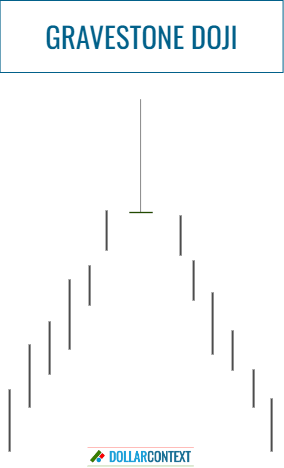
If the open, close, and low prices of a shooting star are all at the same level or very close, the pattern is also called gravestone doji.
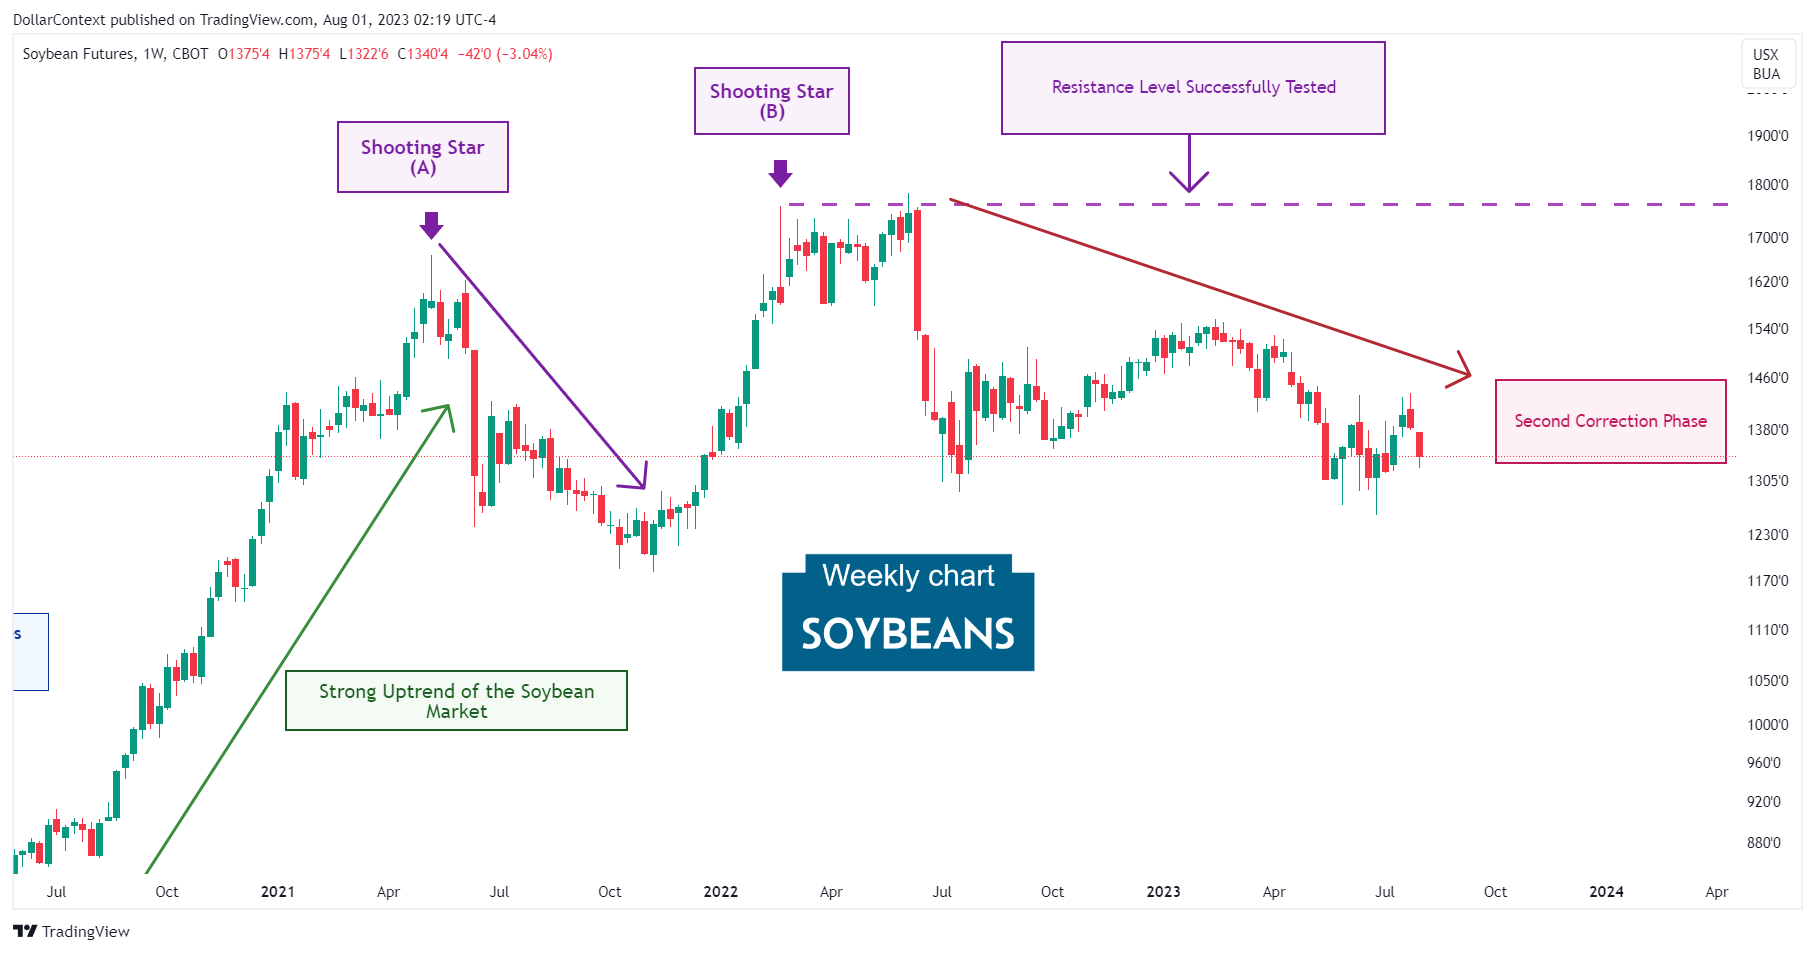
The following soybean futures chart illustrates two instances of shooting stars that served as accurate bearish indicators. Pay attention to the distinct uptrend preceding both instances, along with the significant size of their upper shadows. Also, observe how the second shooting star established a resistance level (denoted by "B" on the chart) that was revisited in subsequent trading sessions.