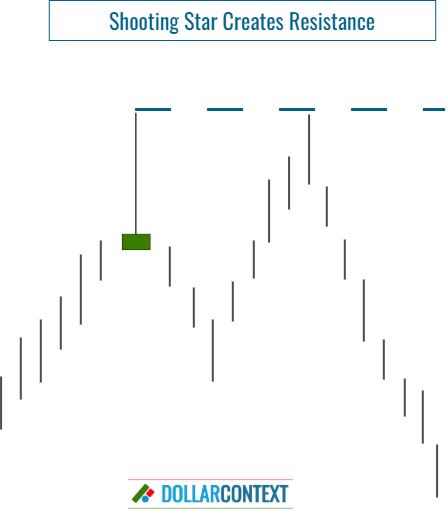
Shooting Star as Resistance
The price range of a shooting star tends to become resistance. In particular, the peak price of this candle line either establishes or reinforces a resistance level.

In Japanese technical analysis, a shooting star is a single-candle pattern with an extended upper shadow and a compact real body situated near the session's low point. It can serve as an indicator, signaling a potential reversal of a currently prevailing uptrend.
The price range of a shooting star tends to become resistance. In particular, the peak price of this candle line either establishes or reinforces a resistance level. Within this framework, we can distinguish between two different scenarios:
- When a shooting star emerges within a previously identified resistance zone, it effectively reaffirms this resistance.
- When a shooting star appears at a fresh peak, it defines a new resistance level.
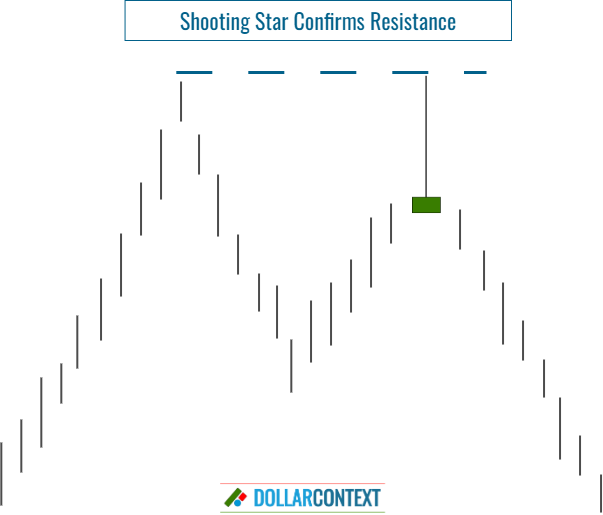
1. Shooting Star Confirms Resistance
If the pattern emerges at a resistance level that was identified beforehand, it strengthens the validity of this resistance and heightens the probability of a successful trend reversal.
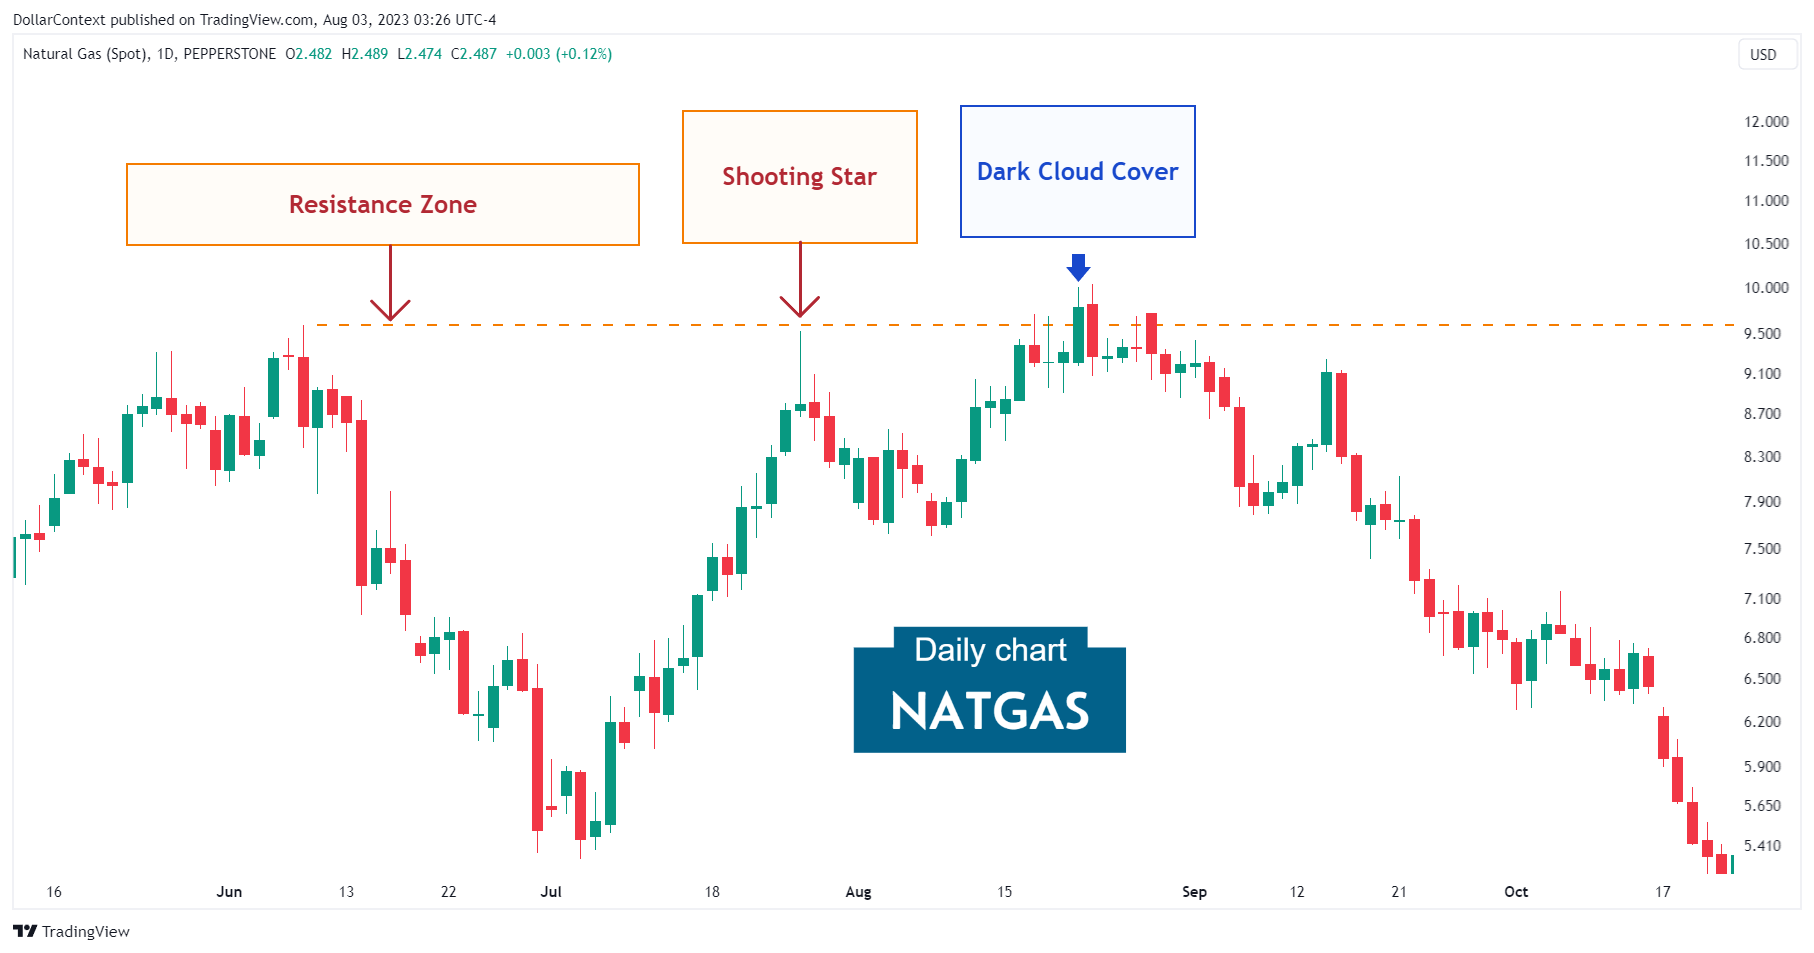
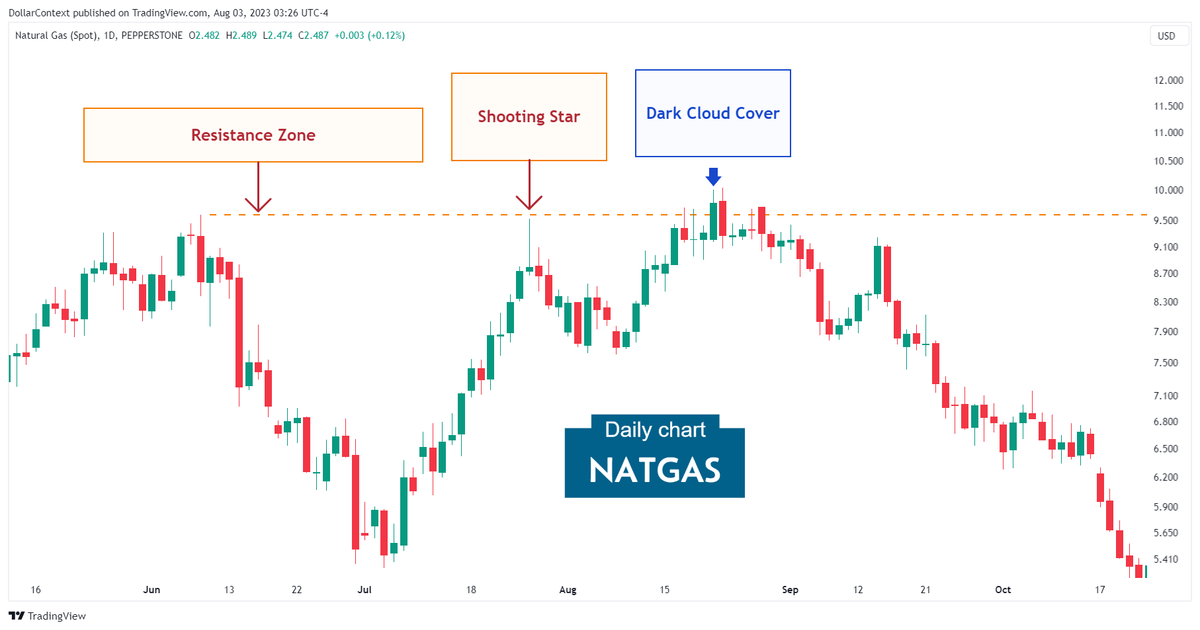
The following chart of natural gas shows that a shooting star confirms a resistance level previously set around $9.5. Observe how this mark was retested, via a dark cloud cover, nearly a month later.
2. Shooting Star Defines Resistance
If the shooting star candle sets a new high, it defines a new resistance zone.
In February 2022, the weekly chart of the soybean market displayed a shooting star. The resistance level set by this pattern was effectively validated in the subsequent sessions.

3. Breakout of the Resistance Level
Like any technical analysis, there should be a price point at which you reevaluate your original strategy, especially in the context of a resistance level set by a shooting star.
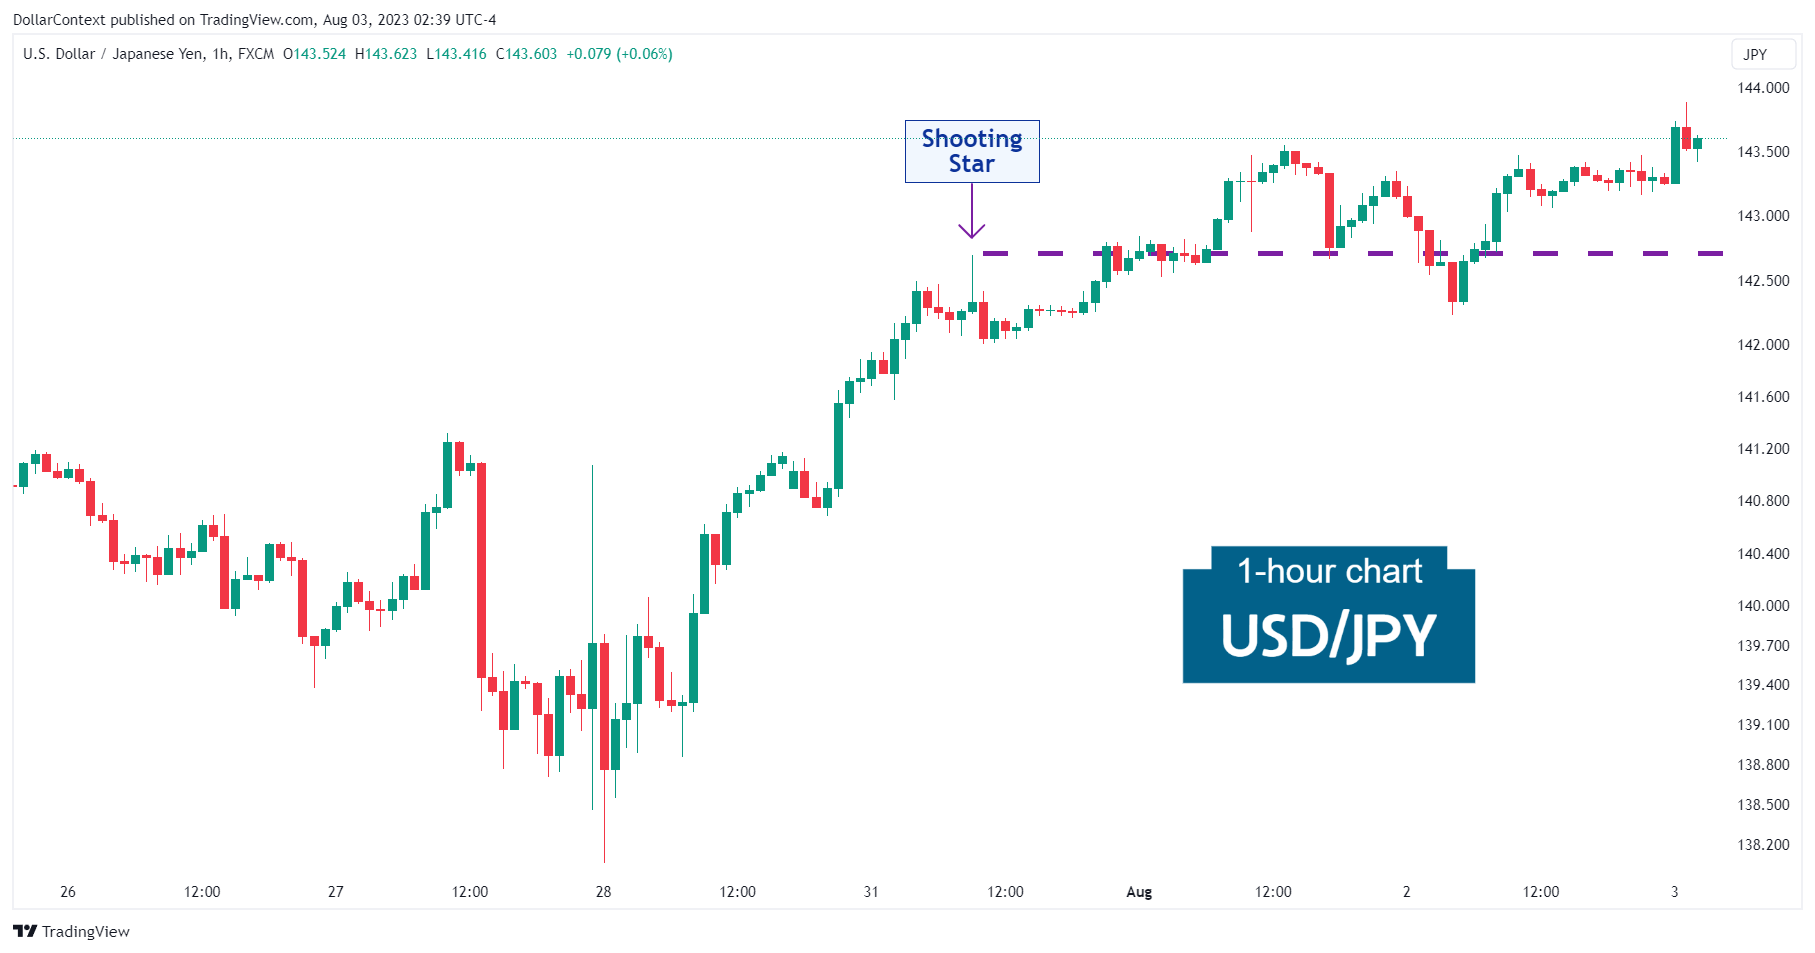
In the case of a shooting star, if a session closes significantly above the resistance peak, it's probable that the market will continue its upward trajectory.
The USD/JPY chart below shows how the price resumes its upward trajectory after breaching the original resistance established by the shooting star.
4. False Breakouts
A breach of a resistance level is frequently perceived as a potential trading cue, carrying the anticipation that the price will persist in the breakout's direction. However, it's not uncommon for the market to defy these expectations. Rather than maintaining momentum in the same direction, it often flips and retraces its steps back into the prior range.
To reduce the chances of being stopped out when using a shooting star strategy, you can follow these steps:
- Base your stop-loss on a session's close instead of using intra-session price fluctuations.
- Consider adding a buffer to your initial stop-loss level.
- Be aware that the reliability of a breakout diminishes significantly if one or more candlestick patterns surface at, or slightly above, the initial resistance level set by the shooting star.
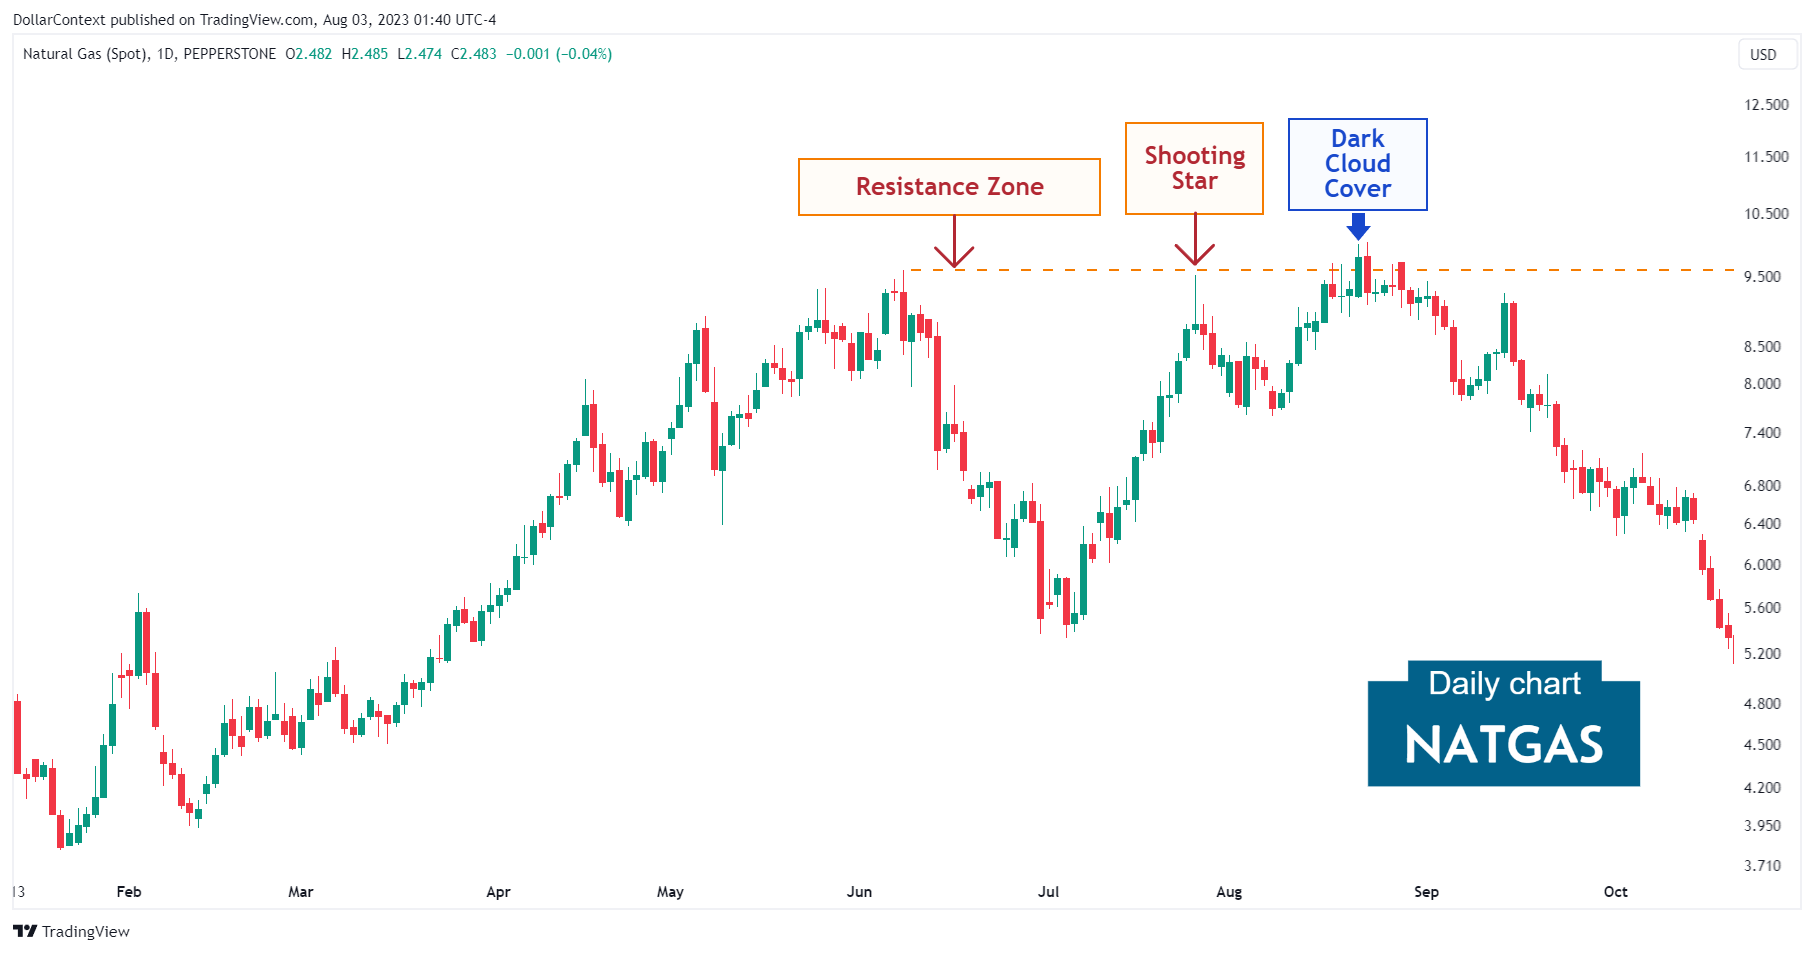
This chart provides a more detailed perspective of the natural gas chart illustrated in section 2. Note the emergence of a dark cloud cover pattern following the shooting star, with the peak of the dark cloud cover surpassing the resistance level established by the shooting star. Nevertheless, the manifestation of an extra candlestick pattern, a dark cloud cover, close to resistance bolsters its authenticity, thereby increasing the likelihood of a reversal.