
The Psychology Behind a High-Wave Candle
A high-wave candle reflects equilibrium, indecision, and volatility: a tug of war between buyers and sellers signaling a reversal or transition.

We’re going to look at an important aspect of candlestick charts: the psychology behind a high-wave candle. To begin with, let’s quickly review the concept of high-wave candles in Japanese candlestick charts.
A high-wave is a single candle line that increases the probability of a reversal and has the following properties:
- The candle emerges after a significant uptrend or downtrend.
- It has unusually elongated upper and lower shadows.
- The length of the upper and lower shadows are similar, but they do not necessarily have to be identical.
- The real body, that is, the range between the session's open and close, is relatively small or nonexistent.
When the real body of a high-wave is diminutive or nonexistent, the candle is frequently referred to as a "long-legged doji" or a "high-wave doji.
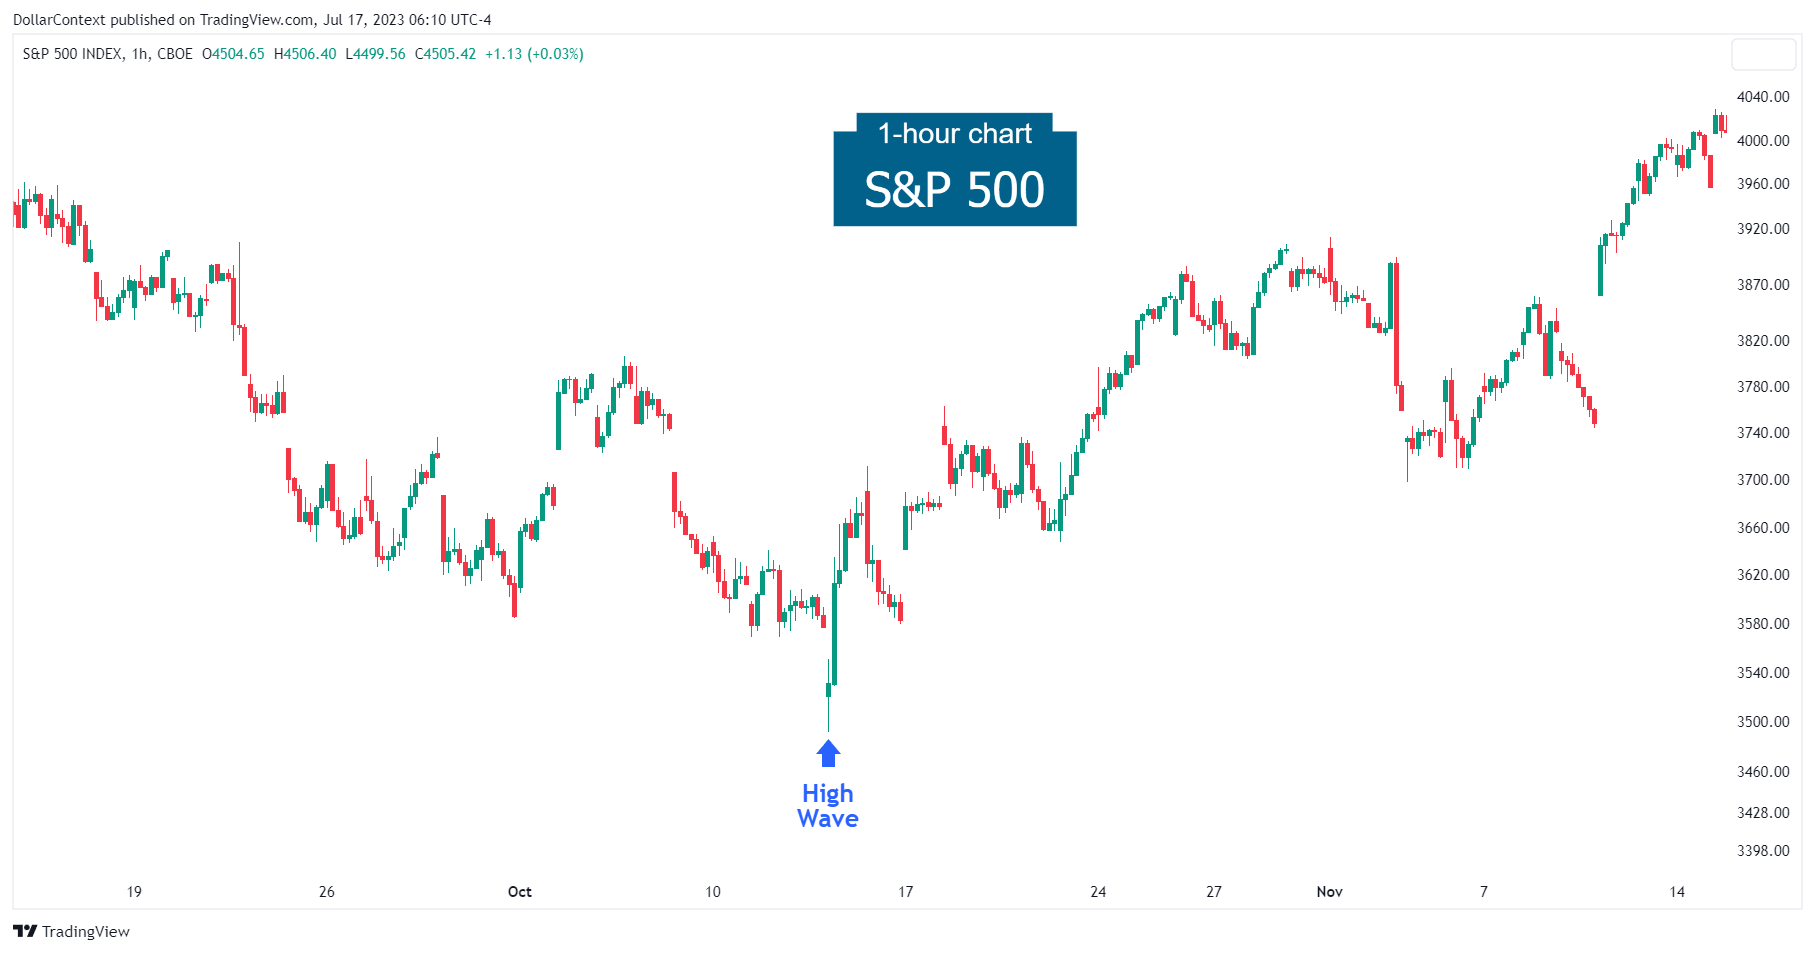
The following example illustrates a trend reversal after a falling gap, which in turn emerges after a notable downtrend.
From a psychological standpoint, the price action exhibited by a high-wave candle can be interpreted as follows:
- Equilibrium: The relatively small size of the real body reflects a state of equilibrium between supply and demand.
- Indecision: The short length of the real body along with the extended upper and lower shadows indicate that there is a battle between buyers and sellers, resulting in a lack of direction in the market.
- Volatility: The extended upper and lower shadows suggest significant price movement during a short period of time.
The presence of a long-legged doji reinforces the psychological aspects described above.
In essence, the high-wave candle reflects psychologically a tug of war between buyers and sellers that can signal:
- Potential Trend Reversal: The greater the strength of the preceding trend, the higher the likelihood of a reversal taking place. In other words, the occurrence of a high-wave candle following an excessively optimistic (or pessimistic) market enhances the probability of a reversal.
- Transition Point: The uncertainty conveyed by a high-wave candle can persist for an undetermined number of sessions. Typically, but not always, this transition is characterized by a sideways movement. Eventually, the market will inevitably resolve into either a continuation of the current trend or a reversal.
One should be particularly cautious about a high-wave candle that emerges after an exceptionally tall white candle or a rising gap, which in turn arises after a solid uptrend. Apply the same logic to tall black candles.


