
How to Recognize a High-Wave Candle
High-wave candles are reversal patterns that appear at the end of a strong trend. They have long upper and lower shadows, and their real bodies are frequently small.

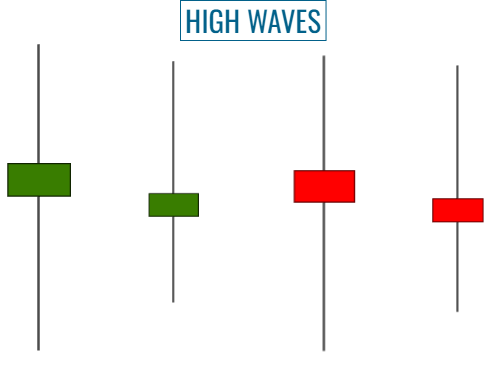
In candlestick charts, a high-wave candle is a single-candle pattern that can be identified by the following visual attributes:
- Shadows' length. A high-wave candle has unusually long upper and lower shadows.
- Shadows' proportion. The size of the upper and lower shadows do not necessarily have to be identical. However, as said before, both are significantly long.
- Real body's size. The real body is typically small or nonexistent.
- Real body's color. The color of the real body is irrelevant. It can be either green or red.
- Candle's size. The overall size of a high-wave, including its shadows, is noticeably significant in comparison to the preceding candles.
A high-wave conveys (psychologically) the notion of equilibrium, indecision, and volatility in the market.
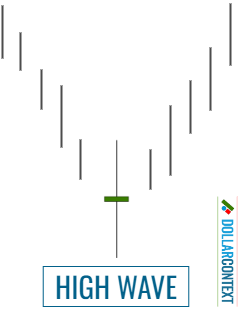
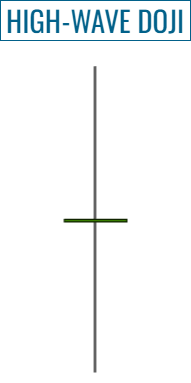
This chart depicts the ideal form of a high-wave candle:
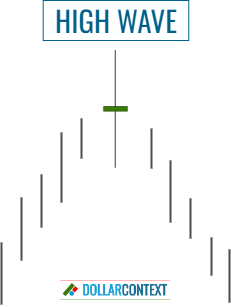
High-wave candles are reversal patterns that appear at the end of a strong trend. These lines have long upper and lower shadows, and their real bodies are frequently small.
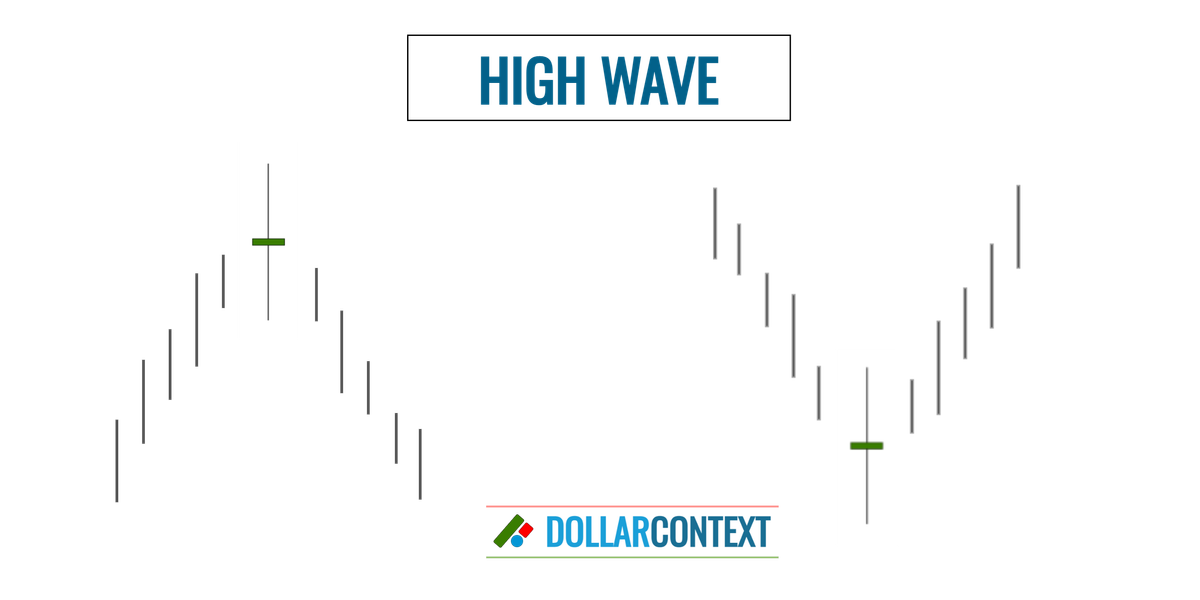
Remember, because high-waves are reversal patterns, they should appear after either an uptrend or a downtrend. The stronger the preceding trend, the more likely the reversal to occur.
The shape of the candle doesn’t have to be perfect or ideal. As you can see below, this pattern can be found in a variety of shapes. However, make sure that:
- The relative size of the high-wave is relatively large compared to previous candles.
- The preceding trend is significant; that is, the high-wave line emerges in the context of an overbought or oversold market.
Typically, but not always, the smaller the real body, the more reliable the pattern is. If the session's open and close are the same (or almost the same), the real body forms essentially a horizontal line. In this case, the high-wave candle is also referred to as a high-wave doji or a long-legged doji.
The following exhibit shows an example of two high-waves (indicated by “1” and “2” on the chart) rising after a robust rally. Observe that the second high-wave is a high-wave doji or long-legged doji.
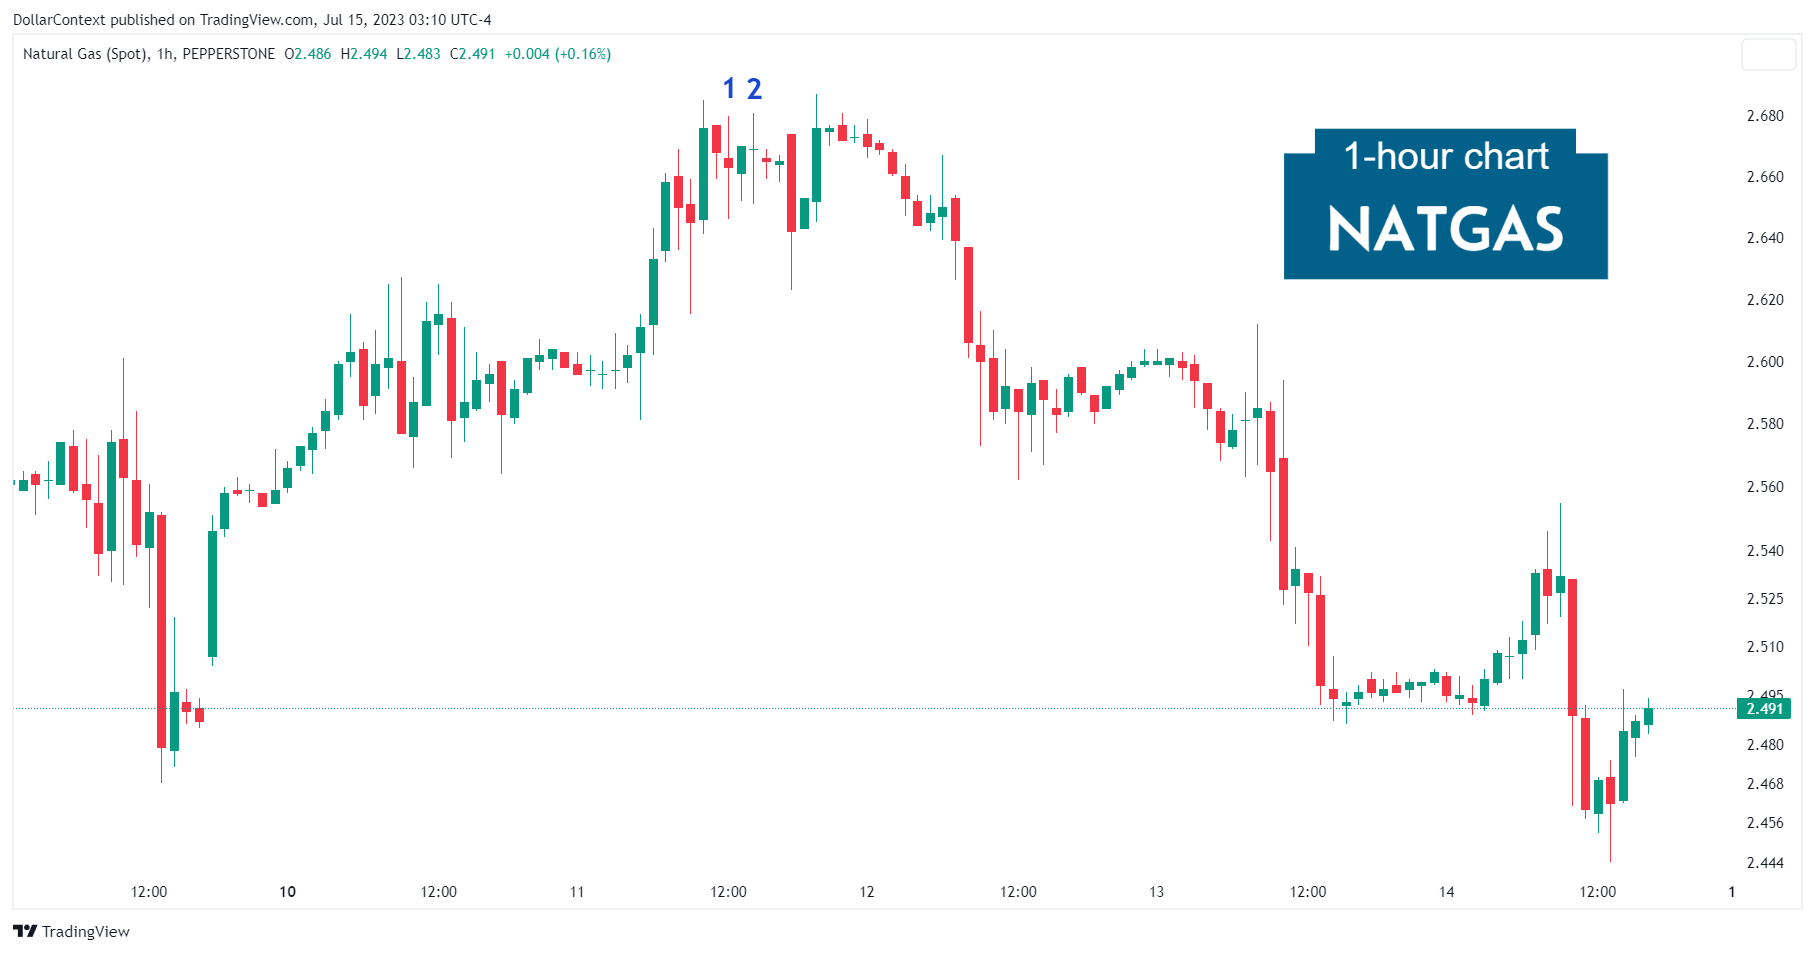
Notice that five sessions after the high-wave number 2, the market decided to test the highs of the two high-wave candles before initiating the decline.


