Springs in Trading: Concept, Types, and Strategies
The spring is a powerful trading concept that can provide traders a glimpse into a possible shift in market mood.
Among the plethora of strategies employed by traders, one intriguing concept that has gained relevance is the spring. Springs are a crucial component of technical analysis, offering insights into potential market reversals and opportunities.
In this post, we'll explore the engaging world of springs, an idea championed by Richard Wyckoff in the early 1900s. We'll examine their significance and how to use them effectively in trading strategies.
Contents
1. What Is a Spring?
A spring refers to a price movement in which the market briefly breaches a support level, but quickly reverses and moves back in the opposite direction. Essentially, it's a false breakout to the downside.
The term originates from the idea that, just like a compressed spring, price action can suddenly and powerfully bounce back after seeming to move in a particular direction.
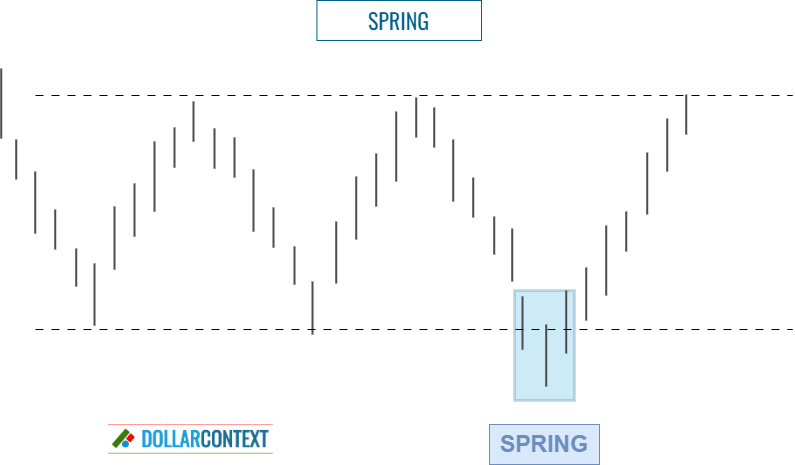
In technical analysis, a spring is the opposite of an upthrust. While a spring temporarily breaks through a support level, an upthrust momentarily crosses above a resistance level.
The characteristics of a spring include:
- Price breaks support: Initially, prices will move below a recognized support level.
- A rapid reversal occurs: After dipping below the support, the price swings back into the trading range, signaling an inability to sustain the breakout.
The spring showcases the interplay of supply and demand in a condensed time frame. When prices dip below a support level, it might attract buying interest from those who consider the asset undervalued. This sudden surge in demand can lead to the sharp reversal that characterizes this pattern.
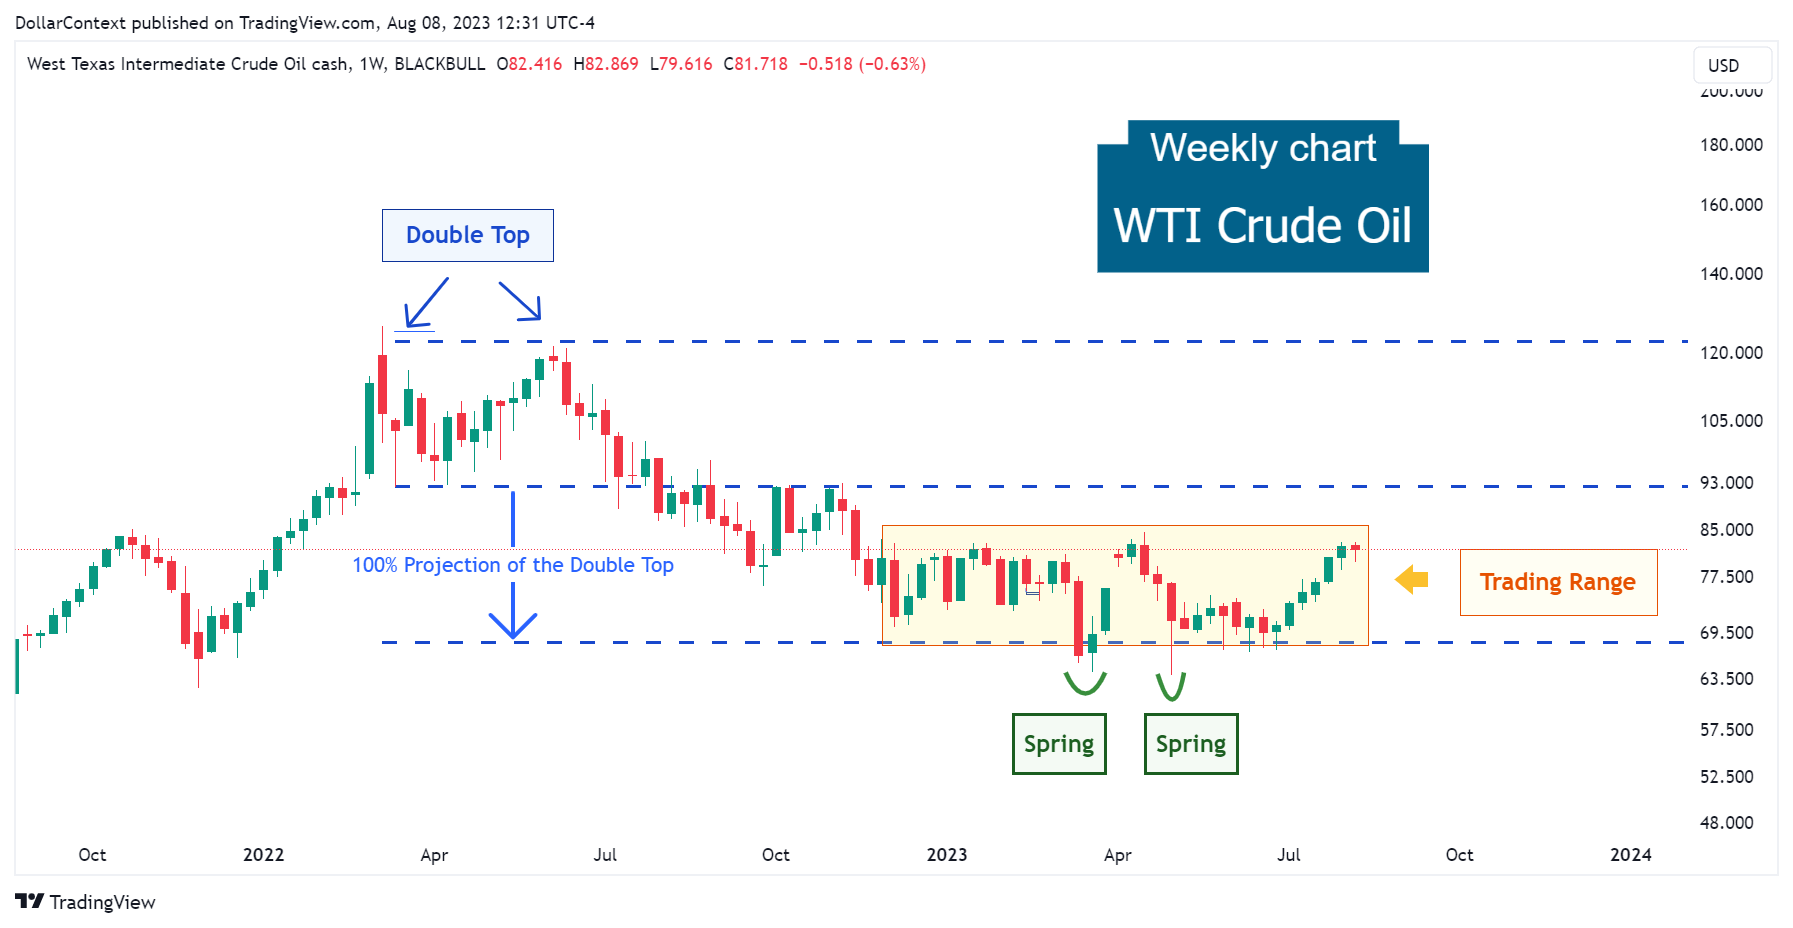
In March and May 2023, the WTI crude oil chart displayed two springs in the context of a trading range. Observe the rapid return to the prior range on both occasions.
2. Types of Springs
Market springs can manifest in varied forms and scales, shaped by multiple factors, such as:
- Context in which a spring emerges
- Speed of the market move during the spring
- Magnitude in price of the spring
- Area of technical analysis used to establish the support
- Outcome or result in terms of price action after the appearance of a spring
2.1 Context
Depending on the context of a spring's appearance, we can categorize them as:
- Trading Range Springs: Springs that arise within a trading range phase.
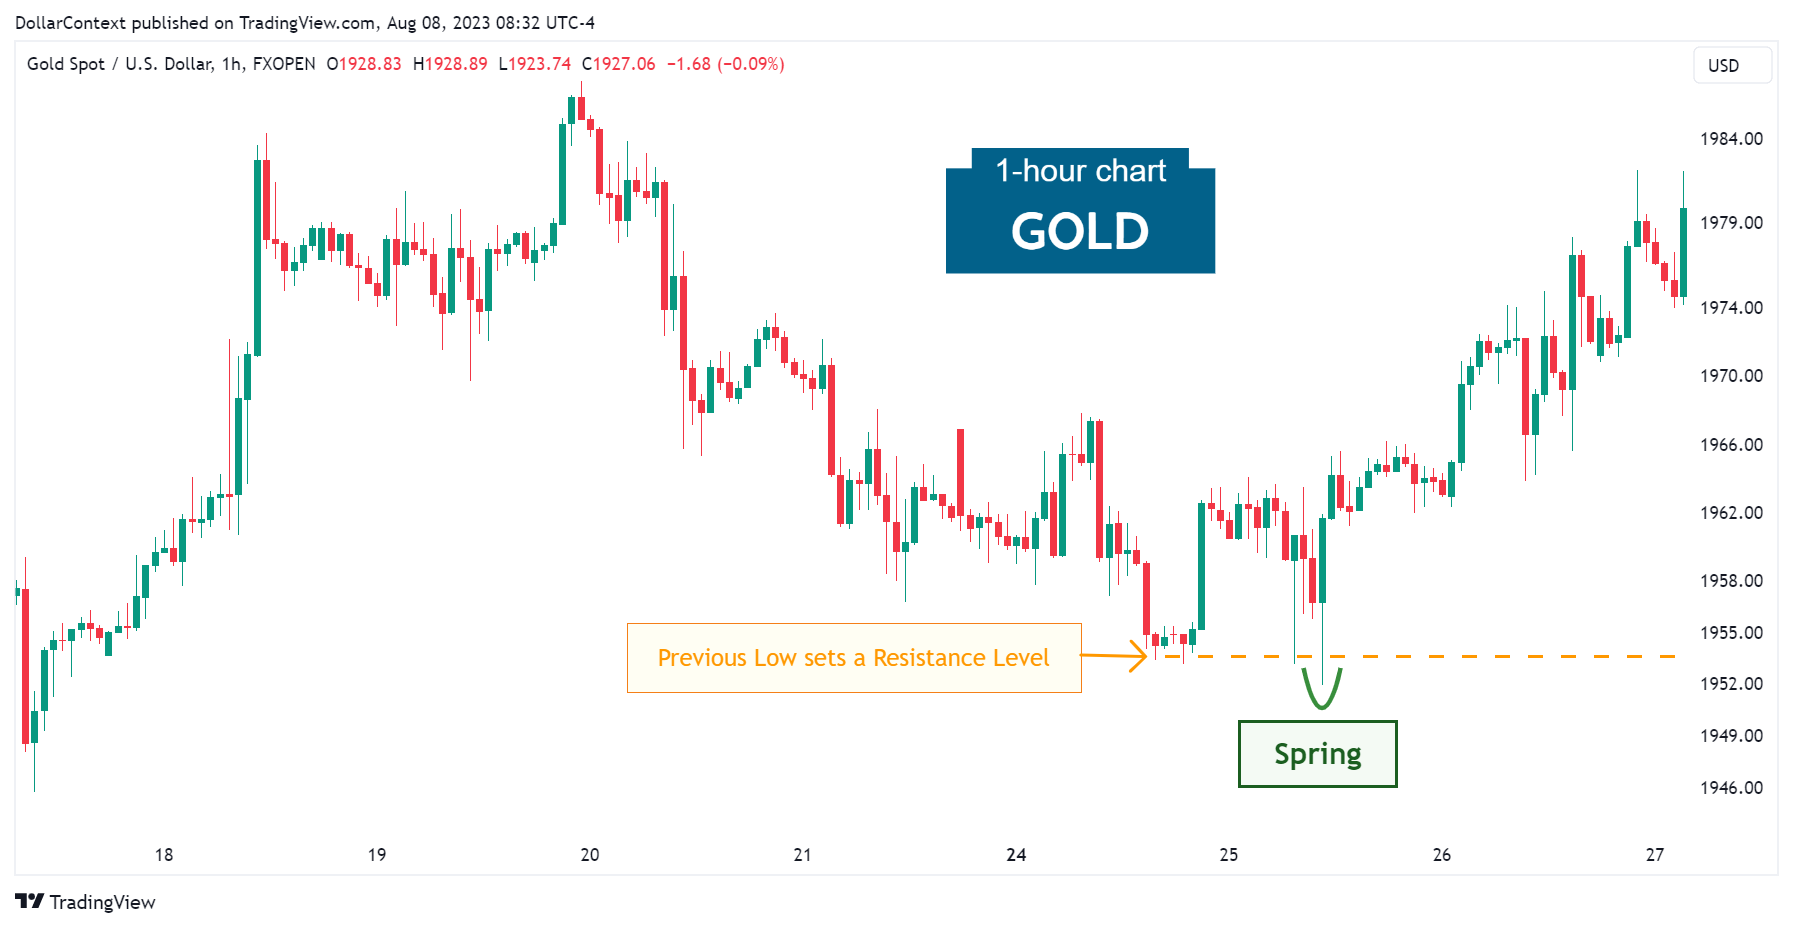
- Support Level Springs: Springs that manifest in reference to a previous support level, distinct from the lower limit of a lateral range.

The following chart of gold illustrates a spring after a previously established support mark.
2.2 Speed
Based on the pace of market shifts, we can classify springs as fast, medium, or slow.
- Fast springs swiftly return to the trading range after surpassing the support level.
- Slow springs take more time before rising back above the support threshold.
- Medium-speed springs fall in between the fast and slow types.
2.3 Magnitude
We can also distinguish between minor and major springs:
- Minor springs are subtle occurrences where the breach of support is not very significant, and the price rebounds swiftly.
- Major springs depict a more pronounced and evident breach of the support zone, which might trap more traders before reversing back up.
2.4 Areas of Technical Analysis
Additionally, we can distinguish among different types of springs based on the specific aspect of technical analysis that helps us pinpoint the support region where a spring emerges.
- Chart Patterns: head and shoulders pattern, double bottom, etc.
- Trend Analysis: uptrends, downtrends, and lateral ranges.
- Candlestick Analysis: hammer, morning star, piercing pattern, etc.
- Wickoff Method: Within the framework of the Wyckoff Method, a spring is a specific price action event that is indicative of accumulation and potential market strength.
- Fibonacci's Retracements and Extensions: 23.6%, 38.2%, 61.8%, 161.8%, etc.
- Technical Indicators and Oscillators: SMA, RSI, MACD, etc.
- Elliott's Wave Analysis
- Gap Analysis
- etc.
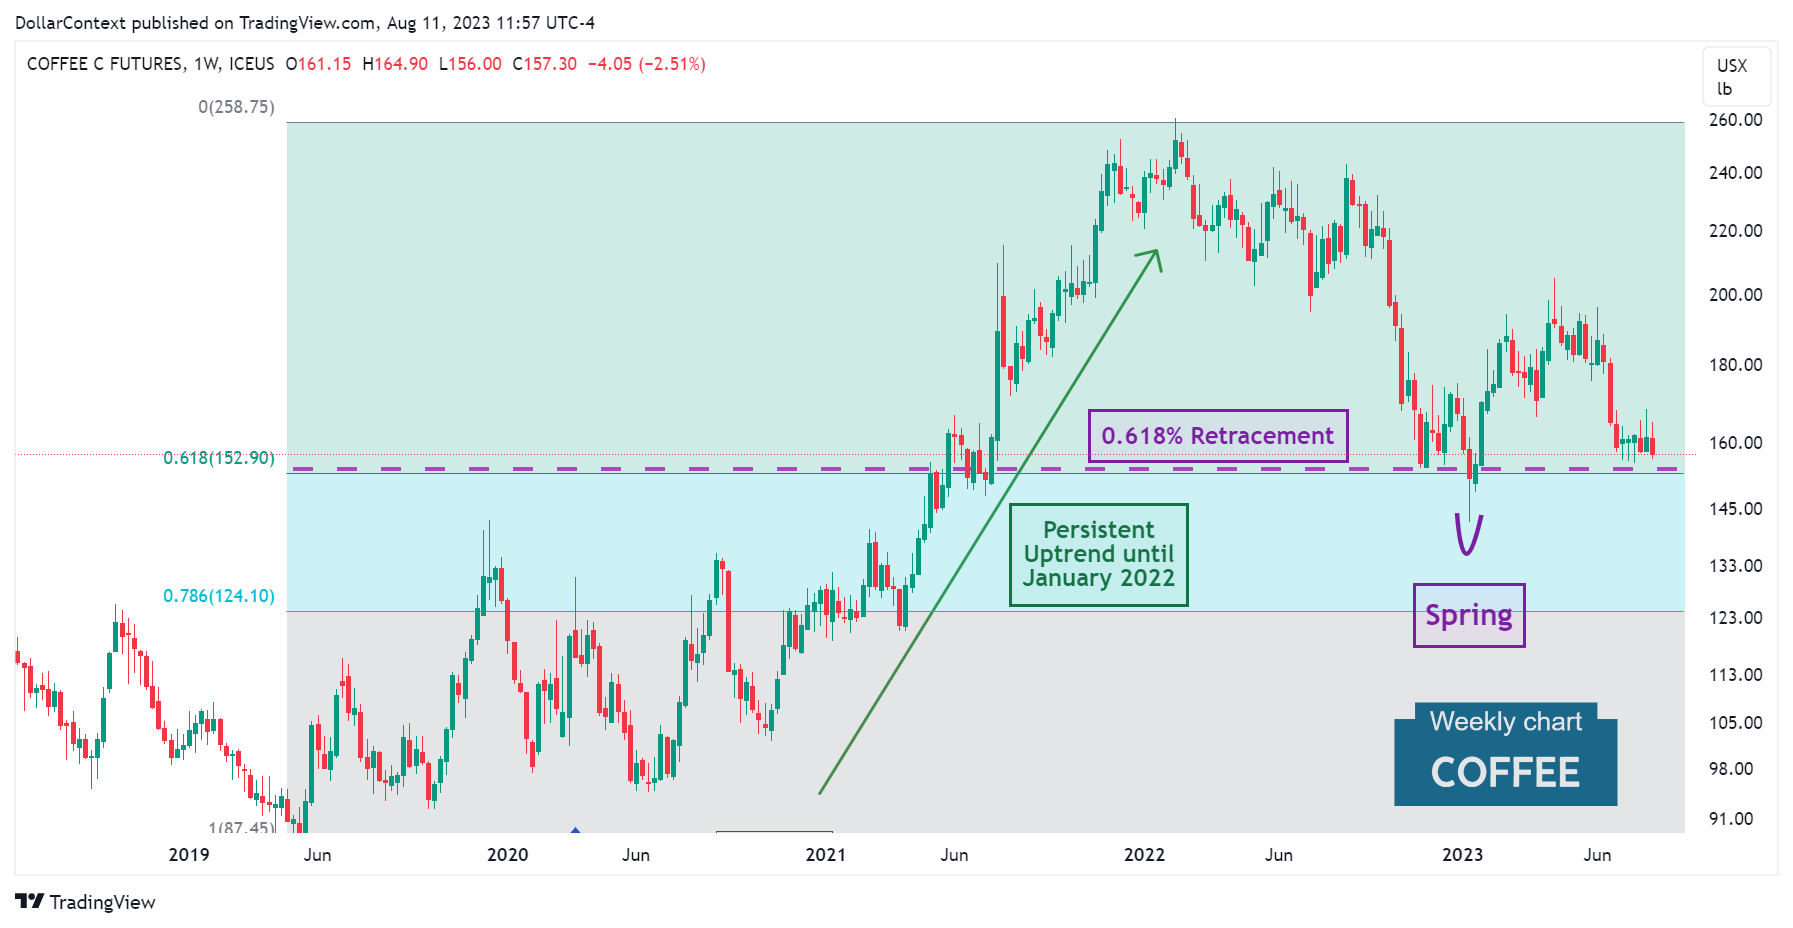
The following example shows a spring emerging around the 0.618 retracement of a prolonged uptrend in the coffee market.
2.5 Result
Based on the result in terms of price action, we can identify different outcomes after the appearance of a spring:
- The market rebounds to the top limit of the range and consistently remains within that boundary.
- The market ascends to the halfway point of the trading range only to go down once more.
- The price shifts into a new uptrend.
- etc.
3. Implications of a Spring
Here's an outline of the implications of the emergence of a spring in market analysis:
- Bullish Reversal Signal: A spring is typically seen as a bullish reversal pattern. It indicates a false breakdown below a trading range's support before a reversal upwards.
- Bearish Trap: As prices drop below support, many traders might see this as a breakout to the downside, and hence sell or short-sell their positions. However, when the spring is in play, these traders are "trapped", and the swift reversal can lead to a sharp price increase.
- Accumulation Phase Indicator: A spring can often signify the end of an accumulation phase, suggesting that institutions or "smart money" have accumulated their desired position and are ready for the next phase, which is usually an uptrend.
- Increased Buying Pressure: The rapid recovery after the spring indicates strong buying pressure, which can be a precursor to a continued upward move.
- Volume Analysis: For a spring to be valid, especially in the context of the Wyckoff method, the volume during the spring (or the test of the spring) is crucial. Lower volume during the breakdown followed by increased volume during the reversal can validate the spring.
- Importance of Resistance Levels: After a spring, traders will often watch for the price to test and potentially breach resistance levels within the trading range.
- Potential Buying Opportunity: For traders who can identify a spring early, it can provide an opportunity to open a long position.
4. Trading Strategy
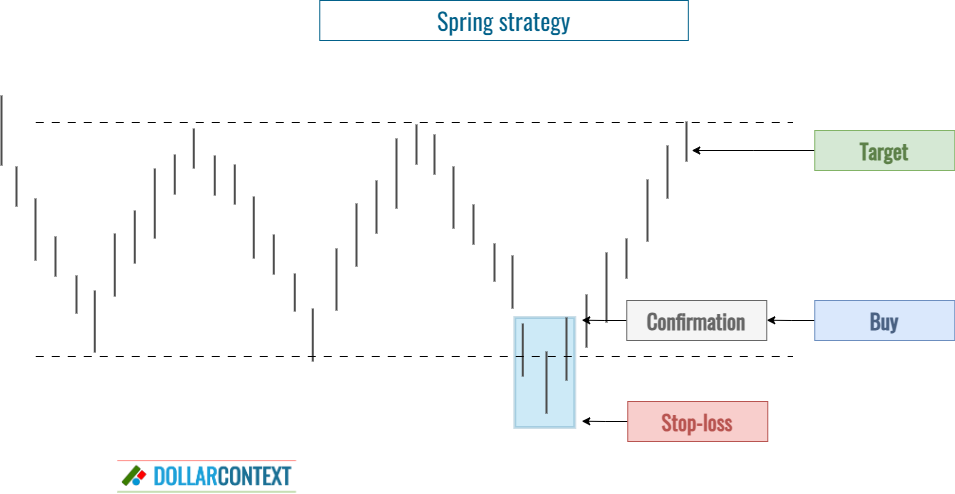
While you can use different spring strategies, we suggest embracing a straightforward approach, like the one outlined below.
When to open a long position
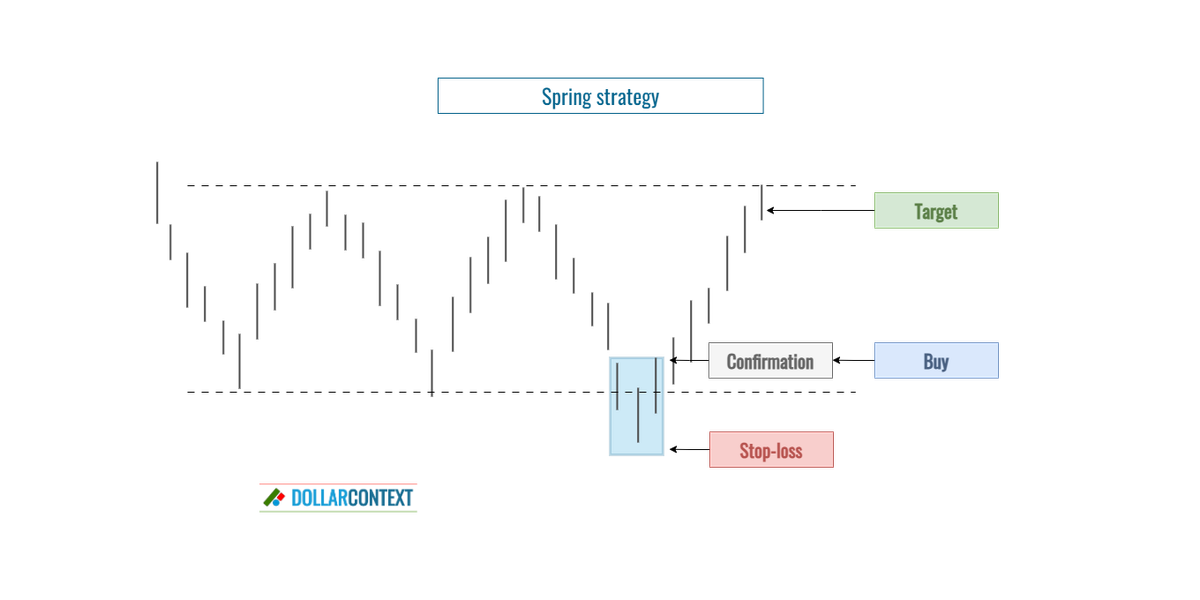
After spotting a possible spring, a trader may contemplate initiating a long position following additional bullish confirmation. This verification could appear as a bullish candlestick pattern, a climb from the spring towards the earlier range, or through other bullish indicators.
Stop-loss
If a trader decides to buy after the emergence of a spring, placing a stop loss slightly beneath the spring's low would be a wise decision.
Target
The objective for a spring strategy should hinge on the specific circumstances of the market, one's risk comfort zone, and the predetermined stop-loss level. Nevertheless, it's important to keep in mind the following factors:
- If a spring emerges in the context of a sideways move, your initial target should be close to the range's upper boundary.
- If the spring emerges in connection with a previously set support zone, the objective could be the next resistance level above where the spring originated.
5. Conclusion
The spring represents a robust trading concept, mirroring a struggle between the bulls and bears. If the bears cannot hold their position, it offers traders a glimpse into a possible shift in market mood. As with all trading techniques, one should approach springs prudently, ensuring sound risk management, and integrating them with other analytical instruments for better results.


